
Bitcoin and several major cryptocurrencies have been stuck in listless sideways price action for the past several weeks. There is a silver lining in this range-bound action because Bitcoin has not broken below its June low even though the S&P 500 and the Nasdaq hit new year-to-date lows last week. This is a sign that the weakness in the United States equities markets has not caused a capitulation in Bitcoin.
The US consumer price index rose 0.4% in September, more than the Dow Jones estimate of a 0.3% rise. That caused a sharp sell-off in risky assets on October 13 on fears that the Federal Reserve will have to continue with its gigantic rate hikes to curb inflation. CME’s FedWatchTool shows a 98.9% probability of a 0.75% rate hike in November and a 66.4% probability of another 0.75% rate hike in December of this year.
Bitcoin rebounded off the low of its $18,150 to $20,500 range on October 13. This indicates that lower levels are attracting buyers. The number of Bitcoin out of circulation, either due to being lost or kept in cold storage, reached a five-year high of about 40% of the current supply, according to Glassnode data. This suggests investors are not keen to sell their holdings at lower levels. A mild positive was that smaller investors have been adding to their Bitcoin holdings, which has pushed the number of wallets with one Bitcoin or more to a new all-time high of 908,000, Glassnode data showed.
Bill Miller, the chairman and chief investment officer of Miller Value Partners, said while speaking at the Forbes/SHOOK Top Advisor Summit in Las Vegas that Bitcoin could act as “an insurance policy against financial disaster.” He expects Bitcoin to perform better than the other markets. Miller added that the best time to buy is when pessimism is at its high.
What are the important levels that could signal a trend change in Bitcoin and the major altcoins? Read our analysis of the major cryptocurrencies to find out.
BTC/USD Market Analysis
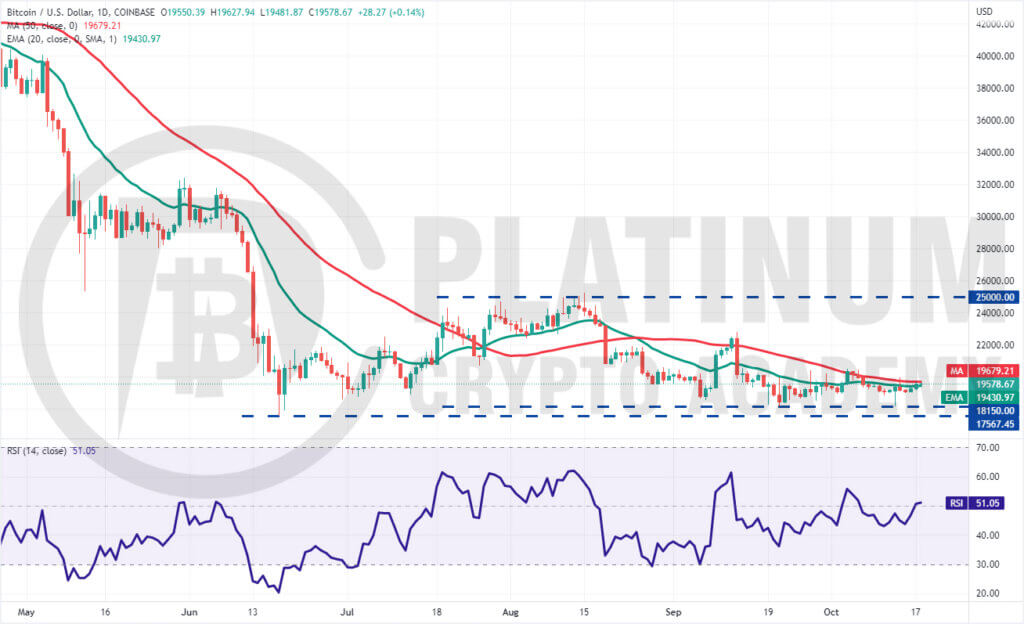
We mentioned in our previous analysis that buyers are expected to aggressively defend the zone between $18,600 and $18,153 and that is what happened. Bitcoin plummeted to $18,131 on October 13 but the long tail on the day’s candlestick shows strong buying at lower levels.
Both moving averages have flattened out and the relative strength index (RSI) is near the midpoint, indicating a balance between supply and demand. The price has been stuck in a range between $18,150 and $20,500.
The recovery has reached the moving averages which may act as resistance but if bulls push the price above it, the next stop could be $20,500.
This is an important level to keep an eye on because if bulls clear this hurdle, the BTC/USD pair could pick up momentum and soar to $22,800. The bears are again expected to defend this level with vigor.
On the downside, the bears need to break the strong support zone between $18,150 to $17,567 to start the next leg of the downtrend.
ETH/USD Market Analysis
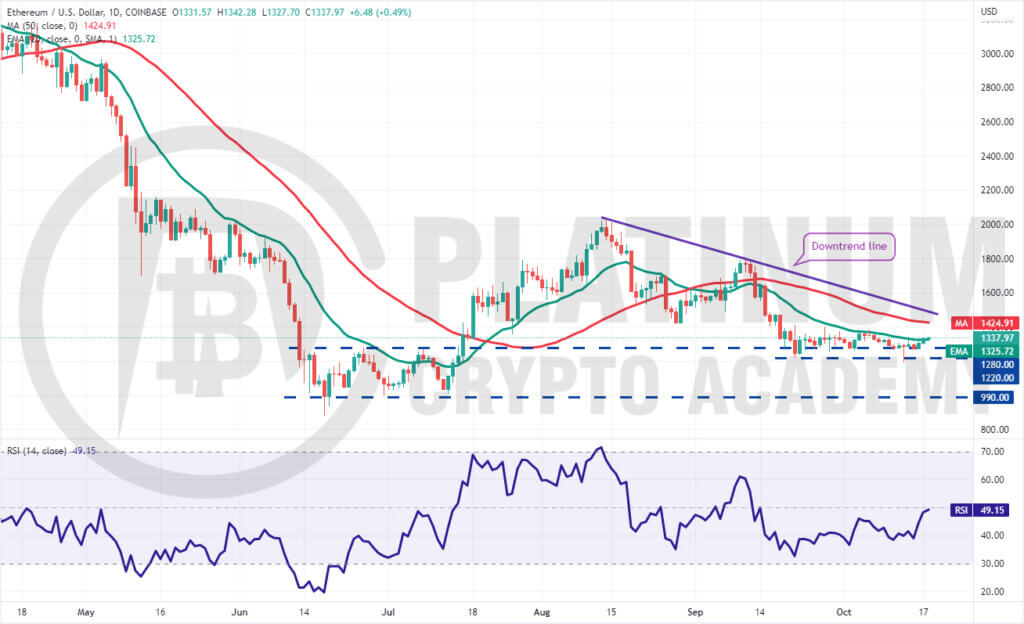
Ether plunged below the $1,280 to $1,220 support zone on October 13 but the bears could not sustain the lower levels. The bulls actively purchased the dip and pushed the price back above $1,280 as seen from the long tail on the day’s candlestick.
Buyers continued their purchase and are trying to sustain the price above the 20-day exponential moving average (EMA). If they manage to do that, the ETH/USD pair could rise to the 50-day simple moving average (SMA) and then to the downtrend line.
The bulls will have to push and sustain the price above the downtrend line to indicate a possible trend change in the near term. The flattish 20-day EMA and the RSI near the midpoint suggest that the selling pressure could be reducing.
If bears want to regain the upper hand, they will have to sink and sustain the price below the support at $1,190. If they can pull it off, the pair could start its decline toward the vital support at $990.
BNB/USD Market Analysis
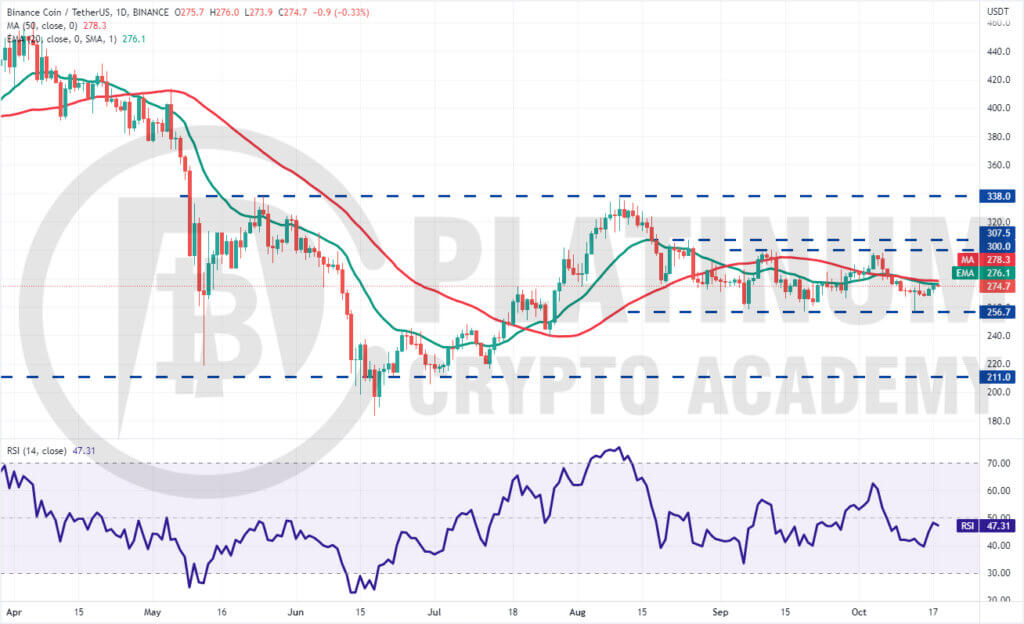
We highlighted in our previous analysis that the bulls are expected to defend the $256.70 level as they had done on two previous occasions and the buyers did just that.
The long tail on the October 13 candlestick shows aggressive buying near the support at $256.70. The relief rally has reached the moving averages where the bears are posing a challenge.
If buyers drive the price above the moving averages, the BNB/USD pair could attempt a rally to $300. The zone between $300 and $307.50 could witness aggressive selling by the bears.
The flattening moving averages and the RSI just below the midpoint suggest a range-bound action in the near term. The next trending move could begin on a break above $307.50 or below $256.70.
XRP/USD Market Analysis
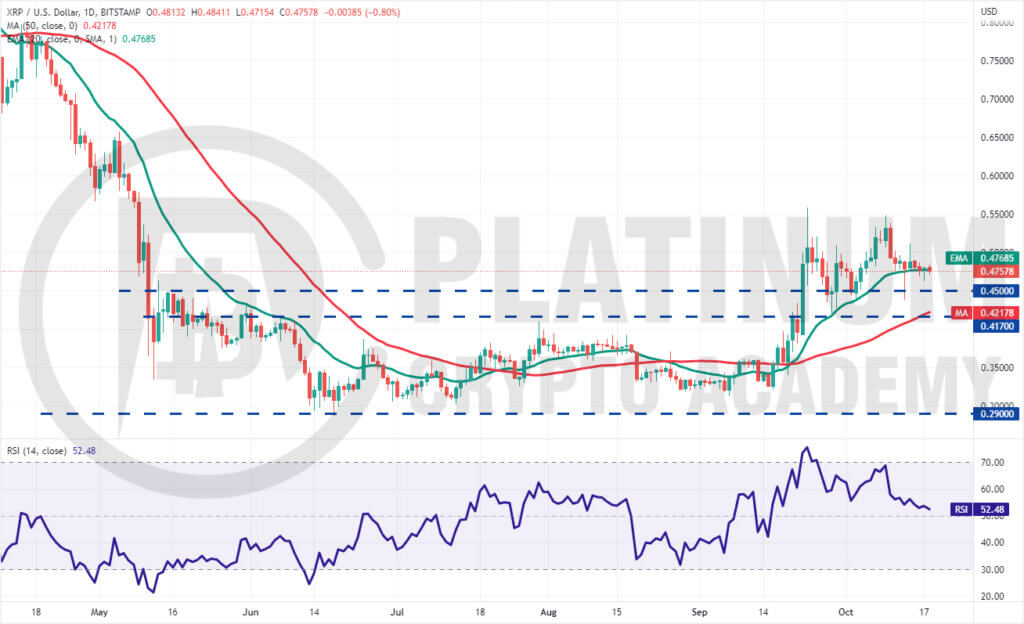
We had projected in our previous analysis that bulls are expected to defend the $0.45 to $0.41 zone with vigor and they did that. XRP rebounded sharply off $0.44 on October 13 as seen from the long tail on the candlestick.
The 20-day EMA has flattened out and the RSI is near the midpoint, indicating that the bullish momentum has weakened. This suggests that the XRP/USD pair could remain stuck in a range for a few days.
If the price breaks below the 20-day EMA, the pair could again slide to $0.45 and later to $0.41. The bulls are likely to buy this dip aggressively. A strong rebound off this zone could suggest that the pair may extend its stay inside the range for a few more days.
Another possibility is that the price rebounds off the 20-day EMA. In that case, the pair could rise to the overhead zone between $0.52 and $0.56. The bears are expected to defend this zone but if bulls overcome the barrier, the pair could resume its uptrend.
ADA/USD Market Analysis
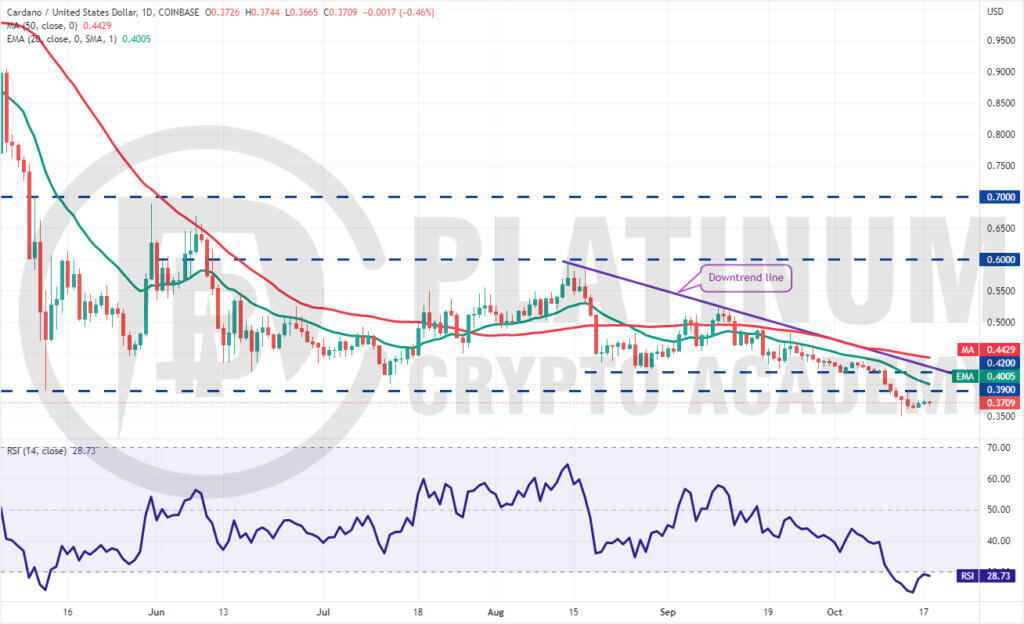
Cardano plummeted below the support at $0.39 and dropped to $0.35 as we had projected in the previous analysis. The sharp decline pulled the RSI into deeply oversold territory, indicating that a pullback or consolidation is possible in the near term.
Buyers will try to push the price to the breakdown level of $0.39. If bears flip this level into resistance, the ADA/USD pair could witness another round of selling. If bears sink the price below $0.35, the pair could extend its decline to $0.32.
The downsloping moving averages and the RSI in the oversold territory indicate that bears are in control.
If bulls want to avert a collapse, they will have to quickly push the price above the 20-day EMA. Such a move will be the first indication of accumulation at lower levels. A break and close above the 50-day SMA will signal a potential trend change in the near term.
.
Hopefully, you have enjoyed today’s article for further coverage please check out our crypto Blog Page. Thanks for reading! Have a fantastic day! Live from the Platinum Crypto Trading Floor.
Earnings Disclaimer: The information you’ll find in this article is for educational purpose only. We make no promise or guarantee of income or earnings. You have to do some work, use your best judgement and perform due diligence before using the information in this article. Your success is still up to you. Nothing in this article is intended to be professional, legal, financial and/or accounting advice. Always seek competent advice from professionals in these matters. If you break the city or other local laws, we will not be held liable for any damages you incur.
")