Bitcoin has been trading inside a tight range for the past several days, indicating that the selling has dried up but bulls are wary of buying aggressively. That could be because investors remain cautious about the wider fallout of the FTX bankruptcy and the upcoming economic events this week.
The consumer price index data for November is due to release on December 13 and will be watched closely by investors. An uptick in inflation may trigger aggressive selling by the bears, causing a sharp knee-jerk reaction to the downside. On the other hand, if the numbers indicate a slowdown in inflation, risky assets may witness a rally.
The Federal Reserve meeting will finish on December 14 and the majority expect the central bank to hike rates by 50 basis points, according to the FedWatchTool.
Both events are likely to boost the crypto volatility in the near term but it is difficult to predict the direction of the breakout. While several analysts expect Bitcoin to continue its decline and reach $10,000, Arthur Hayes, the former CEO of crypto derivatives platform BitMEX, thinks otherwise.
In an interview with podcaster Scott Melker, Hayes said that the “largest most irresponsible entities” do not have any Bitcoin on their balance sheet because they have already dumped them. He added that “pretty much everyone who could go bankrupt has gone bankrupt.” Hence, he thinks that Bitcoin may have made its low for this cycle and could be getting ready for a rally in 2023.
Hayes is not alone in calling a bottom in Bitcoin. Market intelligence firm Blockware Solutions said in its 2023 Market Forecast report that the “lowest point of the bear market is in” for Bitcoin.
While many are bullish on the long-term prospects of Bitcoin, Goldman Sachs said in a December 13 research note viewed by Reuters that gold was a “useful portfolio diversifier” and the yellow metal could outperform Bitcoin in the long term. What are the important levels that could signal a potential trend change in Bitcoin and the major altcoins? Let’s look at the charts to find out.
BTC/USD Market Analysis
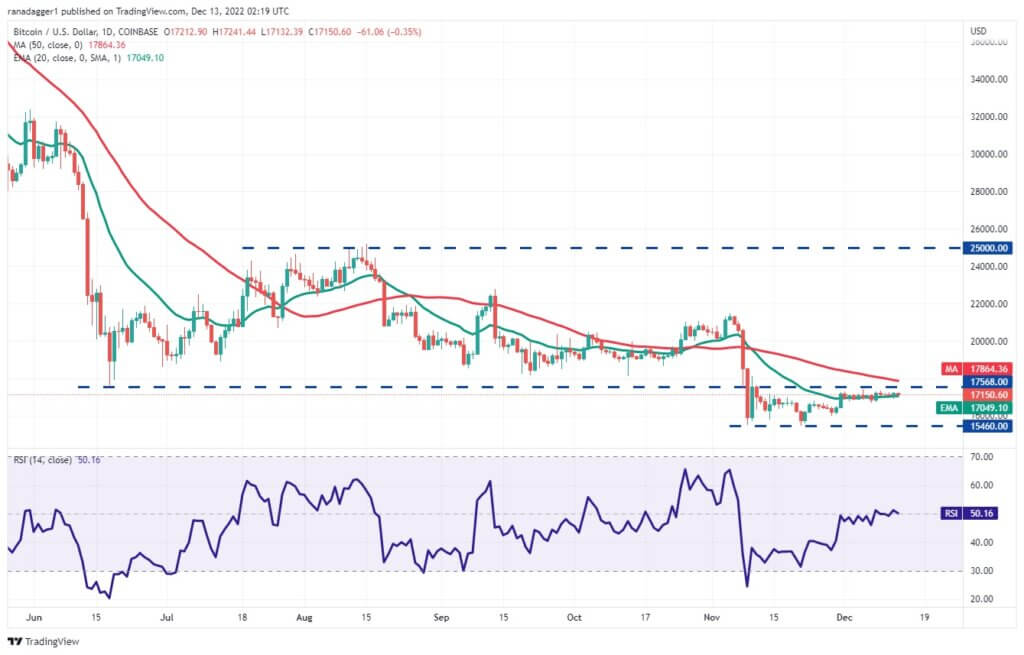
We said in our previous analysis that the flat 20-day exponential moving average (EMA) and the relative strength index (RSI) near the midpoint hinted at a range-bound action in the near term and that is what happened.
Bitcoin continues to oscillate near the 20-day EMA, indicating indecision between the bulls and the bears. However, this phase of uncertainty is unlikely to continue for long.
The volatility could soon pick up and the BTC/USD pair may start a trending move.
If buyers thrust the price above the overhead resistance at $17,568, the pair could pick up momentum and soar toward the psychological level of $20,000. This level could act as a hindrance but on the way down, if bulls flip the $17,568 level into support, the likelihood of a rally to $21,500 increases. Contrary to this assumption, if the price turns down and plummets below $16,679, it will suggest that the bulls have given up and are closing their positions. That could pull the price to $15,992. Such a move could indicate that the pair may stay within the $15,460 to $17,568 range for some more time.
ETH/USD Market Analysis
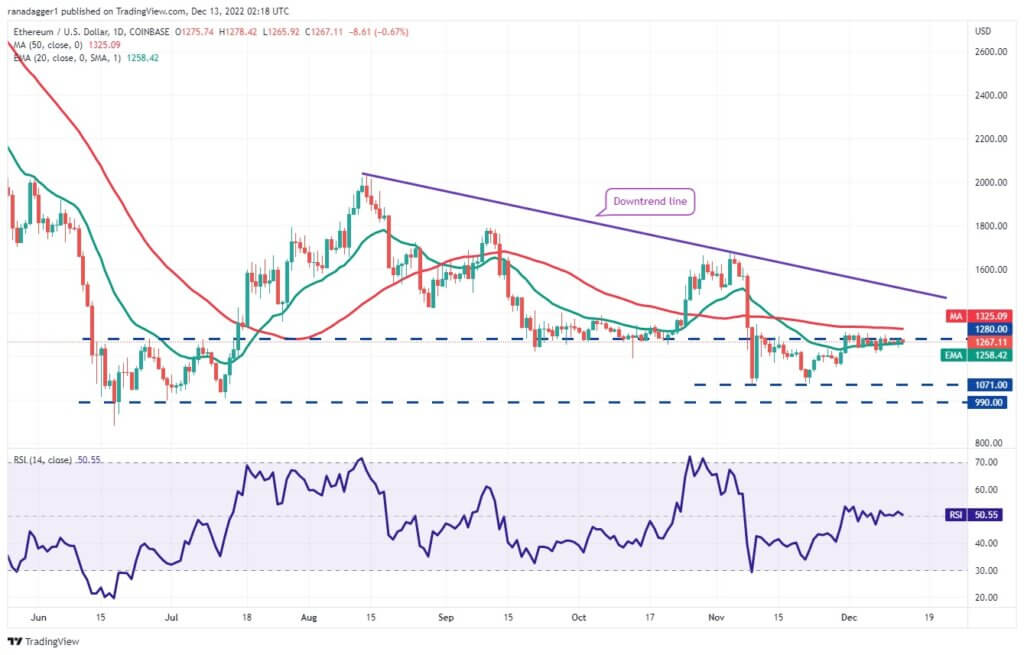
Ether broke below the 20-day EMA on December 7 but the bears could not sustain the lower levels. The bulls bought the dip and pushed the price back above the 20-day EMA on December 8.
Both moving averages have flattened out and the RSI is near the midpoint, indicating a balance between supply and demand.
The advantage could shift in favor of the bulls if they thrust the price above the 50-day SMA. The ETH/USD pair could then rise to the downtrend line. This remains an important level for the bears to defend because a break above it will signal a potential trend change. On the downside, if bears sink the price below $1,215, the selling could pick up speed and the pair may slump to $1,150. This level could act as a strong support but if bears pull the price below it, the decline could extend to $1,071.
BNB/USD Market Analysis
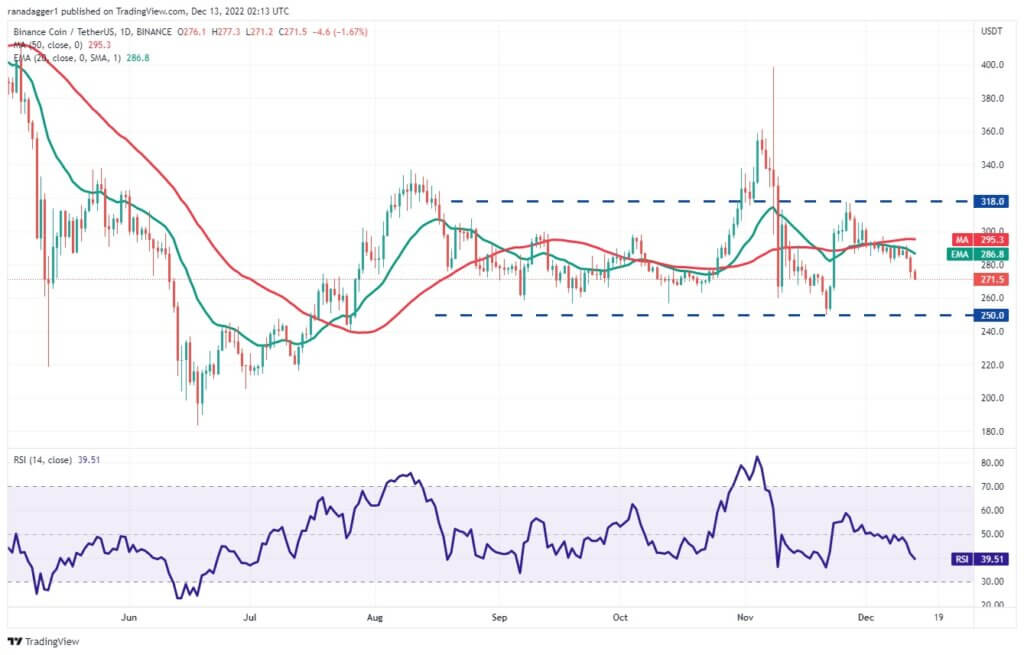
We projected in last week’s analysis that if Binance Coin broke below $285, it could plummet to $275 and that is what happened.
This fall has pulled the RSI into negative territory and the 20-day EMA has also started to turn down. This indicates that the bears have the upper hand in the near term.
The BNB/USD pair could now decline to the strong support at $250. The bulls are expected to defend this level with all their might because if this support cracks, the pair could start a downward move to $216. If bulls want to invalidate this bearish view, they will have to quickly push the price back above the 50-day SMA. That could open the doors for a possible rally to the overhead resistance at $318. A break and close above this level could tilt the odds in favor of the buyers. The pair could then rally to $360.
XRP/USD Market Analysis
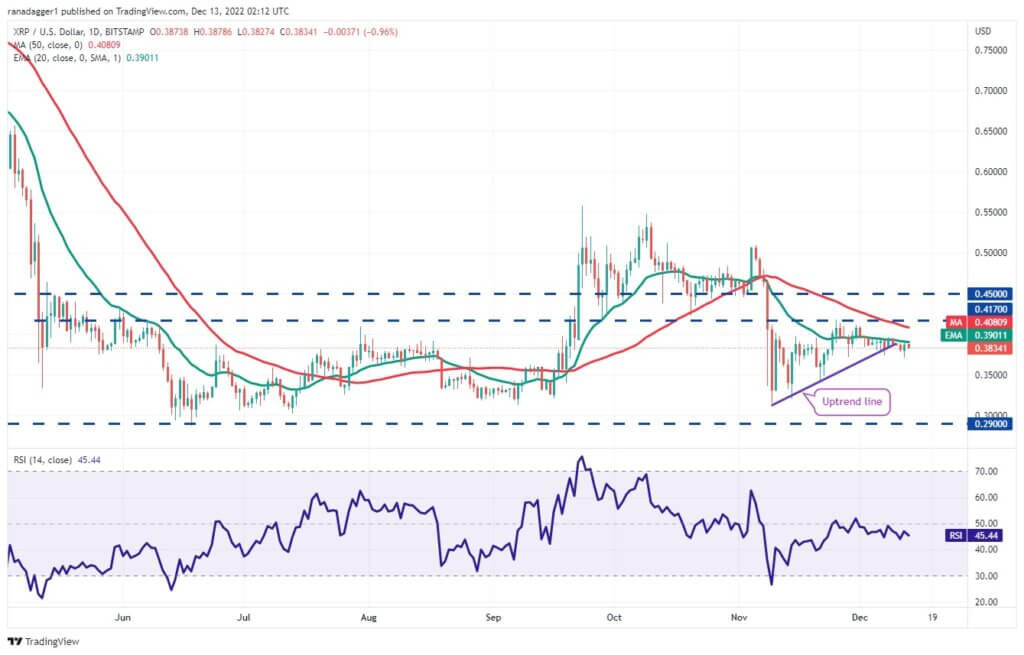
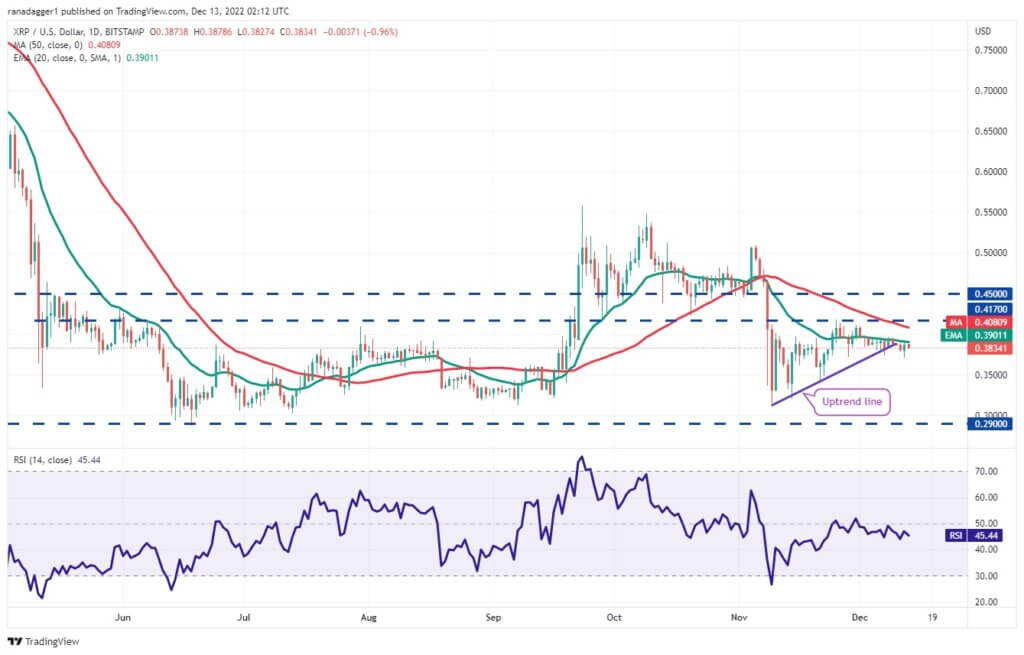
XRP bounced off the uptrend line on December 8 but the bulls could not propel the price above the 20-day EMA. This suggests that the sentiment remains negative and traders are selling on rallies.
The XRP/USD pair broke below the uptrend line on December 11 and slipped to $0.37 on December 12. The long tail on the candlestick suggests that bulls are guarding the $0.37 level with vigor.
Buyers will once again try to push the price above the 20-day EMA. If they succeed, the pair could attempt a rally to $0.41. If this resistance is also scaled, the rally could reach $0.45. On the contrary, if the price turns down and breaks below $0.37, it will suggest that the bears are gaining control. The pair could then decline to $0.34.
ADA/USD Market Analysis
In a downtrend, bears generally sell on rallies to the 20-day EMA and that is what happened in Cardano. The sellers did not allow the bulls to push the price above the 20-day EMA.
This attracted further selling and pulled the ADA/USD pair near the crucial support of $0.29 on December 12. The bulls are trying to defend the level as seen from the long wick on the day’s candlestick.
The first sign of strength will be a break and close above the 20-day EMA. That could push the pair to $0.33. If this barrier is overcome, the pair could accelerate and reach the downtrend line of the descending channel pattern. Contrarily, if the price turns down and plunges below $0.29, it will signal the start of the next leg of the downtrend. The pair could first decline to $0.27 and then to $0.25.
Hopefully, you have enjoyed today’s article for further coverage please check out our crypto Blog Page. Thanks for reading! Have a fantastic day! Live from the Platinum Crypto Trading Floor.
Earnings Disclaimer: The information you’ll find in this article is for educational purpose only. We make no promise or guarantee of income or earnings. You have to do some work, use your best judgement and perform due diligence before using the information in this article. Your success is still up to you. Nothing in this article is intended to be professional, legal, financial and/or accounting advice. Always seek competent advice from professionals in these matters. If you break the city or other local laws, we will not be held liable for any damages you incur.


