
Bloomberg Intelligence senior commodity strategist Mike McGlone recently said that investors could remain risk-averse in 2022 due to inflation and war. But he believes that Bitcoin will emerge more mature from this and will continue to outperform gold albeit with “bumps in the road as the Fed attempts another rate-hike cycle.”
One sign of accumulation by the bulls is that Bitcoin’s ratio of supply with the exchanges has continued to plummet and is at its lowest level since December 2018, according to data from Santiment. The trend has continued in 2022 with Bitcoin on exchange wallets dropping 13.5% in two months.
Institutional interest is also showing signs of a pick up in the crypto space. Coindesk said its sources revealed that Bridgewater Associates, the world’s largest hedge fund, is planning to invest in a crypto fund. However, the crypto investment, when compared to Bridgewater’s assets under management, is very small.
Goldman Sachs took a major step into the crypto space with a non-deliverable option trade with crypto merchant bank Galaxy Digital. With this, Goldman became the first major US bank to complete an over-the-counter crypto trade. This move is likely to draw other major banks into expanding their crypto offerings to their clients.
Galaxy Digital CEO Mike Novogratz said in a recent interview with Bloomberg that Bitcoin is unlikely to rally in the current environment, with the Fed tightening and the war in Ukraine. However, Novogratz remains bullish in the long term. He said that Bitcoin should reach $500,000 in five years, else his theory of the Bitcoin adoption cycle would prove to be wrong.
However, there was a word of caution from Ethereum co-founder Vitalik Buterin who said to TIME that cryptocurrencies are unpredictable and volatile compared to legacy investments. Therefore, investors should limit their crypto investments to 5% of their portfolio.
Could Bitcoin break out of its overhead resistance and pull the altcoins higher? What do the charts project? Read the analysis of the major cryptocurrencies to find out.
BTC/USD Market Analysis
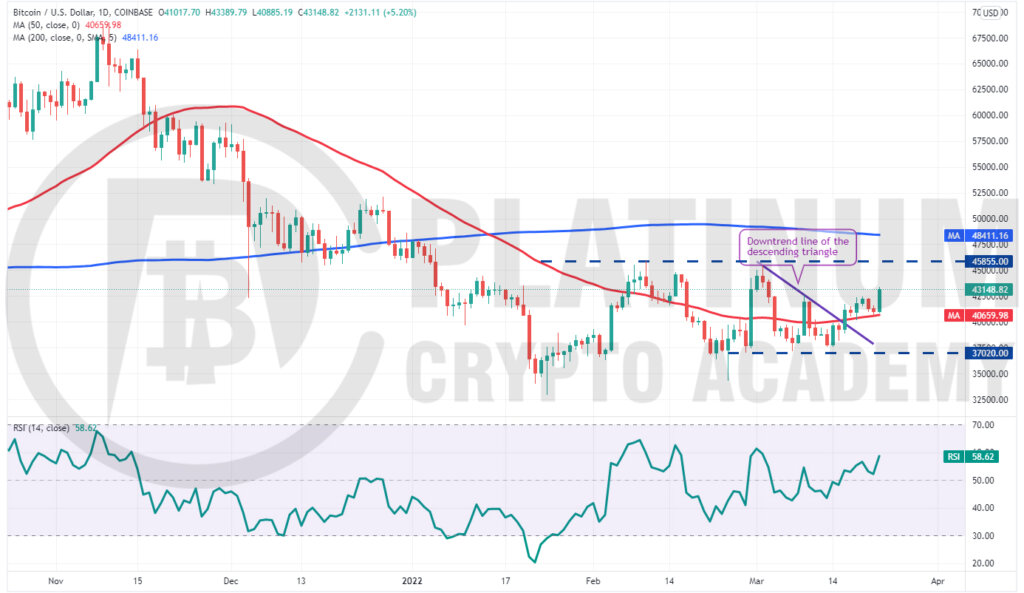
We said in our previous analysis that traders may turn positive on a break above the 50-day simple moving average (SMA) and that proved to be the right strategy to adopt. Bitcoin broke and closed above the downtrend line of the descending triangle on March 16, which invalidated the bearish setup.
Although the bears tried to pull the price back below the 50-day SMA, the bulls held their ground, indicating buying on dips. The relative strength index (RSI) has jumped into the positive territory, suggesting that bulls have the upper hand.
Strong buying today has pushed the price above the minor resistance at $42,600. If bulls sustain the price above this level, the BTC/USD pair could rally to $45,855. This level is again likely to act as a stiff resistance.
If the price turns down from this resistance, the bears will attempt to pull the pair to the 50-day SMA and extend the stay inside the range for a few more days. Conversely, a rally above $45,855 could propel the pair to the 200-day SMA.
The bullish view will invalidate in the short term if the price turns down and breaks below the 50-day SMA.
ETH/USD Market Analysis
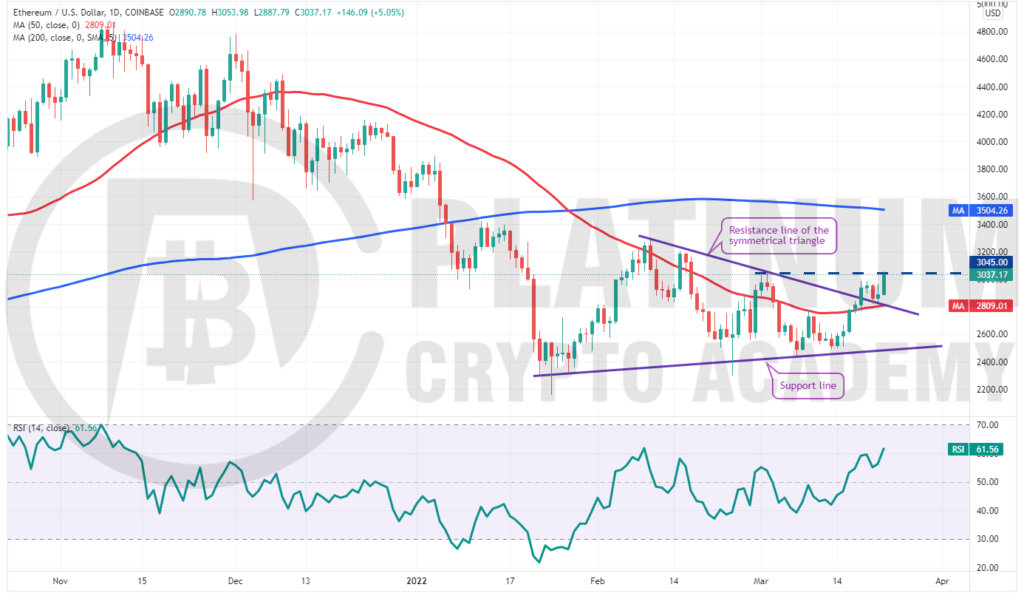
We suggested in our previous analysis that traders could turn positive on a break above the 50-day SMA and that has proven to be the right thing to do.
Ether broke and closed above the resistance line of the symmetrical triangle on March 18. The bears tried to pull the price back into the triangle on March 20 and 21 but the bulls held their ground.
The 50-day SMA has started to turn up and the RSI is in the positive zone, indicating that the path of least resistance is to the upside. There is a minor resistance at $3,045 but if bulls clear this hurdle, the ETH/USD pair could rally toward the 200-day SMA.
This bullish view will be negated if the price turns down from the overhead resistance and breaks below the 50-day SMA. That could pull the price down to the support line.
BNB/USD Market Analysis
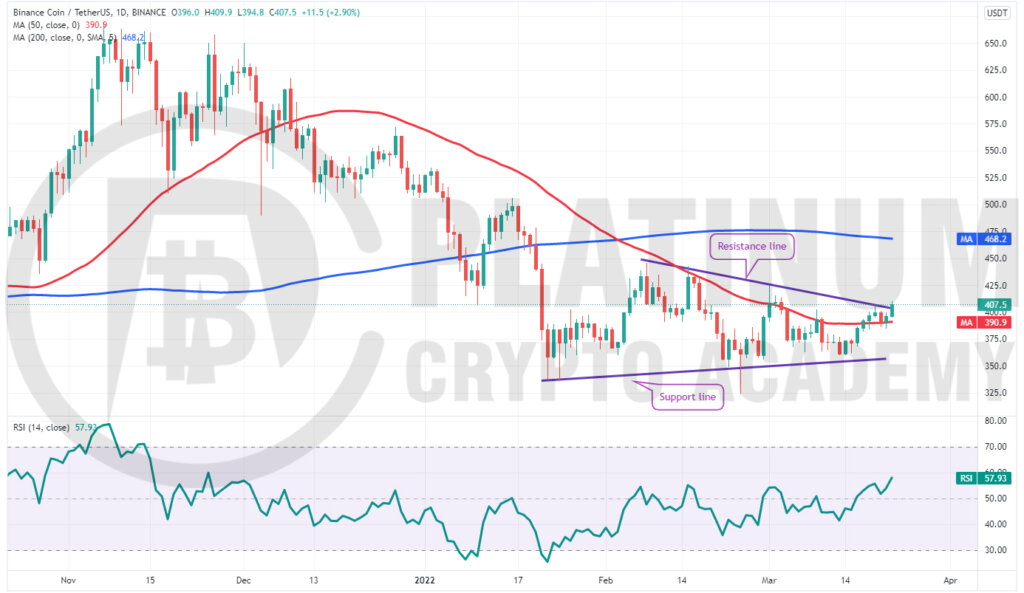
Binance Coin rebounded off the support line of the symmetrical triangle on March 14, indicating strong buying at lower levels. This started a relief rally and the buyers pushed the price above the 50-day SMA on March 17.
The bears posed a strong challenge at the resistance line of the triangle on March 19 but a positive sign is that the bulls did not allow the price to sustain below the 50-day SMA.
The price rebounded off the 50-day SMA and the bulls are attempting to sustain the BNB/USD pair above the resistance line. If they succeed, it will suggest a possible change in trend.
The pair could then start a rally toward $450. Traders may wait for the price to close above the triangle to turn positive.
This bullish view will invalidate in the near term if the price turns down and breaks below $380. Such a move will suggest that the break above the triangle may have been a bull trap. The pair could then slide to the support line of the triangle.
XRP/USD Market Analysis
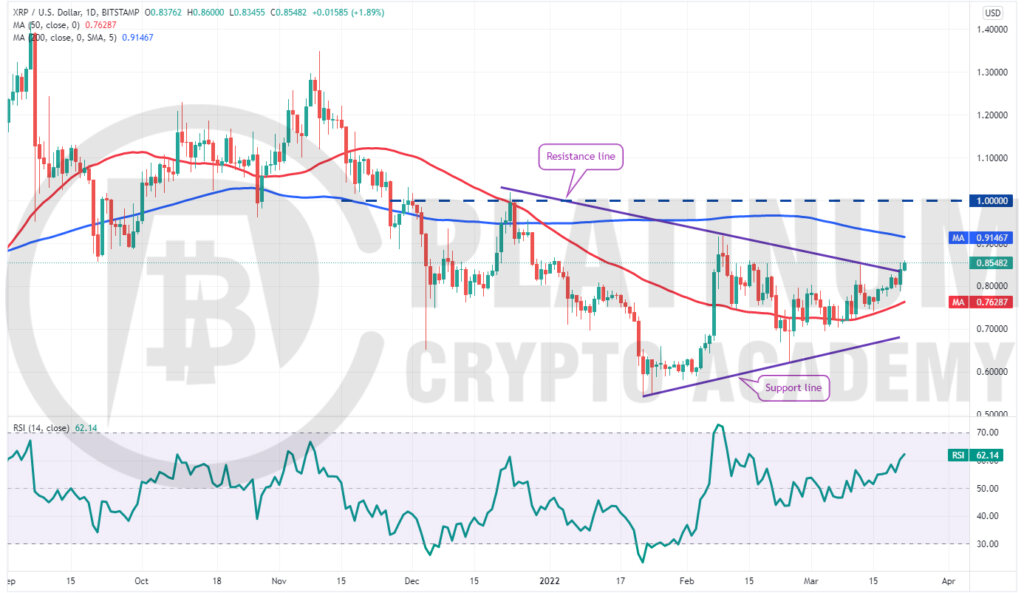
XRP rebounded off the 50-day SMA on March 15 and reached the resistance line of the triangle on March 21. There was a minor resistance offered by the bears at this level but the bulls did not give up much ground.
The rising 50-day SMA and the RSI in the positive territory indicate that bulls have the upper hand. If buyers sustain the price above the resistance line, it will signal a possible change in trend.
The XRP/USD pair could then rally to the 200-day SMA where the bears may again pose a challenge. But if bulls push the price above this resistance, the pair could rally to the psychological level of $1.
The bears will have to sink and sustain the price below the 50-day SMA to signal that they are back in the driver’s seat.
LUNA/USD Market Analysis
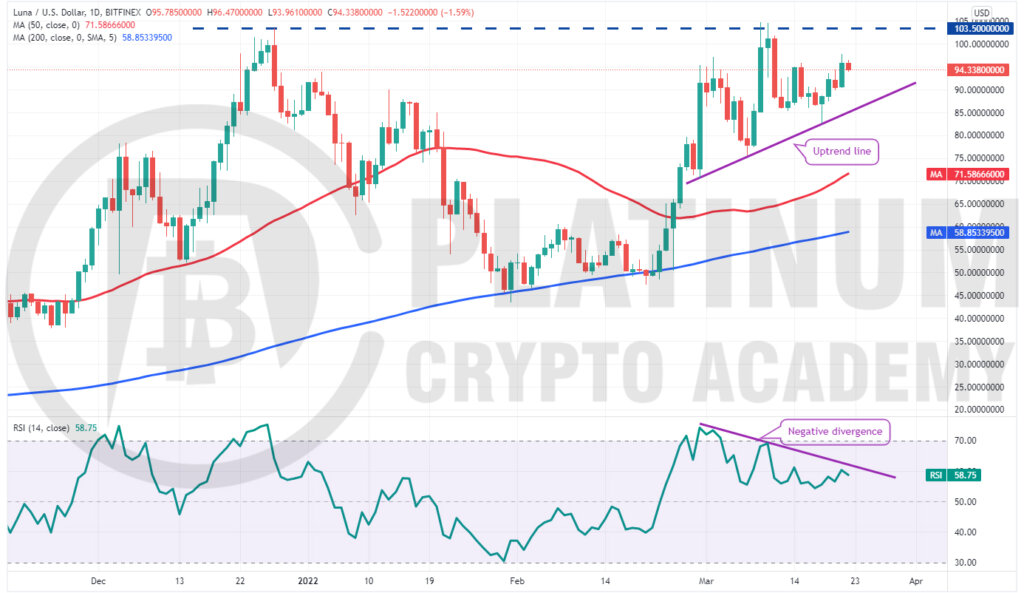
Terra’s LUNA token is in an uptrend. The bulls pushed the price above the all-time high of $103.50 on March 9 and 10 but could not sustain the higher levels. This may have led to profit-booking by the short-term traders.
However, a positive sign is that bulls continue to buy on dips. The LUNA/USD pair rebounded off the uptrend line on March 18 and the buyers are again trying to push the price to the all-time high.
A break and close above the all-time high will signal the resumption of the uptrend. The pair could then rally to $118.
However, the bears are unlikely to give up easily. The negative divergence on the RSI indicates that the bullish momentum may be weakening. A break and close below the uptrend line could pull the price down to $75.65.
Hopefully, you have enjoyed today’s article for further coverage please check out our crypto Blog Page. Thanks for reading! Have a fantastic day! Live from the Platinum Crypto Trading Floor.
Earnings Disclaimer: The information you’ll find in this article is for educational purpose only. We make no promise or guarantee of income or earnings. You have to do some work, use your best judgement and perform due diligence before using the information in this article. Your success is still up to you. Nothing in this article is intended to be professional, legal, financial and/or accounting advice. Always seek competent advice from professionals in these matters. If you break the city or other local laws, we will not be held liable for any damages you incur.
")