
As the Bitcoin price chart rises, the block reward becomes increasingly more attractive for miners/traders/investors. Today’s price charts highlight Key Trading levels on the Bitcoin price chart as well as other major cryptocurrencies.
CRYPTO MARKET ANALYSIS
The European Union leaders committed to a $2 trillion deal last week to support the European economy. The US is meanwhile discussing a second round of stimulus measures to provide relief to the people who are facing hardships due to the coronavirus pandemic led crisis.
Several central banks around the world have printed huge sums of money, which dwarfs the stimulus measures announced during the previous financial crisis in 2007-2008. While the stimulus measures support the economy in the short-term, they can weaken the purchasing power of the fiat currencies if the measures are not withdrawn at the appropriate time. This has led to strong buying into safe haven assets, propelling gold to a new lifetime high.
BITCOIN – DIGITAL GOLD
Cryptocurrency enthusiasts have long projected Bitcoin as digital gold but the lack of buying in the past few months led some naysayers to question this assumption. Interestingly, gold has rallied 26% in 2020 while Bitcoin has rallied 52% during the same period. This shows that Bitcoin even while not performing at its best beats gold hands down.
In the past few days, while Bitcoin had been stuck in a range, the altcoins had been rallying. Although Bitcoin’s dominance is less than 63%, the total market capitalization of the crypto universe has risen to $320 billion. If cryptocurrencies sustain the momentum, several investors are likely to jump in, which could result in a strong bull move for the rest of the year.
BITCOIN PRICE CHART – HOW TO TRADE BITCOIN
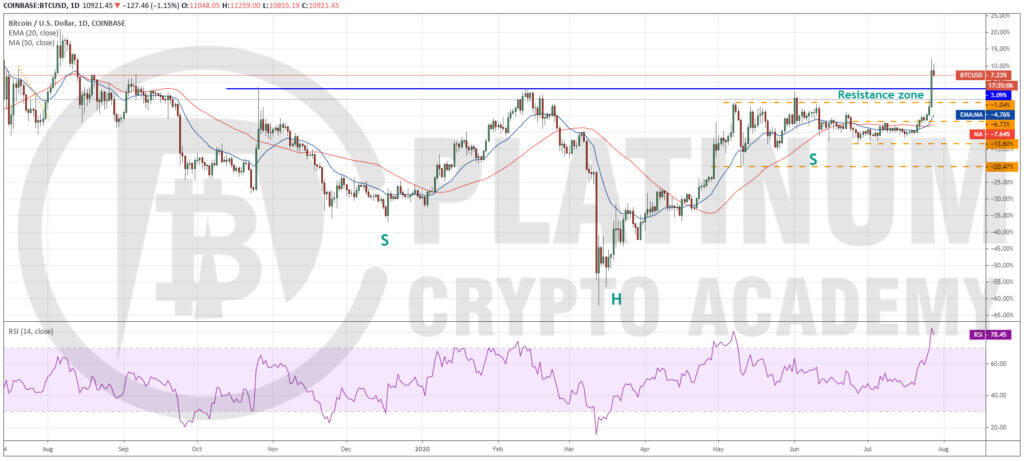
In our previous analysis, we had advised traders to enter long positions if Bitcoin sustains above $9,500 for a day. Traders who entered according to our recommendation are sitting on huge profits within a week.
The Bitcoin price chart hightlights the pair surging on July 27 breaking the above the overhead resistance at $10,500. This move completed an inverse head and shoulders pattern, which has a target objective of $17,142.
However, this target is unlikely to be reached quickly as we do not anticipate a vertical rally. The bears are likely to mount a stiff resistance at $12,000 and then again at $13,000.
Usually, after a breakout from a bullish setup, the Bitcoin price chart often pulls back and retests the breakout level. In this case, a retest of $10,500 is possible. A bounce off this level will confirm that the breakout is valid and it will now act as a strong floor, preventing the price to dip below it.
The retest also provides an opportunity to the traders who missed buying the breakout to make an entry. The purchases should be done on a rebound and not on the way down because, at times, the selling pressure can sink the price well below the breakout level.
Very short-term traders can keep a stop-loss according to their trading system and trail it higher. Swing traders and positional traders can hold their positions as the leading cryptocurrency is likely to rise much higher this year.
ETHEREUM PRICE ANALYSIS
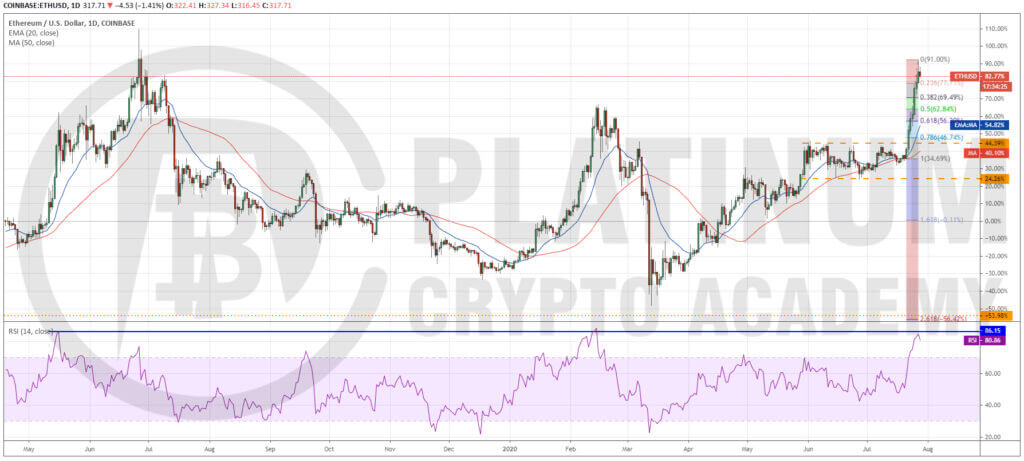
We had advised traders to buy on a breakout above $251. Again, traders who bought on our recommendation would be sitting on huge profits as Ether soared to a high of $334.34 on July 27.
The sharp rally of the past few days has pushed the RSI deep into the overbought territory, which suggests that the markets are overheated in the short-term. Previously too, levels above 86 in the RSI have resulted in a correction.
The first support on the downside is at 38.2% Fibonacci retracement level of $296.69. If the ETH to USD pair rebounds off this level, it will indicate that the bulls are not waiting for a deeper correction, which is a positive sign.
This is likely to resume the uptrend with the next target at $364.49. If the momentum can push the price above this resistance, the rally can extend to $480. This bullish assumption will be invalidated if the bears sink the pair below the 61.8% retracement level of $273.42.
The short-term traders can book profits or trail the stops higher according to their trading principle. Positional traders can also book partial profits at the current levels and protect the rest with a suitable stop-loss.
HOW TO TRADE – XRP PRICE ANALYSIS
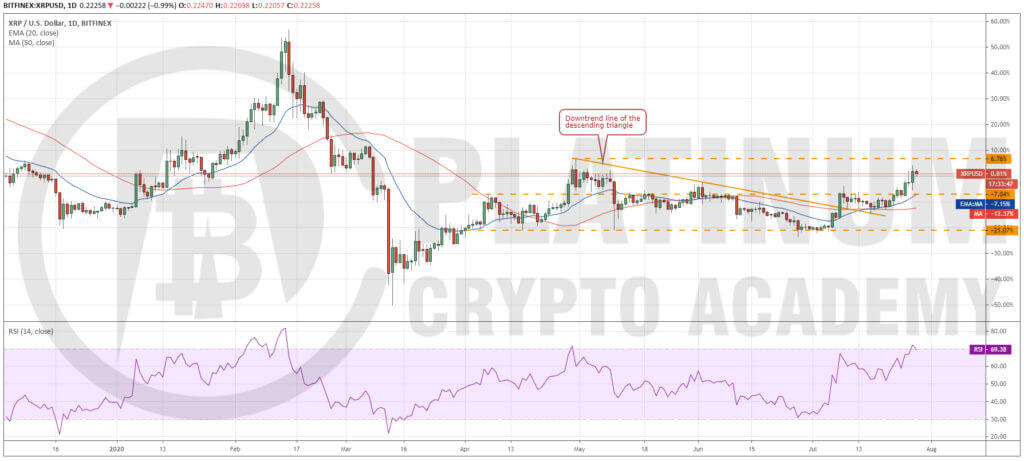
XRP broke above the overhead resistance of $0.20524 on July 23 and after a little hesitation on July 24, the up move resumed.
The immediate level to watch out for is $0.23571. If the bulls can scale the price above this level, a rally to $0.285 is likely. Therefore, traders who are long from our earlier recommendation can watch the $0.23571 level closely.
If the bulls fail to propel the price above $0.23571, the XRP to USD pair could remain range-bound between $0.20524 and $0.23571 for a few days. Hence, traders can book profits and buy again at lower levels if a bullish setup forms. Long-term investors can however hold their positions as higher levels are likely.
This assumption will be negated if the pair turns down from the current levels or $0.23571 and plummets below $0.20524. Such a move can drag the price back to $0.17426.
HOW TO TRADE – BITCOIN CASH PRICE CHART
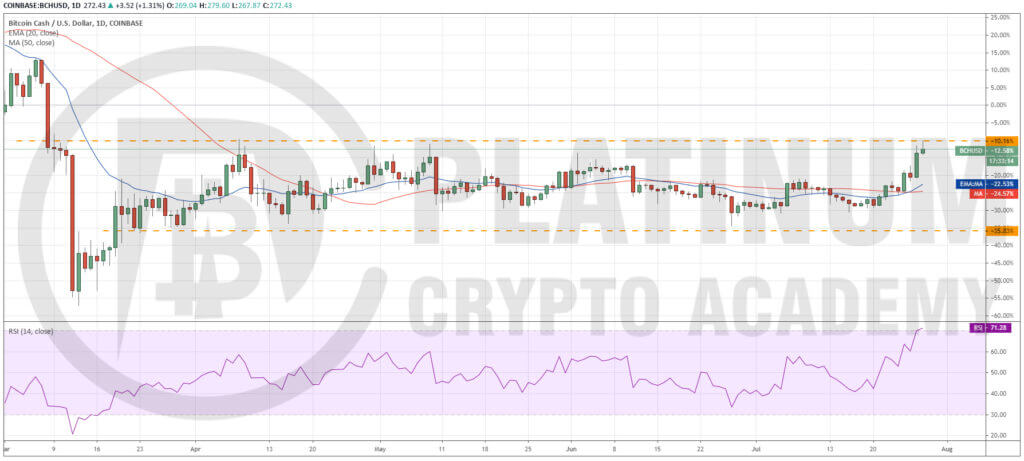
Bitcoin Cash has also participated in the rally that has pushed the price to the top of the $280-$200 range for the first time since early-May. This suggests that the bulls have been buying at every higher level in the past week.
The BCH to USD pair has been in the range for over four months. If the bulls can propel the price above the range, it is likely to result in a new uptrend. If the price sustains above $280, the next target objective is $360.
Therefore, traders can initiate long positions on a breakout and close (UTC time) above $280. However, as the pair has been a huge underperformer in the past few months, traders can keep a smaller position size, about half of usual.
If the price turns down sharply from the current levels, it will suggest that the bears are aggressively defending the resistance of the range. This can keep the pair range-bound for a few more days.
HOW TO TRADE – BITCOIN SV PRICE CHART
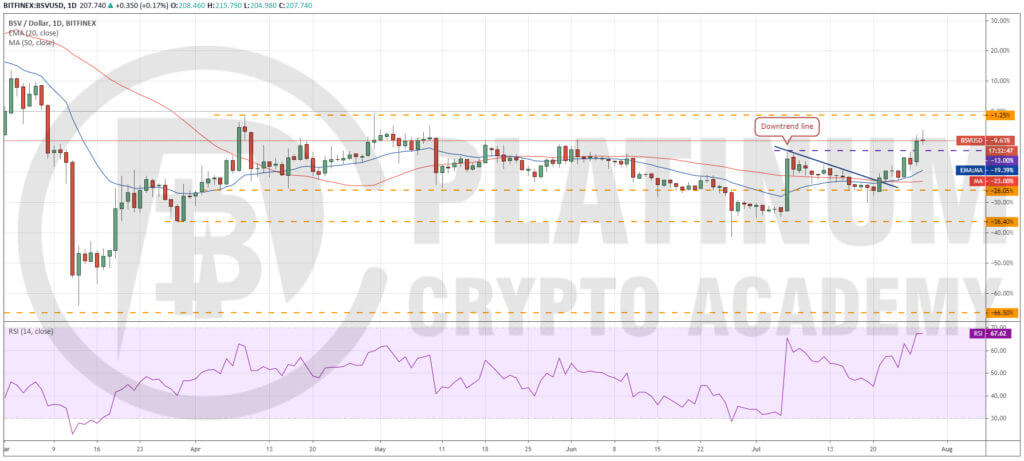
Bitcoin SV broke above the downtrend line on July 21. Thereafter, it took support on the 20-day EMA on July 24, which is a positive sign. The bulls finally managed to scale the price above $200 on July 27.
The next target to watch on the upside is $227. If the bulls can push the price above this resistance, the BSV to USD pair is likely to start a new uptrend. Above this level, a quick rally to $260 and then to $300 is possible.
The 20-day EMA has started to slope up and the RSI has risen close to the overbought levels, which suggests that bulls are making a comeback. Traders can initiate long positions on a close (UTC time) above $227, but as the altcoin has been a huge underperformer in the past few months, the position size can be half of usual.
Contrary to this assumption, if the pair turns down form $227, it can consolidate between $200-$227 for a few days.
Hopefully, you have enjoyed today’s article. Thanks for reading! Have a fantastic day! Live from the Platinum Crypto Trading Floor.
Earnings Disclaimer: The information you’ll find in this article is for educational purpose only. We make no promise or guarantee of income or earnings. You have to do some work, use your best judgement and perform due diligence before using the information in this article. Your success is still up to you. Nothing in this article is intended to be professional, legal, financial and/or accounting advice. Always seek competent advice from professionals in these matters. If you break the city or other local laws, we will not be held liable for any damages you incur.
