
Hi Crypto Network,
Bitcoin’s volatility has dropped to its lowest levels since May 10 of this year, according to Blockforce Capital. This shows that the market participants are not taking any large bets before the launch of Bakkt on September 23.
After the launch, we believe that Bitcoin will take a decisive direction that will provide a profitable trading opportunity.
Nigel Green, the founder of $10 billion wealth advisor deVere, believes that Bitcoin will rise to new yearly highs after the US Federal Reserve cuts rates and maintains its dovish stance. The two other geopolitical factors that can be bullish for Bitcoin are the trade war between the US and China and Brexit.
While Bitcoin’s performance as a safe haven has been the focal point this year, co-founder of Fundstrat Global Advisors Tom Lee said that historically, Bitcoin has performed well when the S&P 500 has been strong. Therefore, he is looking at a new high in the S&P 500 to pull Bitcoin higher.
VC billionaire Tim Draper has a target of $250,000 on Bitcoin by 2022. While many believe this target to be outlandish, Draper said that at $250,000, Bitcoin would have “about a 5% market share of the currency world and I think that maybe understating the power of Bitcoin.”
BTC/USD
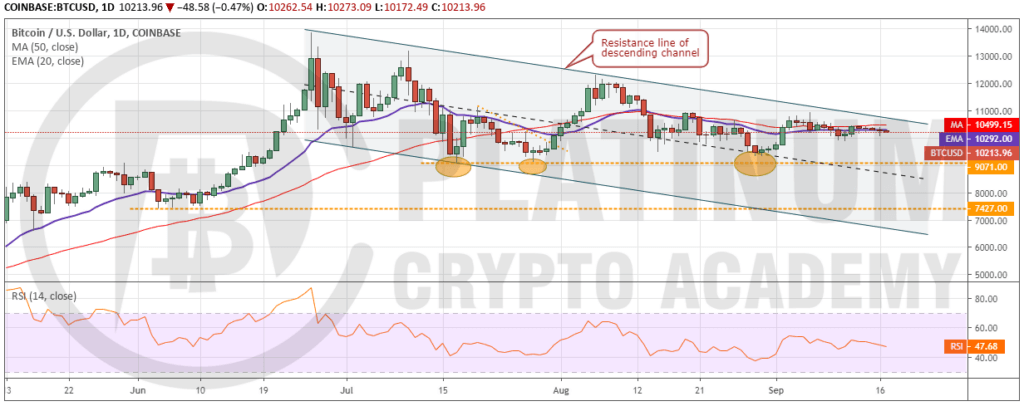
Bitcoin has been stuck in a tight range for the past few days. This period of low volatility is unlikely to continue for long. We anticipate a volatility expansion in the next few days, which will result in a trending move.
If bulls can propel the price above the descending channel, we expect the buyers waiting on the sidelines to jump in. Though there is a minor resistance at $12,320.4 and above it at $13,202.63, we expect both to be crossed. The rally might face some profit booking close to the yearly high of $13,868.44 but once this is scaled, a quick move to $17,178 will be on the cards. Therefore, traders can buy on a breakout above $11,000 with a stop loss of $9,000.
Our bullish view will be invalidated if the price turns down from current levels and plummets below the critical support of $9,071. In such a case, a drop to $7,427 is possible.
ETH/USD
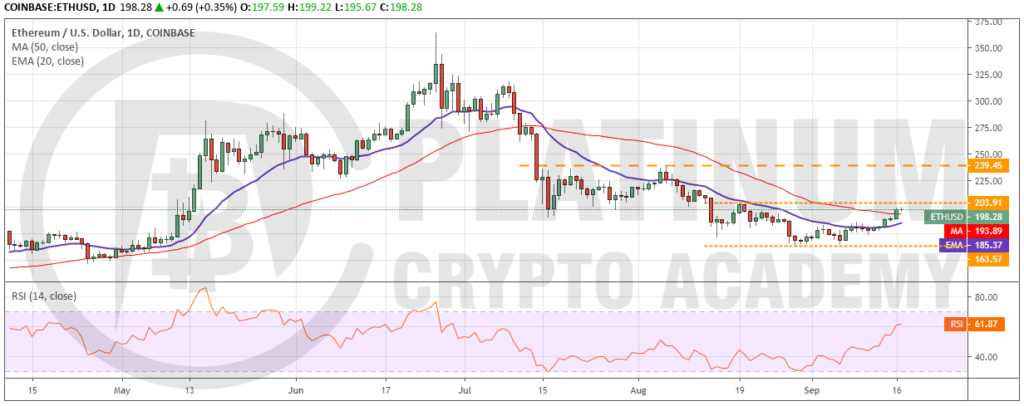
Ether is looking strong. It has scaled above both moving averages, which shows that the downtrend has ended. The pullback might face resistance at $203.91, above which a move to $239.45 is likely. If this level is also ascended, the cryptocurrency will pick up momentum and rally to $318.6. The 20-day EMA is gradually turning up and the RSI has jumped into the positive territory, which shows that bulls have the upper hand in the short-term.
Conversely, if the bulls fail to push the price above $203.91, the digital currency might remain range-bound between $203.91-$163.57 for a few days. The trend will turn negative on a breakdown of $163.57 but we give it a low probability of occurring.
As the trend is changing, we recommend a long position on a breakout and close (UTC time) above $203.91 with a stop loss of $163. This is an aggressive trade, hence, keep the position size about 50% of usual.
XRP/USD
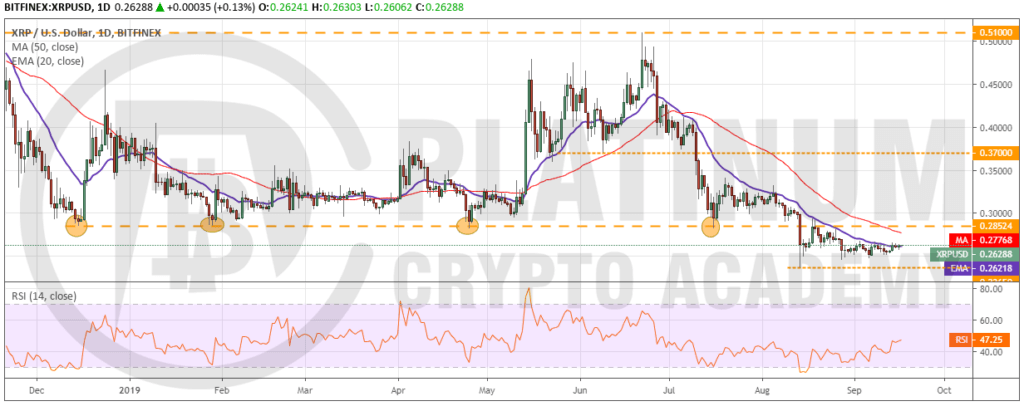
XRP has been trading close to the 20-day EMA for the past three days. The 20-day EMA has flattened out and the RSI is just below the midpoint, which points to a balance between buyers and sellers. A breakout of the 20-day EMA can carry the price to the previous support turned resistance of $0.28524.
If the price turns down from $0.28524, the cryptocurrency will remain range-bound between $0.2365-$0.28524 for a few days. Conversely, a breakout of $0.28524 will signal that the downtrend is over. Therefore, traders can initiate a long position as suggested in our previous analysis.
The trend will turn negative if bears sink the cryptocurrency below the yearly low of $0.2365. If this level breaks down, the next support is way lower at $0.18.
BCH/USD
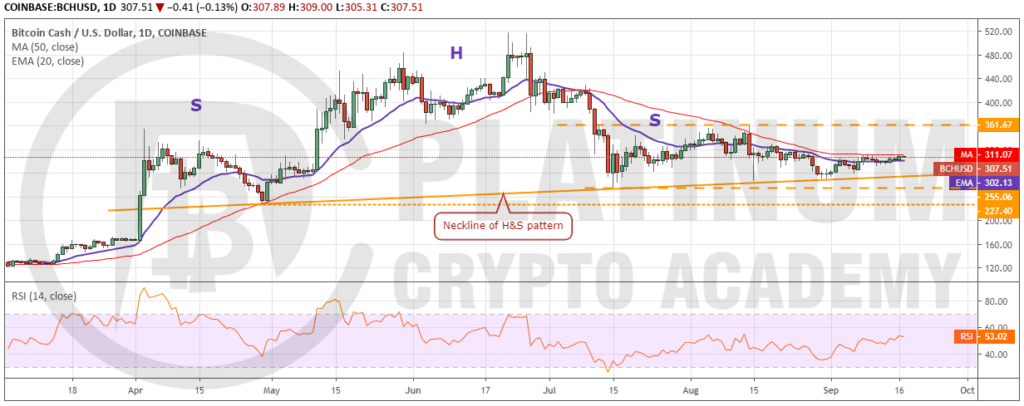
Bitcoin Cash has been trading between 20-day EMA and 50-day SMA for the past nine days. Both moving averages have flattened out and the RSI is just above the 50 levels, which shows a balance between both buyers and sellers.
A breakout above the 50-day SMA can carry the price to $361.67, which is likely to act as a stiff resistance. If the price turns down from this level, it will remain range-bound for a few more days. However, if bulls push the price above $361.67, we expect a move to $432.94 and above it to $517.75. We will suggest a trade if the momentum picks up after breaking out of $361.67.
On the other hand, if the price breaks down of the 20-day EMA, a drop to the neckline of the head and shoulders pattern is likely. A breakdown of the neckline will complete the bearish setup, which can drag the price to $166.98 and below it to $105.
LTC/USD
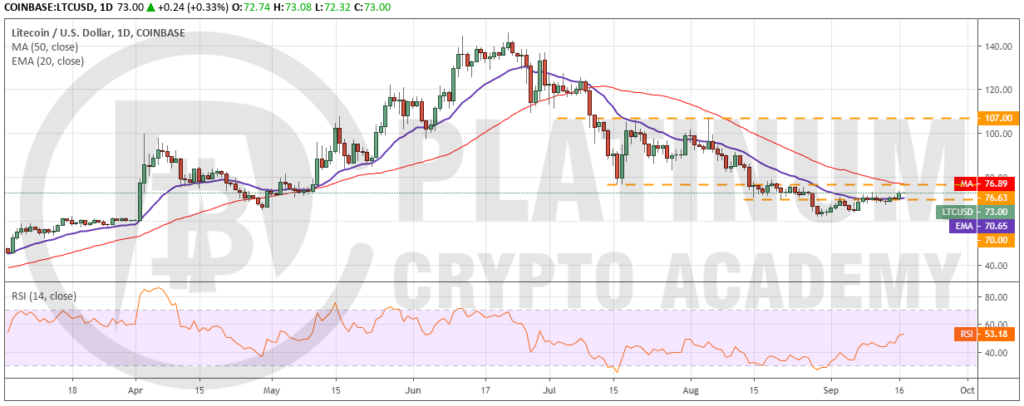
Litecoin has broken above the 20-day EMA, which is a positive sign. The 20-day EMA has flattened out and the RSI has risen to just above the midpoint, which suggests a consolidation in the short-term.
The next level to watch on the upside is 50-day SMA. If bulls can push the price above it, a move to $107 is possible. Therefore, we retain the buy recommendation given in our previous analysis.
But if the price turns down from the 50-day SMA, it might remain range-bound for a few days. The downtrend will resume if the bears sink the price below the recent lows of $62.05. If this level cracks, the next support is way lower at $52.
Hopefully, you have enjoyed today’s article. Thanks for reading!
Have a fantastic day!
Live from the Platinum Crypto Trading Floor.
Earnings Disclaimer: The information you’ll find in this article is for educational purpose only. We make no promise or guarantee of income or earnings. You have to do some work, use your best judgement and perform due diligence before using the information in this article. Your success is still up to you. Nothing in this article is intended to be professional, legal, financial and/or accounting advice. Always seek competent advice from professionals in these matters. If you break the city or other local laws, we will not be held liable for any damages you incur.
")