
Bear markets are gruesome and they test the conviction of even the most ardent long-term investors. That is what happened in 2022 as Bitcoin fell 65% and Ethereum, which pulled off the Merge, a shift from proof-of-work to proof-of-stake, without any major glitch, fell by 67%. Dubbed as the Ethereum killer, Solana, plunged more than 94% in the past year. This shows the kind of carnage that crypto investors had to weather.
One of the major reasons for the bear market was the aggressive monetary tightening by the United States Federal Reserve. The central bank went into damage control mode as inflation in the US skyrocketed to a 40-year high of 9.1% in June 2022. The Fed announced seven rate hikes in 2022 which took the benchmark rate from the 0% to 0.25% range at the start of last year to 4.25% to 4.5% by December.
In addition to the rate hikes, the crypto markets were also struck with a slew of bankruptcies in the crypto space. The meltdowns started with the collapse of cryptocurrencies Luna and TerraUSD in May of last year and the contagion continued to spread, engulfing several hedge funds and crypto firms, with the biggest being FTX.
However, things could change for the better in 2023. Market observers are closely watching for inflation to show signs of cooling off. If that occurs, it will indicate that the Fed’s rate hikes are having the desired effect. That could encourage the central bank to slow down its rate hikes. An expansionary monetary policy may encourage investors to take on more risk and that could benefit cryptocurrencies.
In the near term, the recovery in cryptocurrencies could be hampered due to the financial woes being faced by the Digital Currency Group, the parent of the troubled brokerage Genesis Global Capital and the popular Grayscale trusts. If DCG collapses, it could further dent sentiment and delay the crypto recovery.
How should investors be positioned at the start of the new year? Is there a recovery in sight? Let’s look at the charts to find out.
BTC/USD Market Analysis
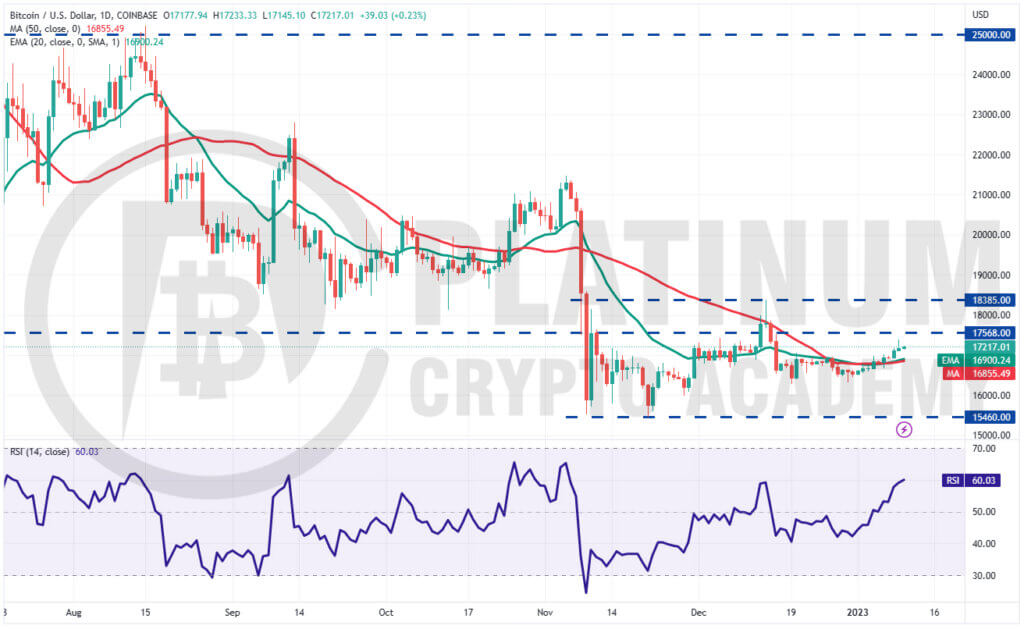
We mentioned in our previous analysis that if buyers drive the price above the moving averages, Bitcoin could reach $17,568 and that is how it played out.
The BTC/USD pair rose to $17,396 on January 9, which attracted selling by the bears as seen from the long wick on the day’s candlestick.
The 20-day exponential moving average (EMA) has started to turn up and the relative strength index (RSI) has jumped into the positive territory, indicating that buyers have a slight edge.
If the price turns down from the current level but rebounds off the moving averages, it will suggest buying on dips. That could increase the likelihood of a break above the overhead resistance. The pair could then rally to $18,385 which may act as a strong obstacle.
Another possibility is that the price turns down and breaks below the moving averages. In that case, the pair could oscillate between $17,568 and $16,273 for a few more days.
ETH/USD Market Analysis
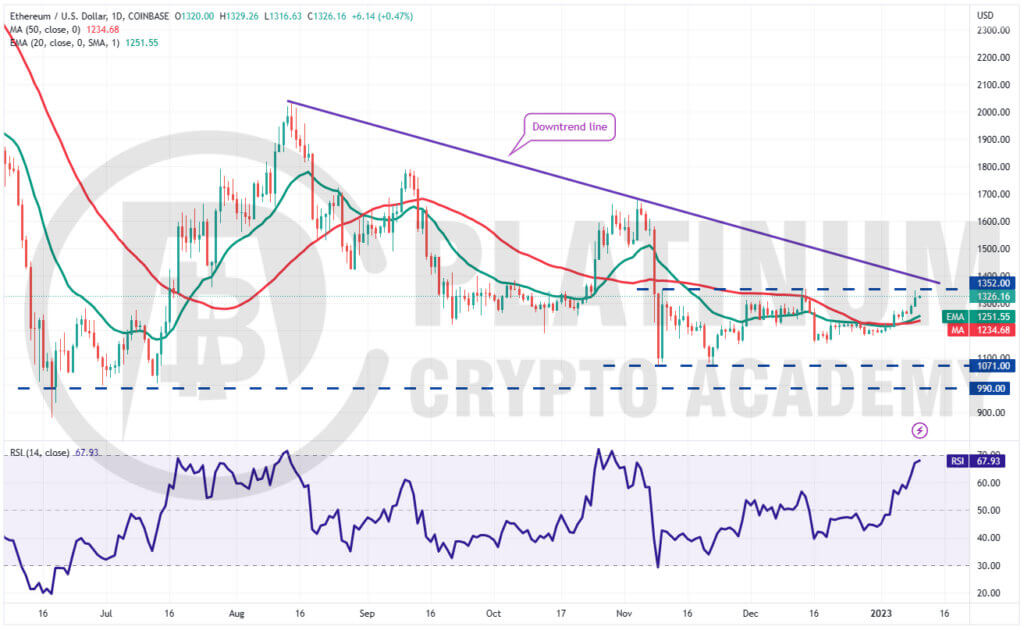
Ether climbed above the moving averages on January 4 and reached the overhead resistance of $1,352 on January 9. The bears are likely to defend the zone between $1,352 and the downtrend line.
If the price turns down from the overhead resistance but rebounds off the 20-day EMA, it will suggest that lower levels are attracting buyers.
That could improve the prospects of a rally above the downtrend line. If that happens, the ETH/USD pair could signal a potential trend change in the near term. The pair could first rally to $1,700 and then to $1,800.
Contrary to this assumption, if the price turns down sharply from the overhead resistance and plummets below the moving averages, it will suggest that the pair may extend its range-bound action for a few more days.
BNB/USD Market Analysis
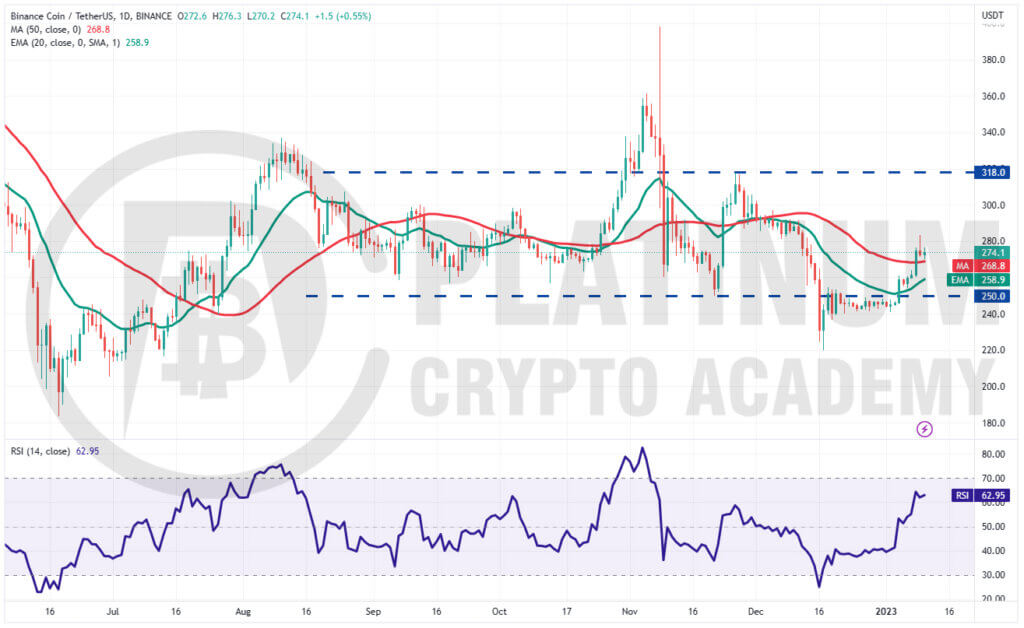
We highlighted in our previous analysis that the bears were defending the $250 level but the bulls did not give up much ground and that was a positive.
Buyers propelled Binance Coin above the 20-day EMA on January 4 and followed that up with a break above the 50-day simple moving average (SMA) on January 8.
The BNB/USD pair hit a snag at $283.50 on January 9 but the bulls are trying to sustain the price above the 50-day SMA. If they manage to do that, the pair could continue its recovery and reach $300.
This level may behave as a roadblock in the near term but if bulls overcome it, the next stop could be $318. The rising 20-day EMA and the RSI in the positive territory indicate that buyers have the edge. If bears want to regain the advantage, they will have to quickly pull the price below the moving averages. That could trap several aggressive bulls and the pair may plummet to $240.
XRP/USD Market Analysis
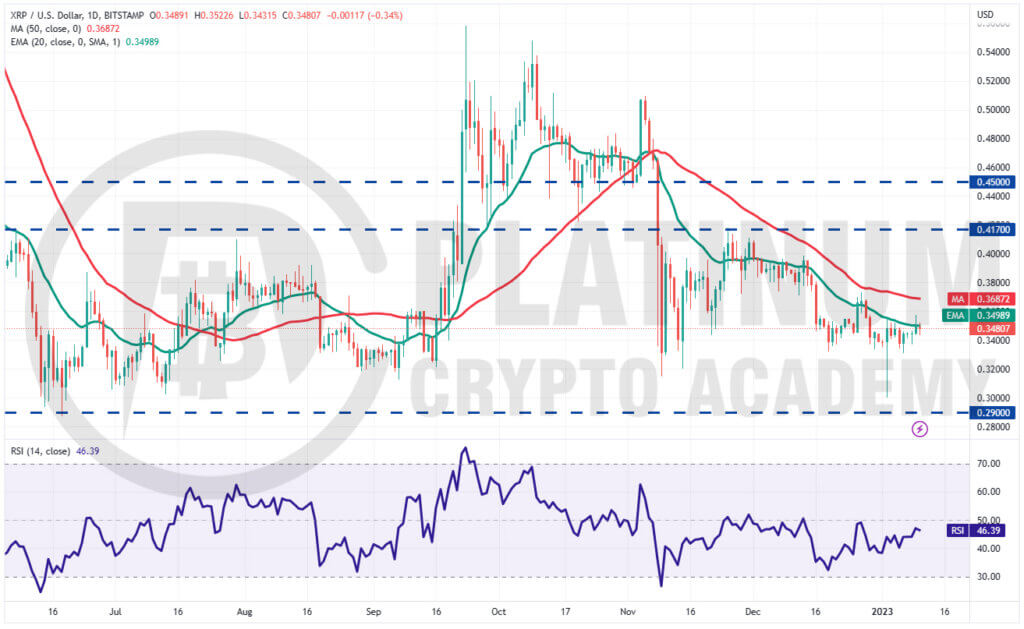
We mentioned in our previous analysis that the bulls are expected to protect the $0.32 to $0.29 zone with all their might and they did just that on January 2. XRP plunged to $0.30 but the long tail on the day’s candlestick shows aggressive buying at lower levels.
However, the bulls are struggling to thrust the price above the moving averages. This suggests that bears have not yet given up and are active at higher levels.
The 20-day EMA is flattening out and the RSI is just below the midpoint, indicating a range-bound action in the near term. The pair could trade between $0.37 and $0.33 for some time.
A break above $0.37 could open the doors for a possible rally to $0.41 while a break below $0.33 could retest the $0.29 to $0.32 support zone.
ADA/USD Market Analysis
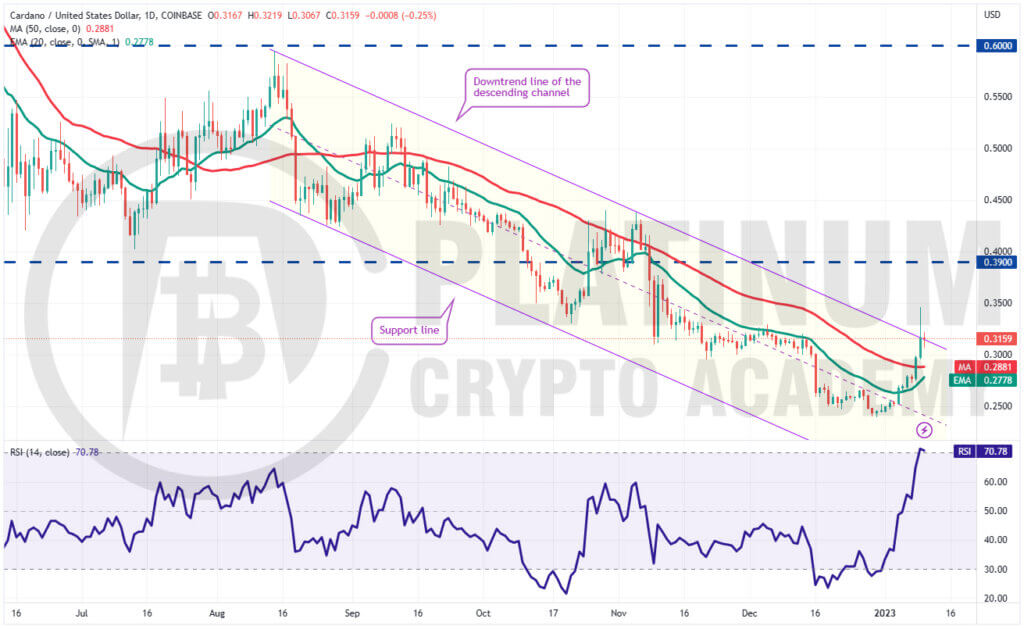
Cardano rose above the 20-day EMA on January 4, indicating that the bears were losing their grip. The recovery picked up momentum after breaking above the 50-day SMA on January 8.
That pushed the ADA/USD pair above the downtrend line of the channel on January 9 but the long wick on the candlestick shows selling at higher levels. The bears are trying to pull the price back into the channel while the bulls are attempting to defend the breakout level.
The moving averages are on the verge of a bullish crossover and the RSI is in the overbought zone, indicating the start of a new up-move.
If the price sustains above the channel, the recovery could continue and the pair may reach $0.39 and thereafter $0.44.
This positive view could invalidate if the price turns down sharply and dives below the moving averages. Such a move will suggest that the breakout of the channel may have been a bull trap.
Hopefully, you have enjoyed today’s article for further coverage please check out our crypto Blog Page. Thanks for reading! Have a fantastic day! Live from the Platinum Crypto Trading Floor.
Earnings Disclaimer: The information you’ll find in this article is for educational purpose only. We make no promise or guarantee of income or earnings. You have to do some work, use your best judgement and perform due diligence before using the information in this article. Your success is still up to you. Nothing in this article is intended to be professional, legal, financial and/or accounting advice. Always seek competent advice from professionals in these matters. If you break the city or other local laws, we will not be held liable for any damages you incur.
")