
The rising Treasury yields pulled the risky assets such as Bitcoin and the U.S. equity markets lower on April 11 as investors sought to curtail risk. Bitcoin plunged below $40,000 for the first time since March 16 and the altcoins also suffered huge losses. The investors are concerned that aggressive tightening by the U.S. Federal Reserve to tame inflation could slow down the economy.
BitMEX CEO Arthur Hayes said in a blog post that the 10-day correlation between Bitcoin and the Nasdaq 100 Index (NDX) remains high. That means if the Nasdaq enters a meltdown, falling 30% to 50%, then the crypto markets are unlikely to be spared. He expects Bitcoin to plummet to $30,000 and Ether to drop to $2,500 by June of this year.
Although the near-term price action favours the bears, whales remain bullish for the long term. At the recently concluded Bitcoin 2022 conference in Miami, ARK Invest CEO Cathie Wood reiterated her call for Bitcoin to reach $1 million by 2030. She expects about two and a half percent of institutional assets to be allocated to Bitcoin in the next eight years.
During the conference, billionaire Ricardo Salinas Pliego disclosed that his liquid portfolio is made up of “60% in bitcoin and bitcoin equities and then 40% in hard-asset stock like oil and gas and gold miners.”
Back in November 2020, Salinas had revealed a 10% exposure to Bitcoin in his liquid assets portfolio. The huge increase in Bitcoin exposure in the past year-and-half shows high conviction in the future of Bitcoin.
Although large investors are bullish for the long term, retail traders should also keep the short-term trend in mind before allocating fresh money. It is always better to buy after a bottom is confirmed rather than attempt to catch a falling knife.
What are the key support and resistance levels to watch out for? Read our analysis of the bitcoin and major altcoins cryptocurrencies to find out.
BTC/USD Market Analysis
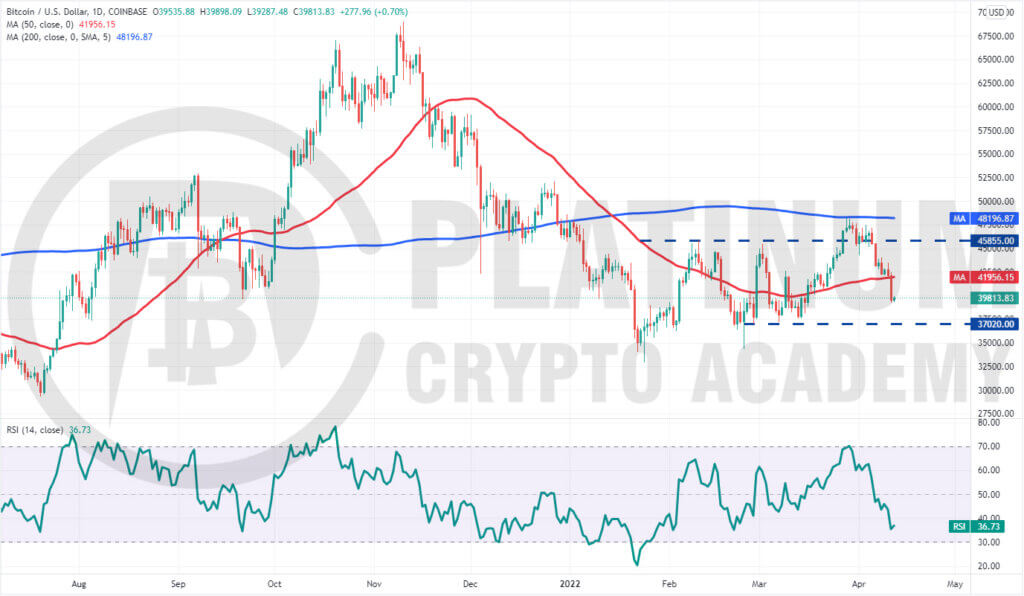
We cautioned traders in our previous analysis that a break below $44,000 could sink Bitcoin to the 50-day simple moving average (SMA) and that is what happened. The BTC/USD pair turned down sharply on April 6 and reached the 50-day SMA on April 8.
Although the bulls defended the 50-day SMA from April 8 to April 10, the failure to achieve a strong bounce off it attracted further selling by the bears. The pair plunged below the 50-day SMA on April 11 and broke the psychological support at $40,000.
If the price sustains below $40,000, the next stop could be the strong support at $37,000. The buyers are likely to defend this level aggressively. If they succeed, the pair could remain stuck inside a large range between $37,000 and the 200-day SMA for a few days.
Alternatively, if the price turns up from the current level, the buyers will try to push the pair above the 50-day SMA. If that happens, it could signal the formation of a higher low, which may be a bullish sign.
ETH/USD Market Analysis
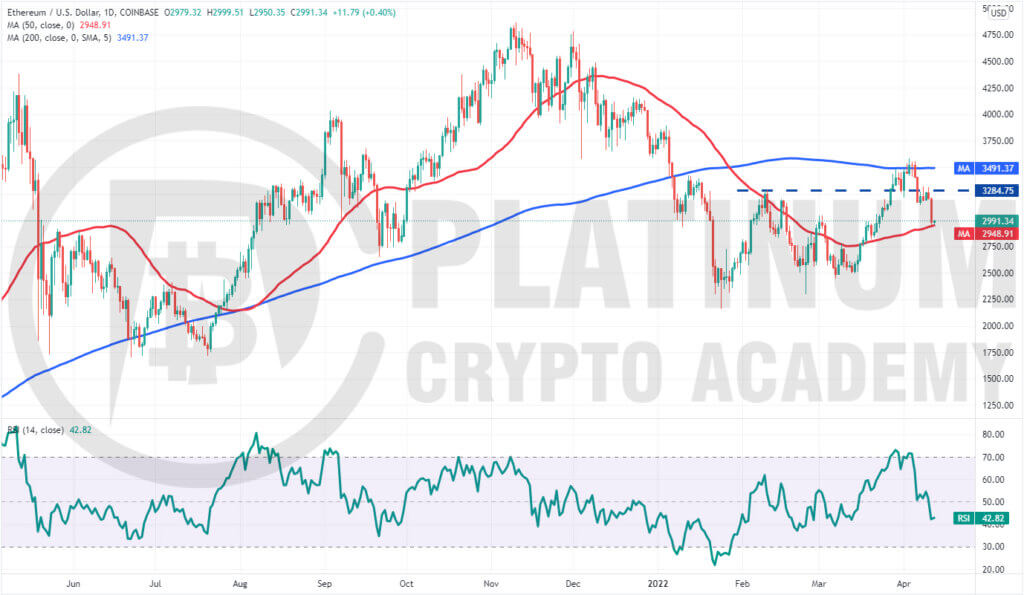
We said in our previous analysis that Ether’s failure to pick up momentum following a break above the 200-day SMA looked like a bull trap and that is what it turned out to be.
The ETH/USD pair broke below the support at $3,284.75 on April 6 and the bears thwarted attempts by the bulls to reclaim the level. The selling resumed on April 11 and the pair dropped to the 50-day SMA.
This is an important level for the bulls to defend because if it cracks, the next stop could be $2,800 and thereafter $2,450. The relative strength index (RSI) in the negative territory indicates that the momentum favours the bears.
Contrary to this assumption, if the price rebounds off the 50-day SMA with strength, it will suggest that the bulls are aggressively buying the dips to this level. That could keep the pair range-bound between the two moving averages for the next few days.
BNB/USD Market Analysis
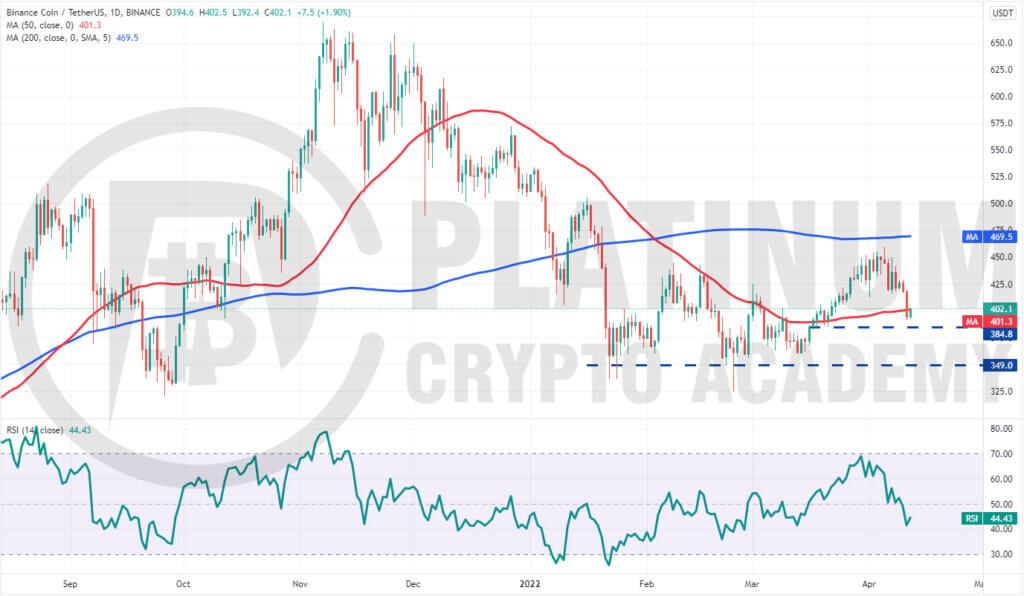
We anticipated the bulls to encounter strong resistance near the 200-day SMA and that is what happened.
The failure to push the price above the 200-day SMA may have tempted short-term traders to book profits. That pulled the price below the 50-day SMA on April 11.
The bulls are attempting to push the price back above the 50-day SMA and trap the aggressive bears. If they manage to sustain the price above the 50-day SMA, the BNB/USD pair could consolidate between the moving averages for a few more days.
However, if the recovery fails to sustain above the 50-day SMA, it will suggest that traders are selling on rallies. A break and close below $384.80 could accelerate selling and the pair may drop to the strong support at $349.
XRP/USD Market Analysis
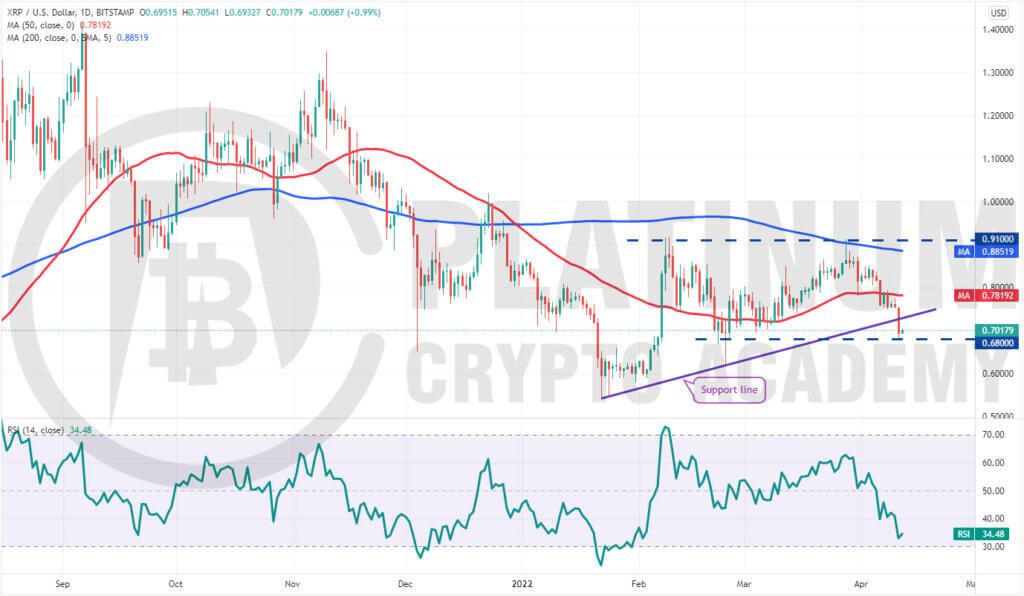
XRP plummeted below the 50-day SMA on April 6, indicating that short-term traders may have been rushing to the exit. The buyers tried to push the price above the 50-day SMA on April 7 and 8 but failed.
This renewed selling and the XRP/USD pair broke below the support line on April 11. The RSI has dropped below 35, indicating that bears have the upper hand.
There is a minor support at $0.68 but if this level cracks, the selling could pick up momentum and the pair could drop to the $0.58 to $0.60 support zone.
Any recovery attempt is likely to face strong resistance at the support line and then again at the 50-day SMA.
The buyers will have to push and sustain the price above the 50-day SMA to indicate that the correction may be over. The pair could then remain range-bound between $0.68 and $0.91 for a few days.
LUNA/USD Market Analysis
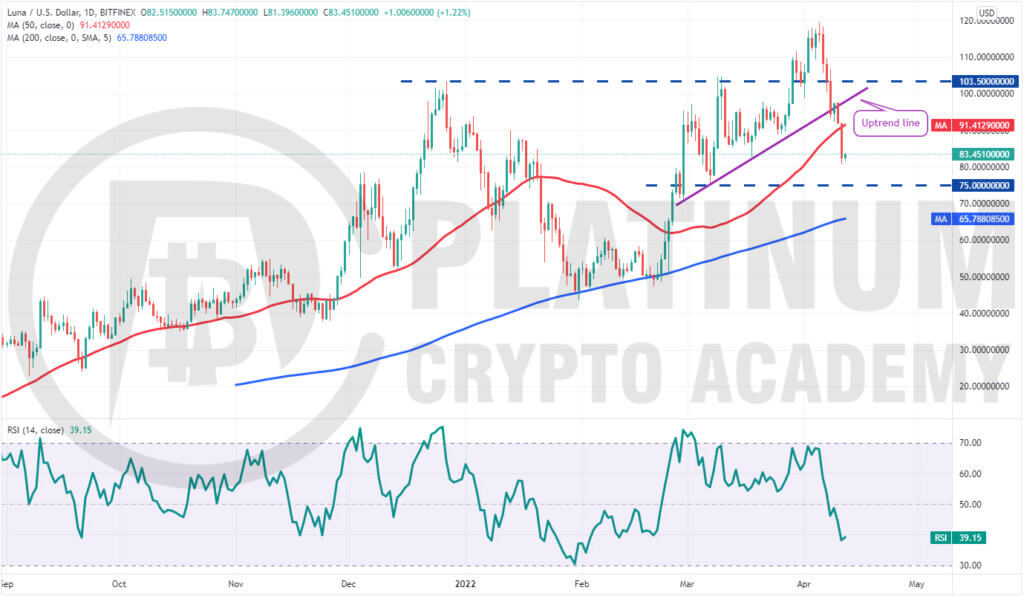
Although Terra’s LUNA token was in an uptrend, we gave it a low probability of rallying to higher levels of $150. And our assumption in the previous analysis proved to be correct.
The LUNA/USD pair turned down from $119.44 on April 5 and broke below the breakout level of $103.50 on April 7. The failure to hold on to this level may have attracted profit-booking by the short-term bulls and selling by the aggressive bears.
The selling intensified on April 8 and the pair broke below the uptrend line. Efforts by the bulls to push the price back above this level failed on April 9, which renewed selling. The pair continued its downward move and broke below the 50-day SMA on April 11.
If the price sustains below the 50-day SMA, the possibility of a drop to the next strong support at $75 increases. If this level also cracks, the next stop could be the critical support at the 200-day SMA.
On the upside, the bears are likely to defend the 50-day SMA and the $103.50 level with vigour.
Hopefully, you have enjoyed today’s article for further coverage please check out our crypto Blog Page. Thanks for reading! Have a fantastic day! Live from the Platinum Crypto Trading Floor.
Earnings Disclaimer: The information you’ll find in this article is for educational purpose only. We make no promise or guarantee of income or earnings. You have to do some work, use your best judgement and perform due diligence before using the information in this article. Your success is still up to you. Nothing in this article is intended to be professional, legal, financial and/or accounting advice. Always seek competent advice from professionals in these matters. If you break the city or other local laws, we will not be held liable for any damages you incur.
