
Risky assets started the month of October on a strong note but the upward march halted after the September nonfarm payroll numbers showed that the job market remained strong. The nonfarm payrolls increased by 263,000 for the month, a tad lower than the Dow Jones estimate of 275,000, but the unemployment rate fell 3.5%, topping forecasts of 3.7%. This stoked fears of another large rate hike by the Federal Reserve in its November meeting. CME’s FedWatch Tool shows a 78.4% probability of a 75 basis point rate hike in November, up from 59.5% a week before.
The United States equities markets plunged after the CPI print on October 7 and the selling continued at the start of the new week on October 10. This sent the Nasdaq Composite tumbling to its lowest close since July 2020.
Although Bitcoin remains closely correlated to the US equities markets, it is showing first signs of outperformance and has managed to stay well above its June low of $17,567.45. This indicates that traders are not panicking and dumping their positions at lower levels.
The next major trigger for the markets could be the September consumer price index data due on October 13. Economists surveyed by Dow Jones anticipate the CPI to increase by 8.1% annually and 0.3% monthly. We expect volatility to soar following the release of the CPI numbers.
Bloomberg Intelligence senior commodity strategist Mike McGlone believes that commodities appeared to have peaked and that could mean a possible bottom in Bitcoin. In the Bloomberg Crypto Outlook report on October 5, McGlone said that Bitcoin could become “a risk-off asset, like gold and US Treasurys,” in the second half of this year.
In its The Week Onchain Newsletter, Glassnode highlighted that “several macro metrics indicate that Bitcoin investors are establishing what could be a bear market floor, with numerous similarities to previous cycle lows.” While a floor may be in, the report cautioned that history suggests a full recovery may still be a few months away.
What are the important levels that could signal a trend change in Bitcoin and the major altcoins? Read our analysis of the major cryptocurrencies to find out.
BTC/USD Market Analysis
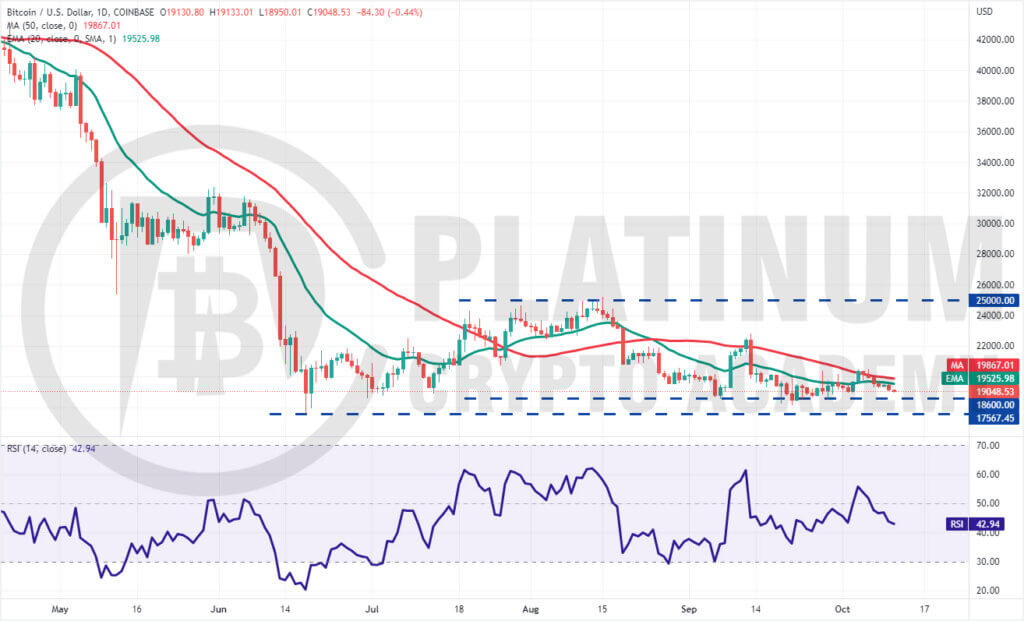
We had highlighted in our previous analysis that $20,500 was the first major hurdle for the bulls and that is where the recovery halted last week. Buyers tried to clear this hurdle between October 4-6 but the bears did not budge.
The BTC/USD pair turned down and broke below the 20-day exponential moving average on October 7. The selling has continued and the pair could next decline to the strong support zone between $18,600 to $18,153. Buyers are expected to aggressively defend this zone.
If the price rebounds off this zone, the bulls will make one more attempt to push the pair to the overhead resistance at $20,500. If they succeed, the pair could climb to $22,800.
Contrary to this assumption, if the price continues lower and breaks below the support zone, the pair could retest the June low of $17,567.45. A break and close below this level could signal the resumption of the downtrend. The next support on the downside is at $16,200.
ETH/USD Market Analysis
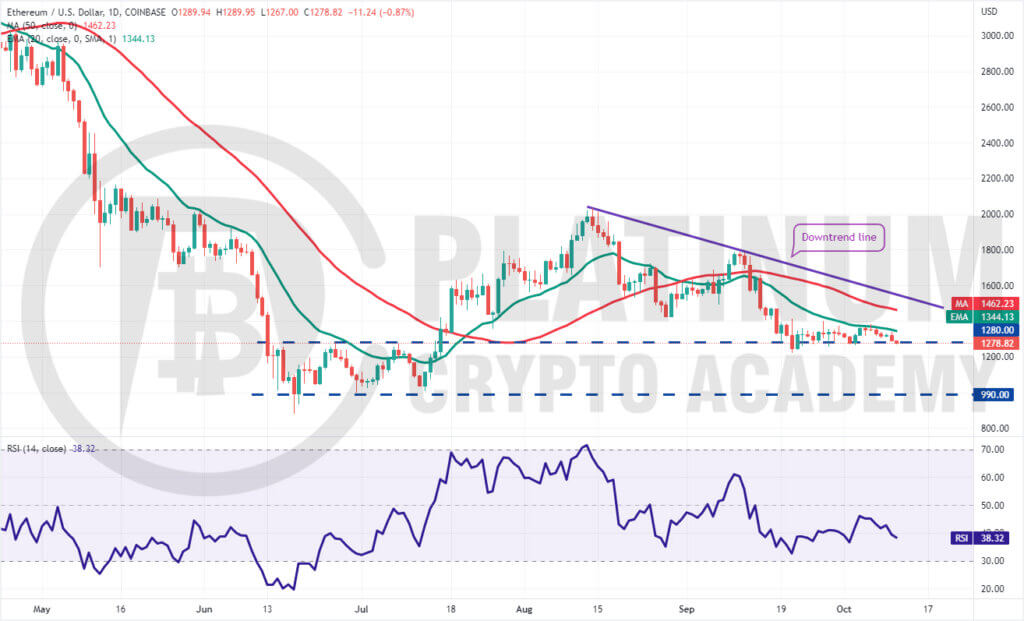
Ether continues to trade between the 20-day EMA and the support zone between $1,220 and $1,280. The bulls pushed the price above the 20-day EMA on October 6 but could not sustain the higher levels. That may have attracted selling by the bears and the price has dropped to the support zone.
The 20-day EMA has started to turn down and the RSI is in the negative territory, indicating advantage to bears. If the price plummets below the support zone, the ETH/USD pair could decline to the psychological support at $1,000.
Alternatively, if the price rebounds off the support zone, the bulls will again try to overcome the barrier at the 20-day EMA.
If they succeed, the pair could rise to the 50-day simple moving average and thereafter to the downtrend line. A break and close above this resistance could signal a potential trend change in the near term.
BNB/USD Market Analysis
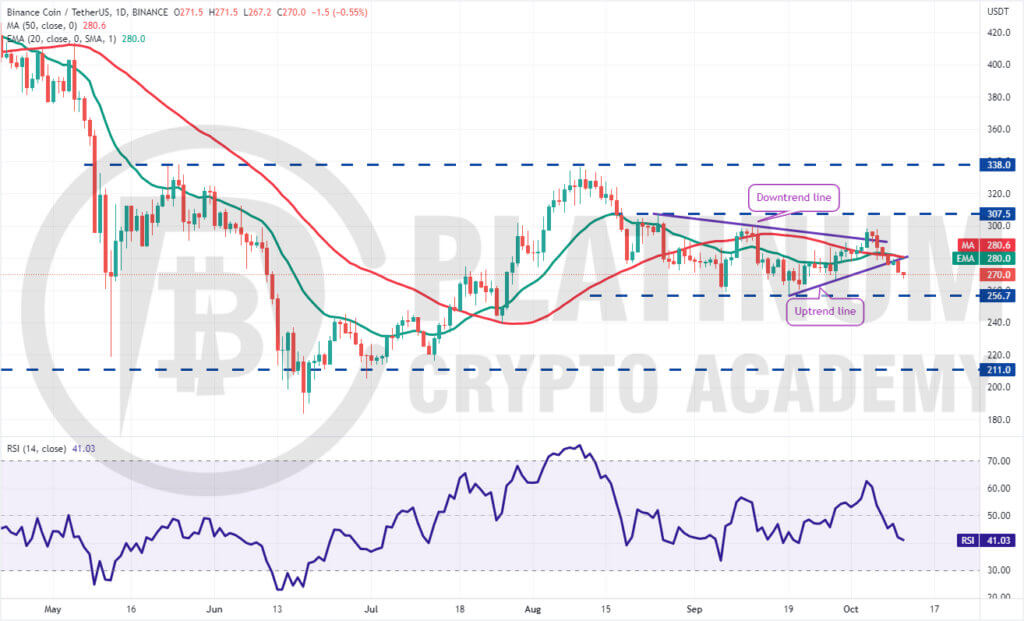
Binance Coin rose above the downtrend line on October 4 but the bulls could not build upon the momentum and drive the price to the overhead resistance at $307.50. The price turned down and slipped below the downtrend line on October 6.
The selling continued and the bears pulled the price below the uptrend line on October 8. Buyers tried to push the price back above the uptrend line on October 9 but the selling resumed on October 10.
If the BNB/USD pair slides below $266, the next stop could be the critical support of $256.70. The bulls had successfully defended this level on two occasions and may again try to do that. If the price rebounds off this level, it will suggest that the pair may extend its range-bound action between $256.70 and $307.50 for some more time.
Conversely, a break and close below $256.70 could suggest that the bears have overpowered the bulls. The pair could then drop to $240.
XRP/USD Market Analysis
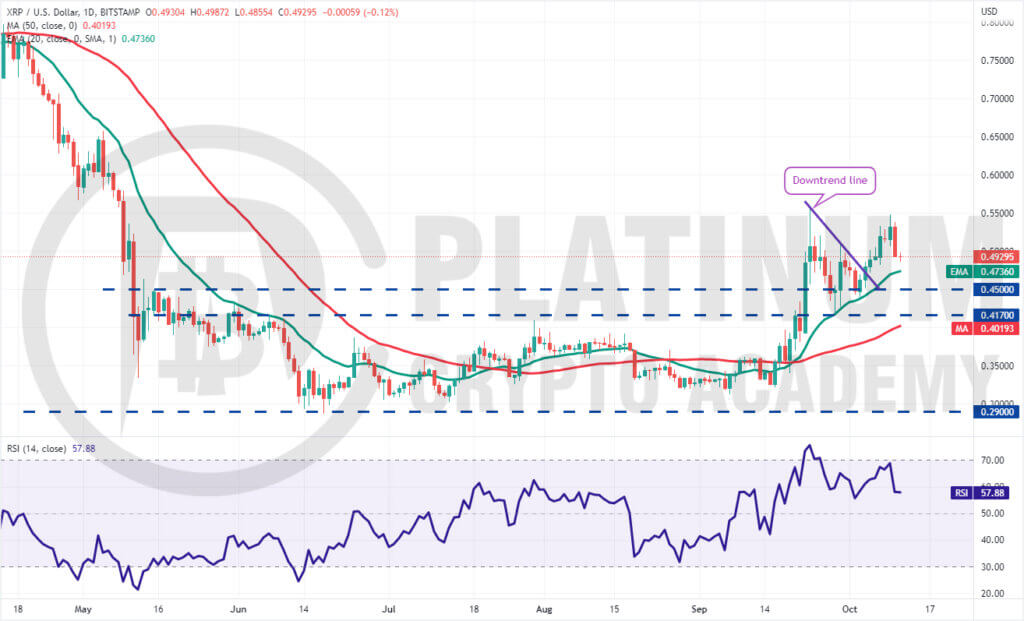
We had projected in the previous analysis that if bulls propel the price above the downtrend line, XRP could attempt a rally to the $0.52 to $0.56 resistance zone and that is what happened.
The price rose to $0.55 on October 9 but the bulls could not clear the obstacle at $0.56. This may have tempted short-term traders to book profits, which has pulled the price to the 20-day EMA.
If the price rebounds off the 20-day EMA, the bulls will again attempt to push the pair above $0.56. If they succeed, the XRP/USD pair could attempt a rally to $0.66.
On the contrary, if bears sink the price below the 20-day EMA, the pair could drop to $0.45 and then to $0.41. The bulls are expected to defend this zone with vigor. If the price rebounds off this zone, the pair could oscillate between $0.41 and $0.56 for some time.
ADA/USD Market Analysis
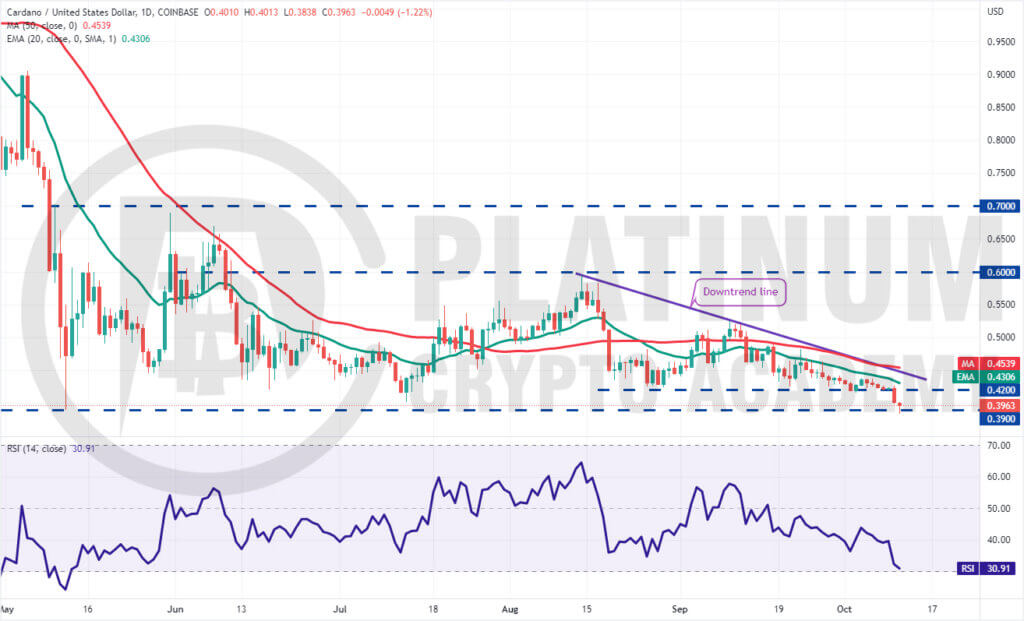
We said in the previous analysis that bears had the upper hand and a break below $0.42 could pull the price to the vital support at $0.39 and that is how it played out.
The long tail on the October 11 candlestick shows that the bulls are attempting to defend the support with vigor. However, the relief rally is likely to face stiff resistance at $0.42.
If the price turns down from $0.42, the bears will make one more attempt to sink the ADA/USD pair below $0.39. If the bears can pull it off, the pair could decline to $0.35.
This negative view could invalidate in the short term if the price rises and breaks above the downtrend line. Such a move will suggest aggressive buying at lower levels. The pair could then attempt a rally to $0.52.
.
Hopefully, you have enjoyed today’s article for further coverage please check out our crypto Blog Page. Thanks for reading! Have a fantastic day! Live from the Platinum Crypto Trading Floor.
Earnings Disclaimer: The information you’ll find in this article is for educational purpose only. We make no promise or guarantee of income or earnings. You have to do some work, use your best judgement and perform due diligence before using the information in this article. Your success is still up to you. Nothing in this article is intended to be professional, legal, financial and/or accounting advice. Always seek competent advice from professionals in these matters. If you break the city or other local laws, we will not be held liable for any damages you incur.
")