
Investors are dumping risky assets on fears that the United States Federal Reserve will have to aggressively tighten monetary policy to bring stubborn inflation under control and that could result in a recession.
The selling picked up momentum after the US Bureau of Labor Statistics reported on June 10 that the consumer price index soared 8.6% for the 12 months ending May, the largest annual increase since December 1981. The sell-off in the equity markets continued on June 13 and the S&P 500 fell into the bear market territory.
In addition to the close correlation with the US equities markets, the selloff in the crypto markets intensified after crypto lender Celsius paused all withdrawals citing “extreme market conditions.” This led to rumours that Celsius may be facing a liquidity crisis.
When markets are gripped in a state of panic, investors dump their holdings fearing the worse. Bitcoin plunged below $21,000 on June 14, wiping off all the gains made in 2021. The altcoins are faring no better, with Ether falling below $1,100 on June 14 and several other altcoins reeling under intense selling pressure. That has caused the total crypto market capitalization to plummet near $900 billion, according to coinmarketcap data.
After the fall in Bitcoin, MicroStrategy’s stash of 129,219 Bitcoins purchased at $3.97 billion is valued at $2.82 billion and Tesla’s Bitcoin holding acquired at $1.5 billion is valued at $945 million, according to Bitcoin Treasuries. Talks of MicroStrategy facing margin calls below $21,000 have been doing rounds but the firm’s CEO Michael Saylor previously said that Bitcoin will have to drop below $3,500 before it becomes a problem.
Usually, bear markets end with a capitulation. Therefore, traders may get their buy list of fundamentally strong coins ready and start accumulating in phases after the decline ends. Traders may stay away from leverage until a new bull market starts.
What are the levels that may attract buyers? Read our weekly crypto market analysis that explains how the Bitcoin price is close to a bottom? After the panic-driven selling in Bitcoin and major altcoins, a strong relief rally could be expected in the next few days.
BTC/USD Market Analysis
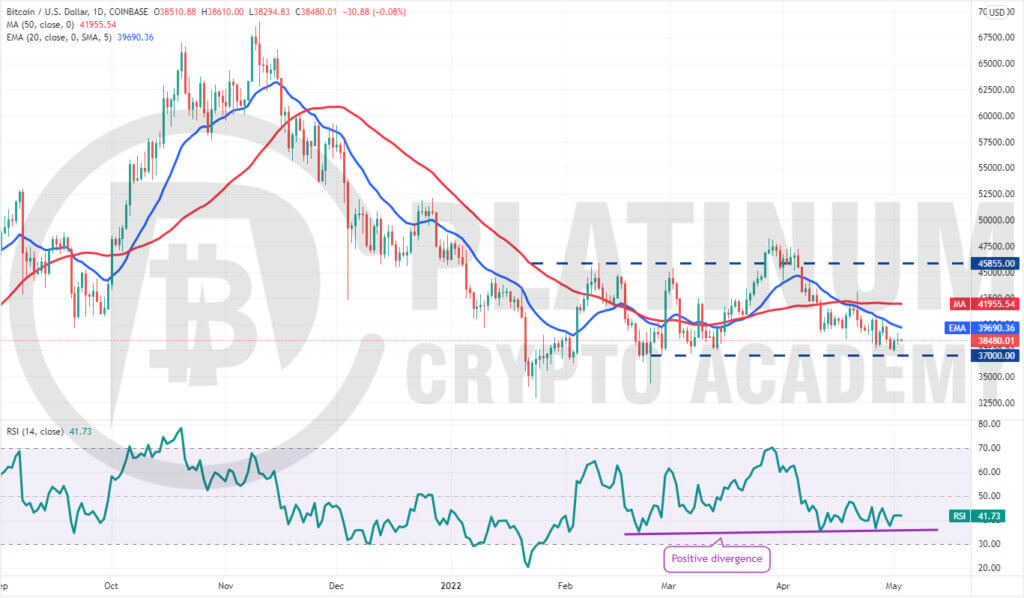
We had suggested in our previous analysis that if Bitcoin plummets below $25,338, it could drop to $20,000. That is what happened and Bitcoin dropped to $20,816.40 on June 14. The bulls are expected to defend the $20,000 support with all their might.
The sharp fall of the past few days has sent the relative strength index deep into the oversold territory. This suggests that the selling may have been overdone in the short term and a relief rally is likely.
If the price rebounds off the current level, the BTC/USD pair could rise to $25,338 and then to $28,800. The bears will try to flip this zone into resistance. If they do that, it will suggest that the sentiment remains negative and traders are selling on rallies.
The bears will then again attempt to resume the downtrend. A break below $20,000 could open the doors for a possible decline to $15,000 but we give it a low possibility of occurring.
On the upside, the bulls will have to push the price above the 20-day exponential moving average (EMA) to indicate that the sellers may be losing their grip. A potential trend change will be signalled if bulls push the pair above $32,646.
ETH/USD Market Analysis
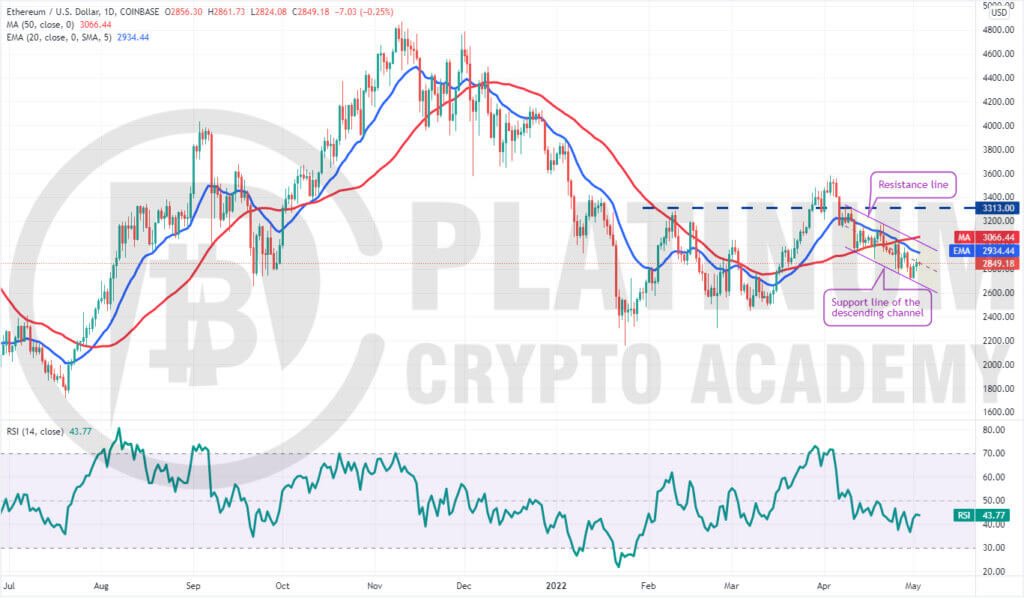
$1,241. The ETH/USD pair reached the target objective on June 13 and dipped to an intraday low of $1074.64 on June 14.
The RSI has dropped below 21, which suggests that a short-term relief rally is possible. The bulls may defend the psychological level of $1,000 aggressively. These two reasons combined could start a recovery which could push the price to the breakdown level of $1,700.
This is an important level to keep an eye on because if the price turns down from $1,700, it will suggest that bears have flipped the level into resistance. That could keep the pair range-bound between $1,700 and $1,000 for a few days.
A break and close above $1,700 will be the first sign that the downtrend may be ending while a drop below $1,000 could pull the pair to $905.
BNB/USD Market Analysis
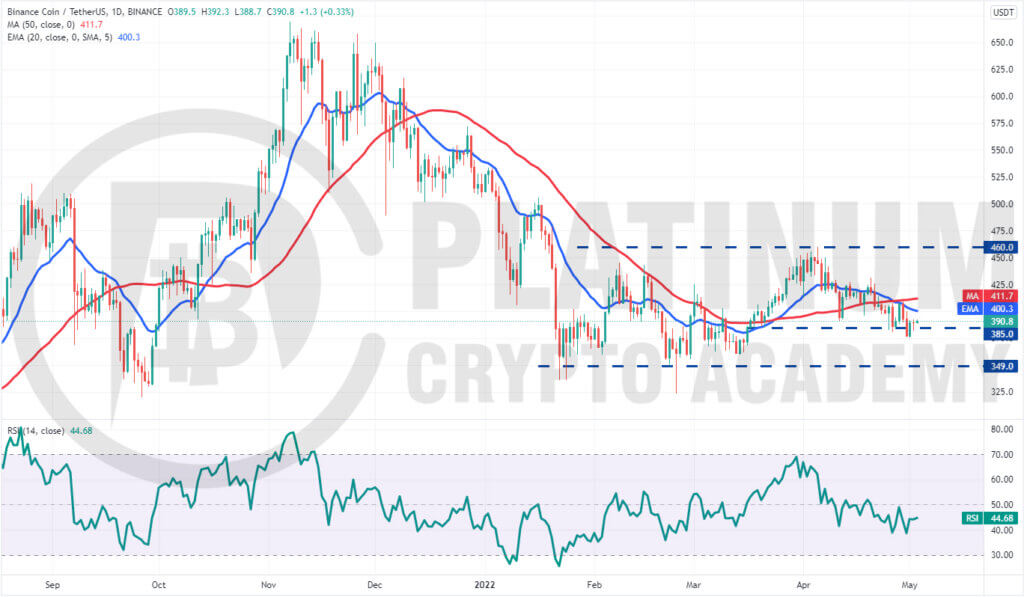
We had suggested in our previous analysis that the indicators were suggesting advantage to the bears and a break below $254 could pull Binance Coin to $218. That is what happened as the BNB/USD pair plunged to $204.1 on June 14.
Although the downsloping moving averages suggest advantage to bears, the RSI in the deeply oversold level increases the likelihood of a relief rally in the near term.
If the price rebounds off the current level, the bulls will attempt to push and sustain the price back above $254. If they manage to do that, it will suggest that the pair may have bottomed out.
Conversely, if the price turns down from $254, it will suggest that bears have flipped the level into resistance. The sellers will then attempt to sink the pair below the psychological level of $200 and resume the downtrend. The next support on the downside is $186 and then $150.
XRP/USD Market Analysis
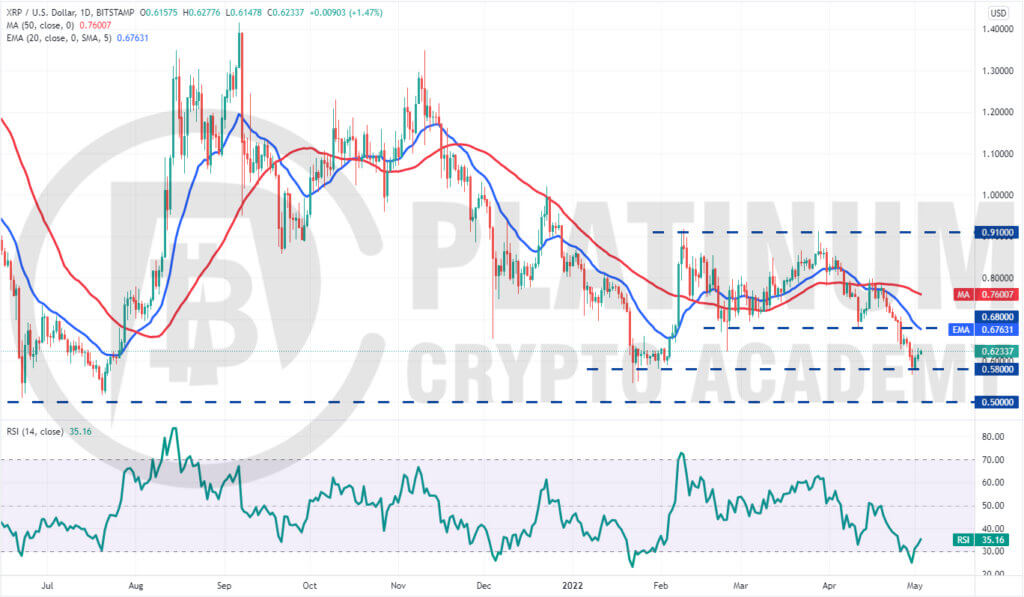
The failure of the bulls to push XRP above the 20-day EMA from June 7 to June 10 may have attracted selling by the bears. The XRP/USD pair plunged below the strong support of $0.38 on June 11.
Although we had expected the bulls to mount a strong defence in the zone between $0.33 and $0.38, that did not happen. The bears pulled the pair below $0.33 on June 13.
The long tail on the June 14 candlestick suggests that the bulls are attempting to defend the level at $0.30. Any relief rally is likely to hit a wall at the breakdown level of $0.38.
If the price turns down from this resistance, it will suggest that traders continue to sell on rallies. The bears will then attempt to sink the pair below $0.29 and resume the downtrend. The next support on the downside is $0.24.
To invalidate this negative view, the bulls will have to push and sustain the price above $0.38. If they do that, the pair could rise to $0.45.
SOL/USD Market Analysis
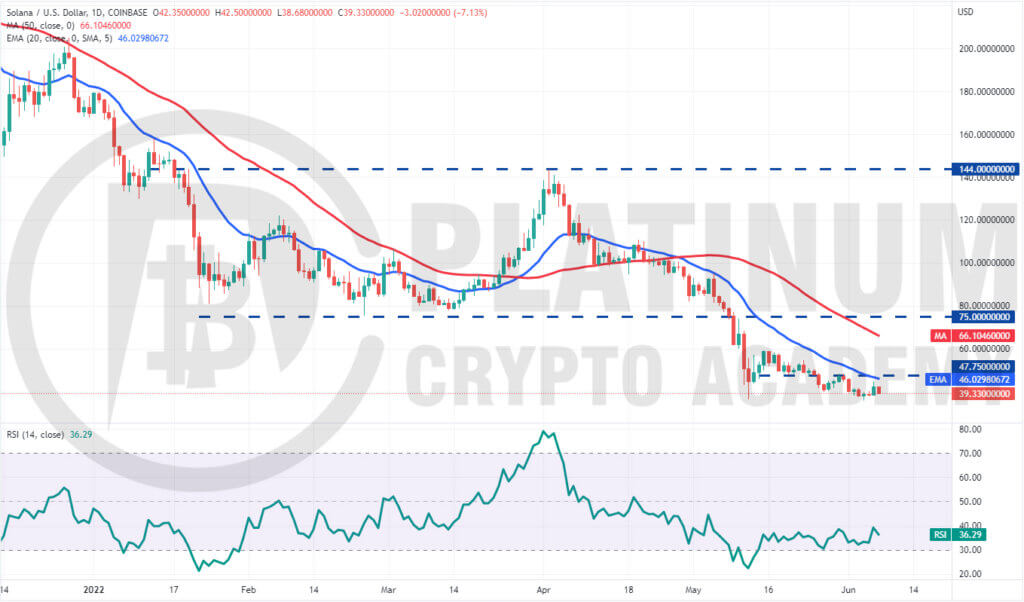
We had projected in our previous analysis that Solana could drop to $26 and that is what happened. The SOL/USD pair dipped to $25.84 on June 14.
While the downsloping moving averages suggest that sellers are in control, the RSI is showing a bullish divergence. This indicates that the bearish momentum may be weakening and a relief rally is likely.
If the price rebounds off the current level, the pair could retest the breakdown level of $36. This is an important level to watch out for because if the price turns down from it, the bears will attempt to pull the pair below $25.84 and resume the downtrend. If they succeed, the pair could plunge to $22 and later to $20.
On the other hand, if bulls drive the price above the 20-day EMA, it will suggest strong accumulation at lower levels. That could clear the path for a possible rally to $60.
Hopefully, you have enjoyed today’s article for further coverage please check out our crypto Blog Page. Thanks for reading! Have a fantastic day! Live from the Platinum Crypto Trading Floor.
Earnings Disclaimer: The information you’ll find in this article is for educational purpose only. We make no promise or guarantee of income or earnings. You have to do some work, use your best judgement and perform due diligence before using the information in this article. Your success is still up to you. Nothing in this article is intended to be professional, legal, financial and/or accounting advice. Always seek competent advice from professionals in these matters. If you break the city or other local laws, we will not be held liable for any damages you incur.
