
Risky assets made a strong comeback last week. The United States equities markets rallied more than 5.4% and the crypto markets saw strong gains in select altcoins. Although Bitcoin sustained above the psychological level of $20,000, the gains have been muted. This shows that the investors remain cautious and are not convinced that a bottom has been formed.
Glassnode said in its June 24 research report that the current bear market may be the “most significant bear market in digital asset history.” During previous bear markets, Bitcoin bottomed out between 75% and 84% below its all-time high. The current drawdown of 73.3% from the November high is close to the historical norms but the Mayer Multiple, which records the deviation from the 200-day moving average, dropped to a value of 0.487. The value has slipped below 0.5 only on 84 out of 4,160 trading days, which shows the deeply oversold conditions.
Cryptocurrency research firm Delphi Digital believes that Bitcoin could fall about 50% from the current levels and bottom out near $10,000. One metric that supports the firm’s view of a final capitulation is the Bitcoin supply in profit, which is currently at 54.9%. During previous bear markets, this metric hit a low of 40% before Bitcoin bottomed out.
Institutional investors continue to withdraw funds from digital assets, according to the latest CoinShares’ weekly “Digital Asset Fund Flows” report. Digital investment products saw the largest outflows of $423 million, mainly due to outflows from the Canadian exchanges on June 17.
The recovery in Bitcoin’s price could be a long-drawn affair, according to Binance founder and chief executive Changpeng Zhao. In an interview with The Guardian, Zhao said that it could “take a few months or a couple of years” before Bitcoin reaches its all-time high but added that “no one can predict the future.”
Do charts point to a further fall or a recovery in the near term? Read our analysis of Bitcoin Crash as Bitcoin is bottoming out but the bulls are trying to form a higher low. If that happens, the rally could surprise to the upside.
BTC/USD Market Analysis
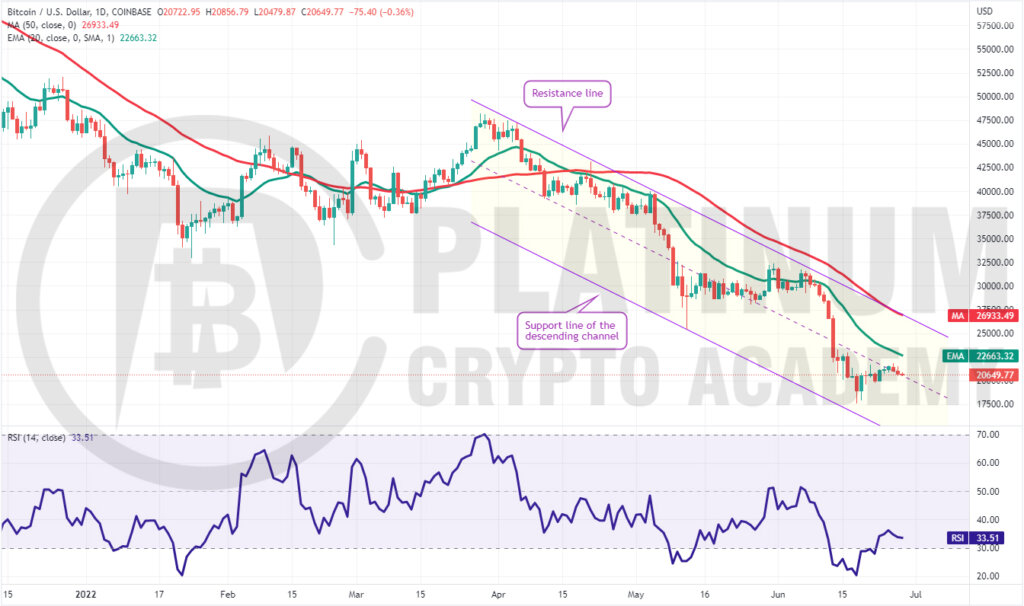
Bitcoin’s recovery could not rise above $22,000 and reach the 20-day exponential moving average (EMA). This suggests that demand dries up at higher levels and bears continue to sell on minor rallies.
Both moving averages are sloping down and the relative strength index (RSI) is in the negative territory, indicating advantage to bears.
The critical level to watch on the downside is $19,500. If the price rebounds off this level with strength, it will suggest that bulls are attempting to form a higher low. The buyers will then make one more attempt to push the price above the 20-day EMA.
If they succeed, the BTC/USD pair could rally to the resistance line of the descending channel.
On the other hand, if bears sink the price below $19,500, the pair could retest the June 18 intraday low of $17,567.45. This is an important level for the bulls to defend because a break below it could signal the start of the next leg of the downtrend. The pair could then decline to $16,000 and next to $14,000.
ETH/USD Market Analysis
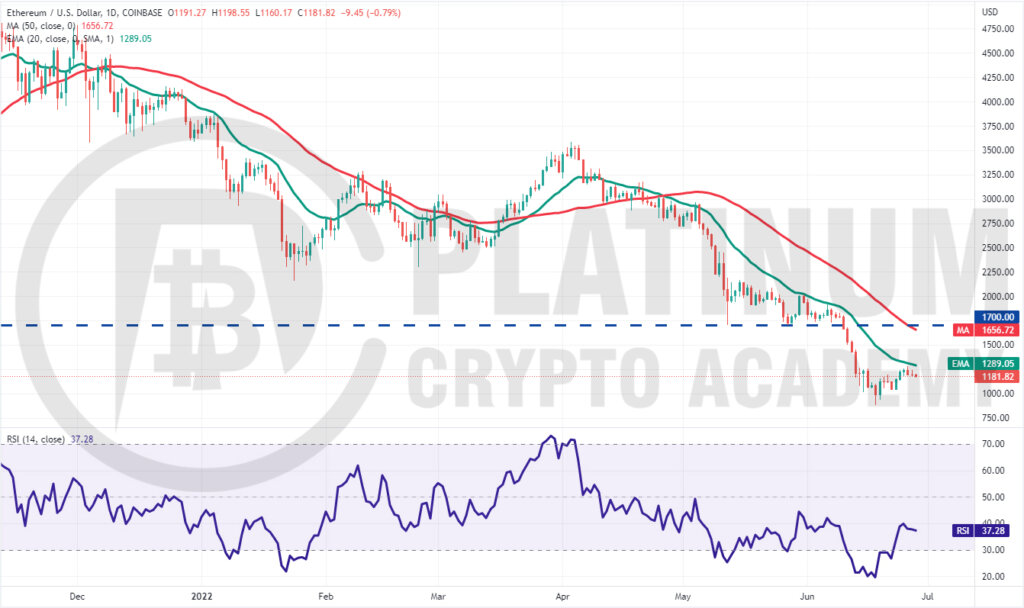
Ether rallied to the 20-day EMA as we had suggested in the previous analysis but the bulls could not push the price above it. This suggests that bears continue to defend the level aggressively.
The sellers will now try to pull the price to the strong support at $1,040. If the price rebounds off this level with strength, it will suggest that bulls are attempting to form a higher low.
The buyers will then try to push the price above $1,280. If they succeed, it could clear the path for a possible rally to $1,700. This is an important level to keep an eye on because a break and close above it could indicate a potential change in trend.
Contrary to this assumption, if the price continues lower and breaks below $1,050, it will suggest that bears remain in command. The ETH/USD pair could then retest the June 18 low of $879.80.
If this support cracks, the pair could resume its downtrend to the next support at $715.
BNB/USD Market Analysis
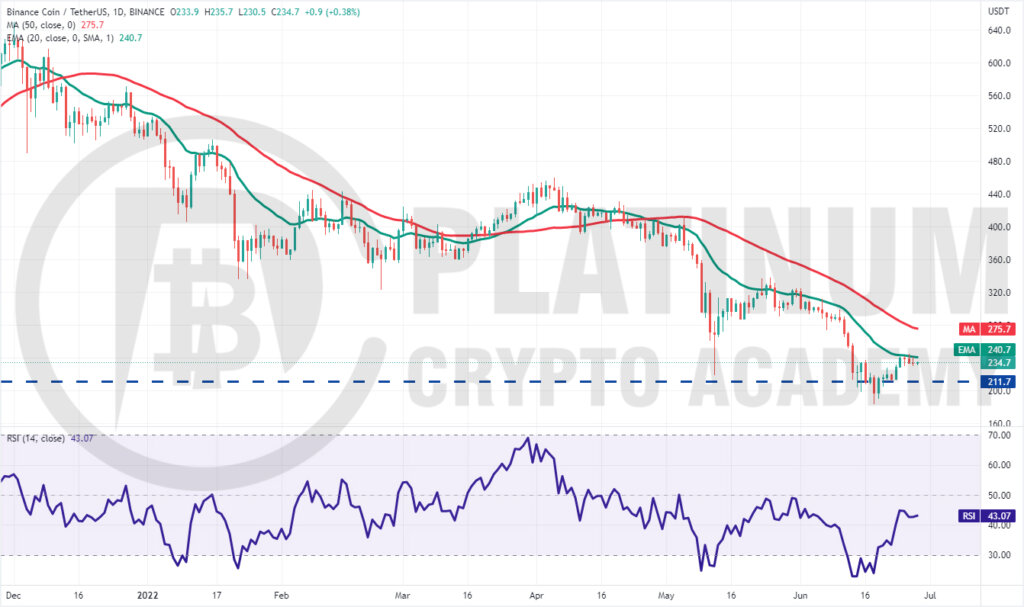
The bears tried to sink Binance back below $211 on June 22 but the bulls held their ground. The BNB/USD pair bounced sharply on June 23 and reached the 20-day EMA on June 24.
This level is acting as a stiff barrier but a minor positive is that the bulls have not given up much ground. This shows that the bulls expect a breakout of the 20-day EMA.
If that happens, the pair could rally to the 50-day simple moving average (SMA). This level may again act as a hurdle but if buyers overcome it, the pair could signal a trend change.
This bullish view could invalidate in the short term if the price turns down and breaks below $211. Such a move could clear the path for a retest of the vital support at $183. If this level cracks, the decline could extend to $150.
XRP/USD Market Analysis
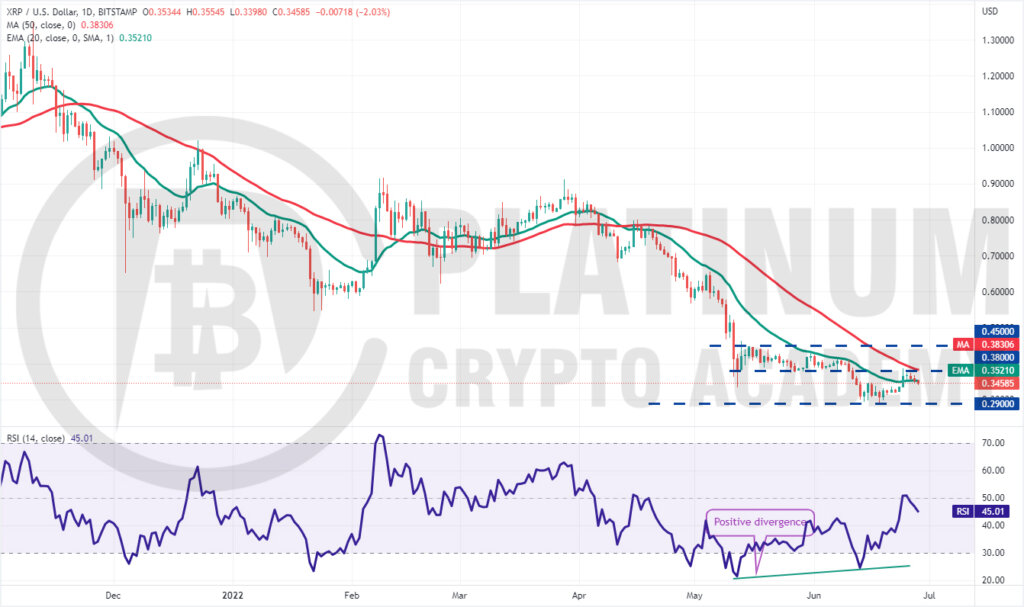
The bulls pushed XRP above the 20-day EMA on June 24 but could not clear the hurdle at the 50-day SMA. This suggests that the sentiment remains negative and bears are selling on rallies.
The bears pulled the price back below the 20-day EMA on June 28, indicating that the XRP/USD pair may remain stuck between $0.29 and $0.38 for a few more days. The flattish 20-day EMA and the RSI just below the midpoint also suggest a range-bound action in the near term.
Alternatively, if the price turns up from the current level and breaks above the overhead resistance at $0.38, the pair could rally to $0.45. This is an important level to keep an eye on because a break and close above it could indicate the start of a new up-move.
The bears will have to sink the price below $0.29 to signal the start of the next leg of the downtrend. The pair could then decline to $0.24.
ADA/USD Market Analysis
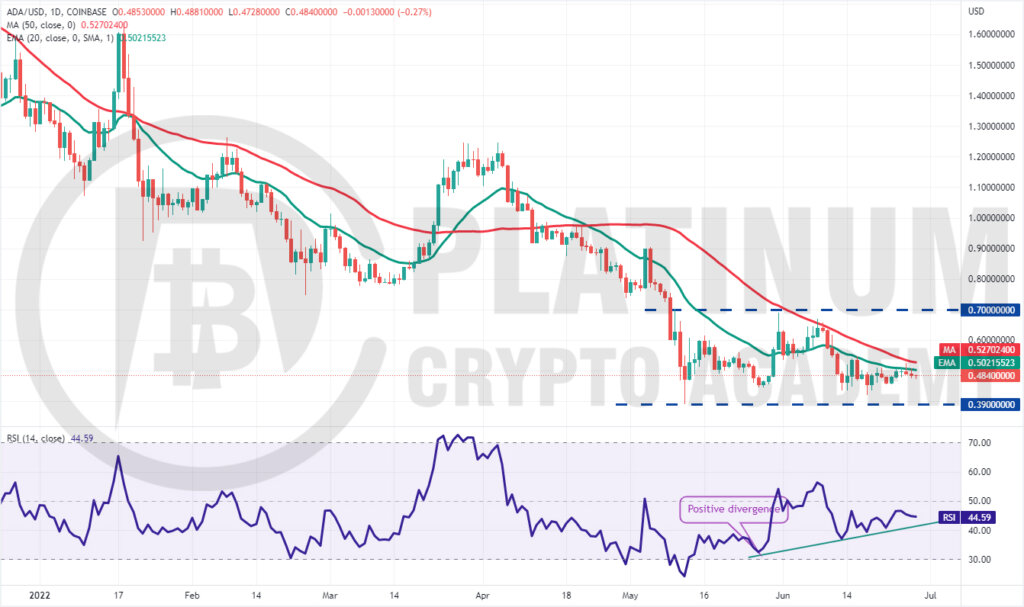
Cardano rallied above the 20-day EMA on June 26 but the long wick on the day’s candlestick suggests that the bears are defending the 50-day SMA aggressively.
However, a minor positive is that the ADA/USD pair has been clinging to the 20-day EMA. This increases the possibility of a break above the moving averages. If that happens, the pair could start its northward march toward the overhead resistance at $0.70.
Conversely, if the price turns down and slips below $0.43, the pair could drop to the strong support of $0.39. If the price rebounds off this level, it will suggest that the large range between $0.39 and $0.70 remains intact.
But if bears sink the price below $0.39, it could signal the resumption of the downtrend. The next support on the downside is at $0.30.
Hopefully, you have enjoyed today’s article for further coverage please check out our crypto Blog Page. Thanks for reading! Have a fantastic day! Live from the Platinum Crypto Trading Floor.
Earnings Disclaimer: The information you’ll find in this article is for educational purpose only. We make no promise or guarantee of income or earnings. You have to do some work, use your best judgement and perform due diligence before using the information in this article. Your success is still up to you. Nothing in this article is intended to be professional, legal, financial and/or accounting advice. Always seek competent advice from professionals in these matters. If you break the city or other local laws, we will not be held liable for any damages you incur.
")