
Bitcoin and most major altcoins have extended their up-move in the past week but could the recovery continue further or is it time to book profits?
Bitcoin and most major altcoins are overbought in the near term. A knee-jerk reaction to the downside to shake out the weak hands is possible.
Bitcoin has made a near 40% recovery in 2023, indicating aggressive buying by the bulls. The rally received a further boost last week after data showed that the United States producer prices in December dropped 0.5%, the most since April 2020.
This increases expectations that inflation may have peaked and the US Fed may slow down its blistering pace of rate hikes. The CME FedWatch Tool shows that market participants expect a 25 basis points rate hike in the next meeting on February 1.
A Reuters poll showed that most economists expect the Fed to raise rates by 25 basis points each in its next two policy meetings and then pause for at least a year. A small minority however expect the Fed to cut rates before the end of the year.
If the Fed turns dovish, investors may be encouraged to take on more risk in their portfolio and that may prove to be bullish for cryptocurrencies.
However, many analysts are skeptical of the current rally and believe it is just a dead cat bounce. They seem to be using the rise to initiate short positions. CoinShares’ Digital Asset Fund Flows Weekly Report on January 23 shows an inflow of $37 million into digital asset investment products but $25.5 million of it was into short-Bitcoin products.
Although anything is possible in the crypto markets, Bitcoin’s strong rally off the lows shows that a macro bottom may be in place. The rally completely shrugged off the bankruptcy filing of crypto-lender Genesis on January 20. When markets do not react negatively to a piece of seemingly bearish news in a downtrend, it is a sign of a potential trend change.
It is unlikely that the crypto markets will start a roaring bull phase just yet. The rallies are likely to be followed by sharp declines, which will test investors’ patience and there will be periods of range-bound action but overall the trajectory should be up.
What are the resistance levels that may start a correction in Bitcoin and major altcoins? Let’s look at the charts to find out.
BTC/USD Market Analysis
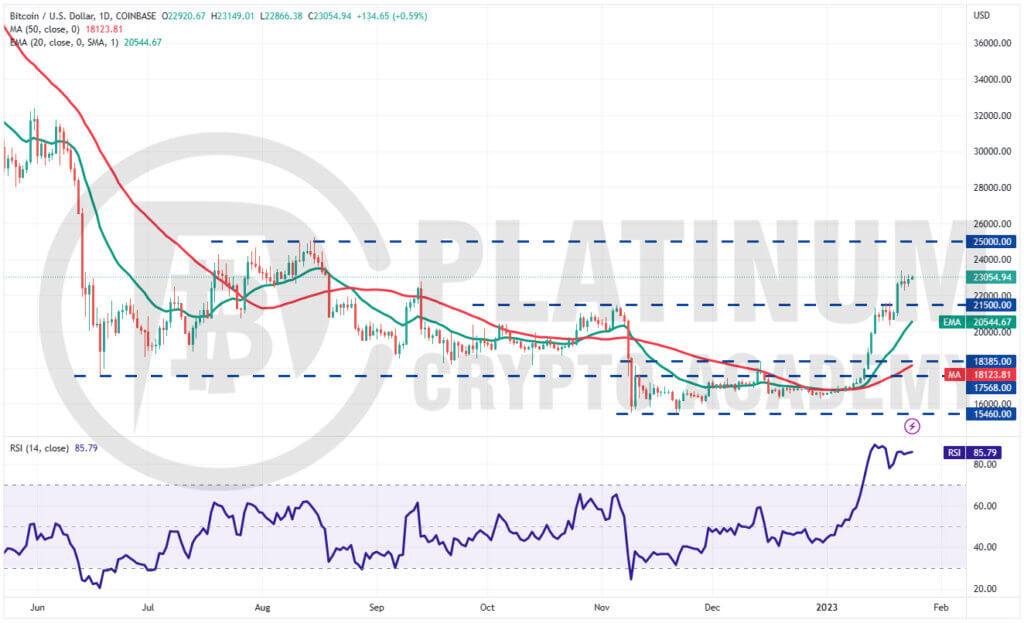
We mentioned in our previous analysis that Bitcoin’s first support zone is between $20,500 and $20,000 and if this holds, the rally could reach $22,800 and that is what happened.
The BTC/USD pair turned up from $20,370.01 on January 18 and soared to $23,375.60 on January 21.
The upsloping moving averages signal that bulls remain in command but the relative strength index in the deeply overbought territory warns of a possible pullback in the near term.
If the price turns down from the current level but bounces off the 20-day exponential moving average (EMA), it will suggest that the sentiment has turned bullish and traders are viewing the dips as a buying opportunity.
That could increase the possibility of a rally to $25,000. This level may act as a significant hurdle to the bulls, resulting in a meaningful correction.
On the downside, a break and close below the 20-day EMA could indicate weakening momentum. The bears will then try to pull the pair down to $20,000 and later to $18,385.
ETH/USD Market Analysis
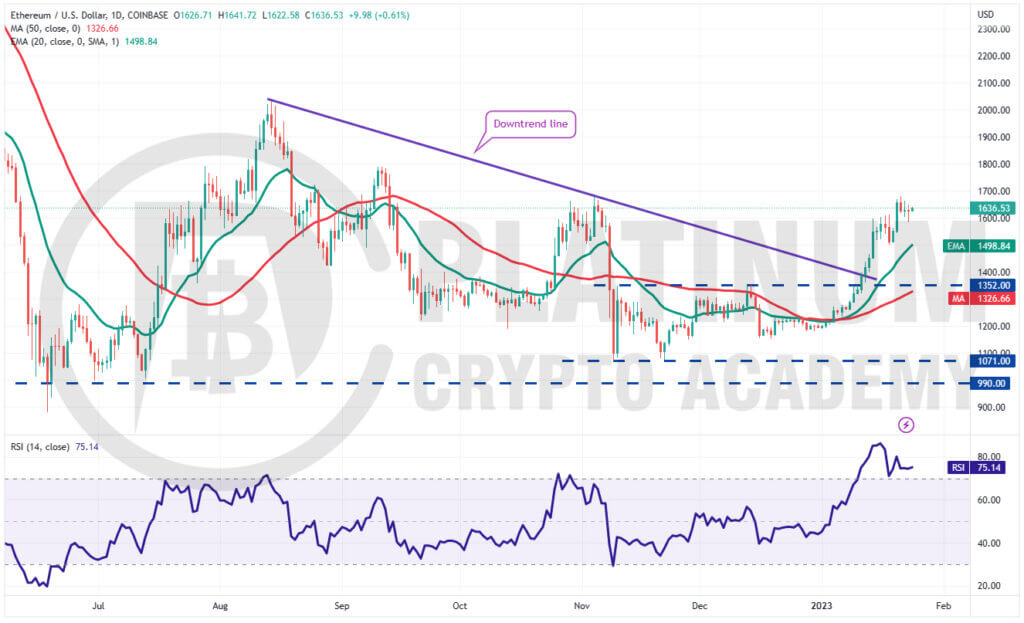
We projected Ether to witness a minor correction in the previous analysis and that happened on January 18. The bulls did not give up much ground during the pullback and Ether turned up from $1,500.32.
This suggests that buyers are not waiting for a deeper fall to enter. The ETH/USD pair resumed its up-move and rose to $1,680 on January 21, close to our anticipated level of $1,700.
The upsloping moving averages and the RSI in the overbought territory indicate the path of least resistance is to the upside.
If bulls drive the price above $1,700, the ETH/USD pair could start its northward march toward $2,000 with a brief stop at $1,800.
This positive view could be invalidated in the near term if the price turns down and plummets below the 20-day EMA. The pair could then slide to $1,352.
BNB/USD Market Analysis
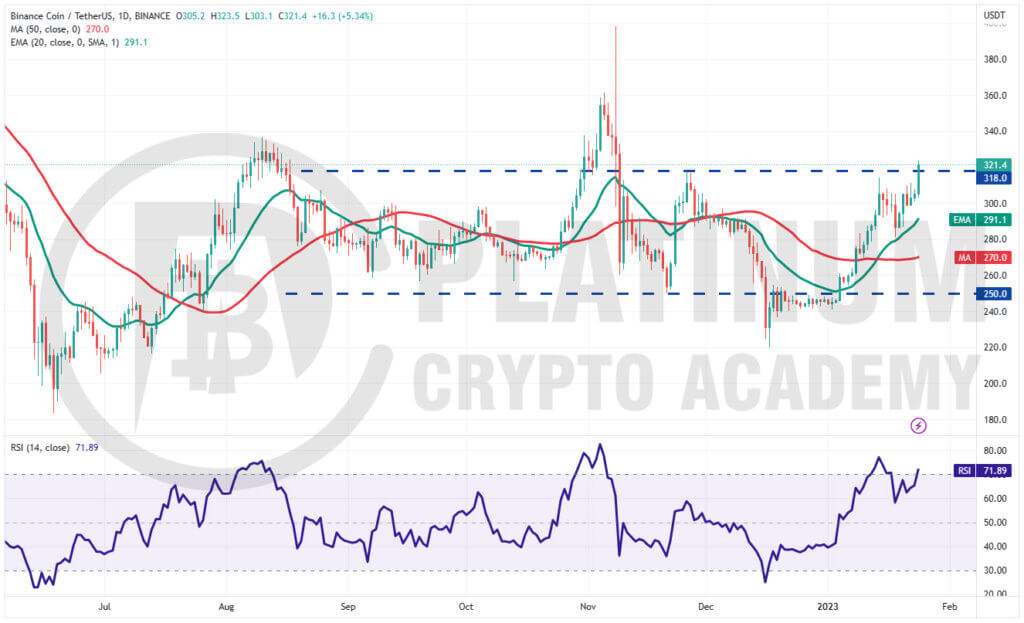
Binance Coin dropped to the 20-day EMA on January 18 but the bulls purchased this dip aggressively. This suggests that the trend remains positive and traders are buying on declines.
After a few days of hesitation, the bulls pushed the price above the overhead resistance of $318 on January 24. If buyers sustain the higher levels, the BNB/USD pair could soar to $360.
Another possibility is that the price fails to maintain above $318. This indicates that the bears remain active at higher levels. That could sink the price to the 20-day EMA.
The sellers will have to pull the price below this support to signal that the breakout above $318 may have been a bull trap. The pair could then remain stuck inside the range for a while longer.
XRP/USD Market Analysis
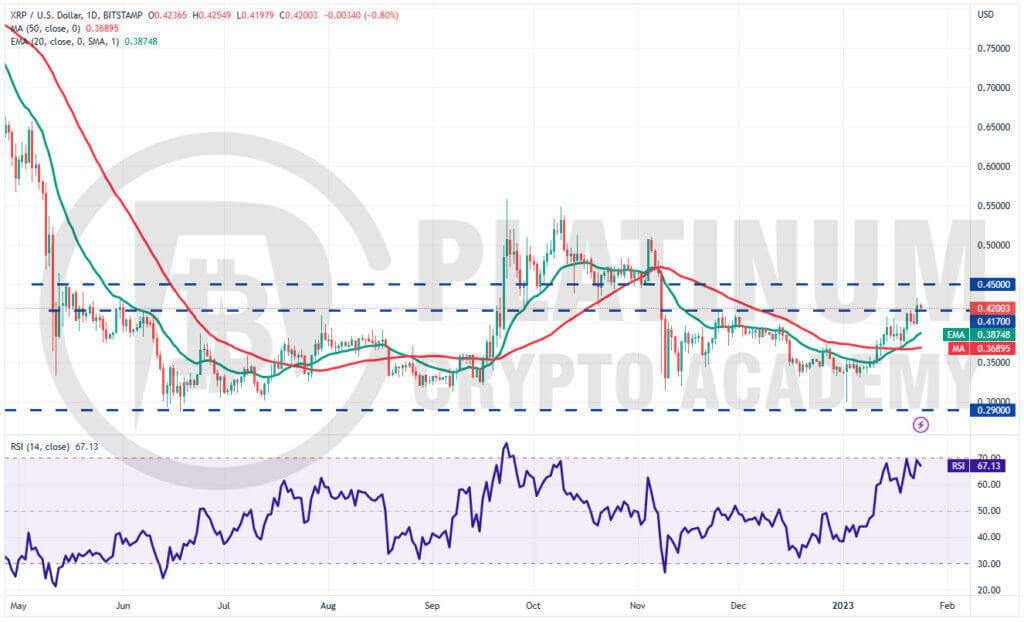
We suggested in the previous analysis that the bullish crossover on the moving averages indicates a slight edge to the bulls and that proved to be right.
Buyers purchased the drop to the 20-day EMA on January 18 and pushed XRP’s price to the overhead resistance at $0.41 on January 21. The bears again tried to defend the level but the buyers bulldozed their way above it on January 23.
The bears will try to yank the price back below the breakout level while the bulls will try to flip $0.41 into support.
If the price rebounds off the $0.40 support, the likelihood of a rally to $0.45 increases.
Conversely, if the price turns down and dives below the 20-day EMA, it could signal that the bears are back in the game. The XRP/USD pair could then drop to the 50-day simple moving average (SMA).
ADA/USD Market Analysis
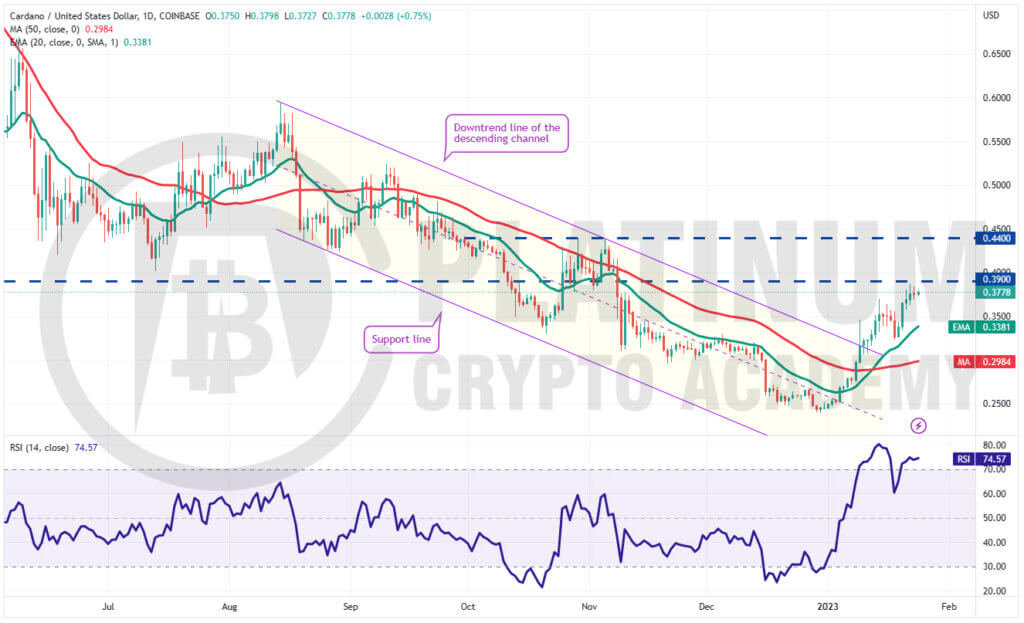
The bears tried to sink Cardano below the 20-day EMA on January 18 but the bulls held their ground. Buyers resumed their purchase on January 19 and propelled the price to the overhead resistance of $0.39 on January 22.
The bears are trying to protect this level but the bulls have not ceded ground, indicating that they expect the recovery to reach $0.44. The upsloping 20-day EMA and the RSI in the overbought territory indicate that buyers are in control.
However, if bulls fail to sustain the price above $0.39, it may tempt short-term traders to book profits. That could pull the price to the 20-day EMA.
This remains the key level to watch out for on the downside because a break and close below it could signal advantage to bears. The pair could then tumble to the 50-day SMA.
Hopefully, you have enjoyed today’s article for further coverage please check out our crypto Blog Page. Thanks for reading! Have a fantastic day! Live from the Platinum Crypto Trading Floor.
Earnings Disclaimer: The information you’ll find in this article is for educational purpose only. We make no promise or guarantee of income or earnings. You have to do some work, use your best judgement and perform due diligence before using the information in this article. Your success is still up to you. Nothing in this article is intended to be professional, legal, financial and/or accounting advice. Always seek competent advice from professionals in these matters. If you break the city or other local laws, we will not be held liable for any damages you incur.
