
Bitcoin ended April on a sombre note with a decline of more than 17%. Bitcoin was not the only asset class that faced drubbing in April, the Nasdaq Composite plunged 13.3% recording its worst monthly performance since October 2008. The S&P 500 had its worst performance since March 2020 as it fell 8.8%.
In the near term, Bitcoin price could swing in May 2022 and the markets will keenly watch the policy action of the US Federal Reserve. The Fed‘s two-day meeting will end on May 4 and the central bank is expected to hike rates by 50 basis points and outline plans to reduce its balance sheet. If the central bank springs any hawkish surprises, both the equity markets and crypto markets may witness a selloff in the short term.
“Sell in May and go away” is a popular stock market adage but that does not necessarily apply to the crypto markets. Data from on-chain monitoring resource Coinglass shows that Bitcoin price rallied more than 50% in 2017 and again in 2019. In 2021, the tide turned against the bulls and Bitcoin plummeted more than 35%. Considering the recent track record of Bitcoin in May, traders may expect a large move in either direction.
Bitcoin’s price are weakness this year has resulted in a sharp selloff in listed companies that hold Bitcoin on their balance sheet. Researcher Clara Medalie said companies such as Block, Tesla, MicroStrategy, and Coinbase were down between 20 to 50% while Bitcoin had declined 17% year-to-date.
During Berkshire Hathway’s annual shareholders’ meeting, Warren Buffet and Charlie Munger doubled down on their criticism of Bitcoin. Buffet said he would not buy all the Bitcoin in the world even if it was offered to him for $25 because according to him, it does not “produce anything” unlike rental property or farmland. Munger went a step ahead and said that Bitcoin is “still likely to go to zero.”
Could Bitcoin price and major altcoins prices start a recovery in the next few days or drop further? Read our analysis of the major cryptocurrencies to find out.
BTC/USD Market Analysis
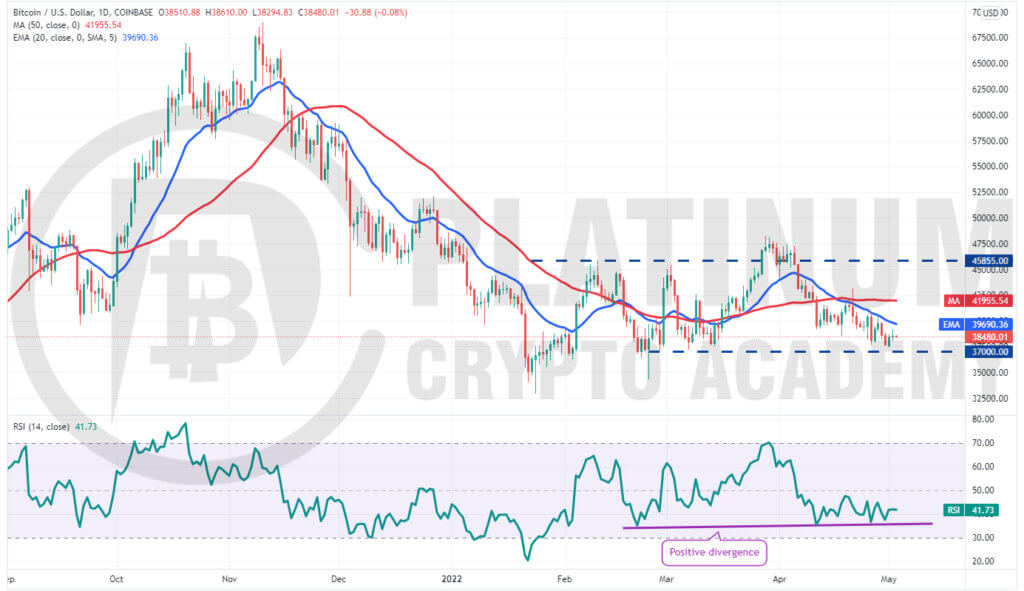
We had suggested in our previous analysis that the 20-day exponential moving average (EMA) will act as a resistance and that is what happened. Bitcoin price turned down from the 20-day EMA on April 28 and dropped near the strong support at $37,000 on May 1.
The bulls bought the dip but the recovery continues to face selling near the 20-day EMA. If bulls fail to clear this hurdle quickly, the possibility of a drop below $37,000 increases. If that happens, the selling could pick up momentum and the BTC/USD pair could plummet to $34,322 and later to $32,933.
While the downsloping 20-day EMA signals advantage to bears, the positive divergence on the relative strength index (RSI) suggests that the bearish momentum may be losing steam.
The first sign of strength will be a break and close above the 20-day EMA. If that happens, the pair could rally to the 50-day simple moving average (SMA) where the bears may again pose a stiff challenge. The bulls will have to clear this hurdle to indicate that the selling pressure has reduced.
ETH/USD Market Analysis
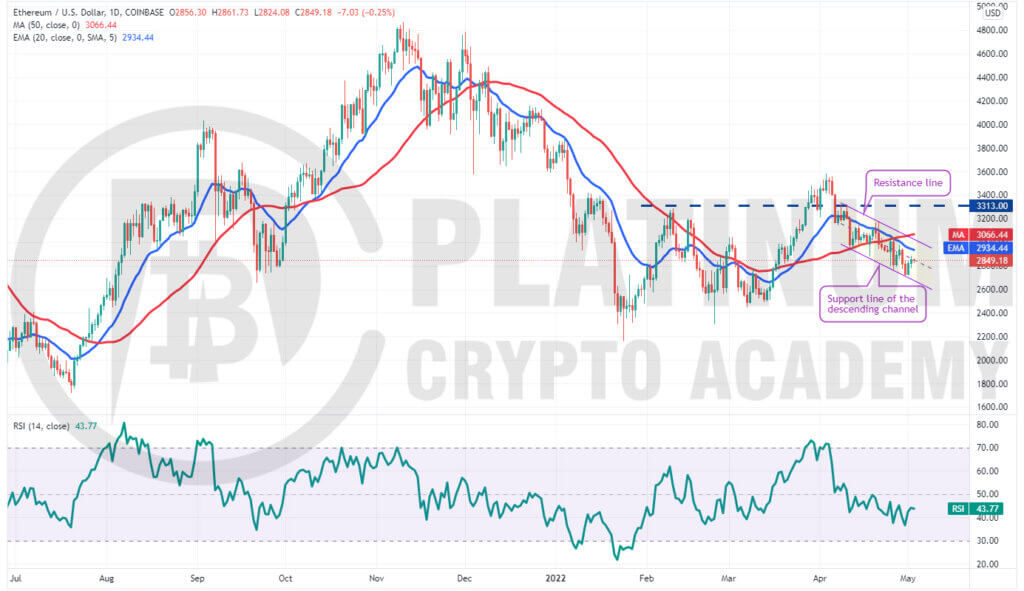
We had highlighted that Ether is trading inside a descending channel pattern and if the price turns down from the 20-day EMA, it may extend its stay inside the channel. That is what happened as the price turned down from the 20-day EMA on April 29 but bounced off the support line of the channel on May 1.
The buyers will once again attempt to push the price to the 20-day EMA and later to the resistance line of the channel. A break and close above the channel will suggest that the bulls are back in the game.
There is a minor hurdle at the 50-day SMA but if bulls overcome it, the ETH/USD pair could rally to $3,313.
Conversely, if the price once again turns down from the 20-day EMA, it will suggest that the sentiment remains negative and traders are selling on rallies. The bearish momentum could pick up if the price breaks below the channel. The pair could then decline to the strong support at $2,500.
BNB/USD Market Analysis
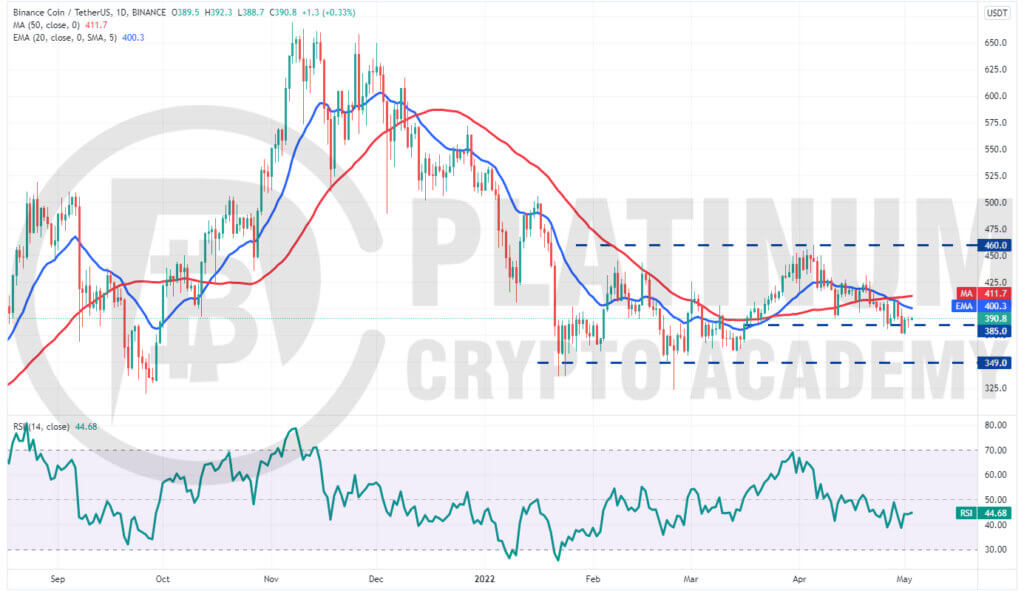
Binance Coin turned down from the 50-day SMA on April 29 and dropped below the strong support at $385 on April 30. However, the bears could not sustain the price at lower levels as the bulls purchased the dip aggressively and pushed the BNB/USD pair back above the breakdown level on May 1.
The bulls will have to push and sustain the price above the 50-day SMA to signal that the bears are losing their grip. The pair could then rise to $431.4 and later rally to the stiff overhead resistance at $460.
On the contrary, if the price turns down from the 20-day EMA, it will suggest that the sentiment remains negative and traders are selling on rallies.
The bears will then attempt to sink the pair below the May 1 intraday low of $375.50. If they succeed, the selling could accelerate and the pair may drop to the strong support at $349. The bulls are expected to defend this level aggressively because a failure to do so could resume the downtrend.
XRP/USD Market Analysis
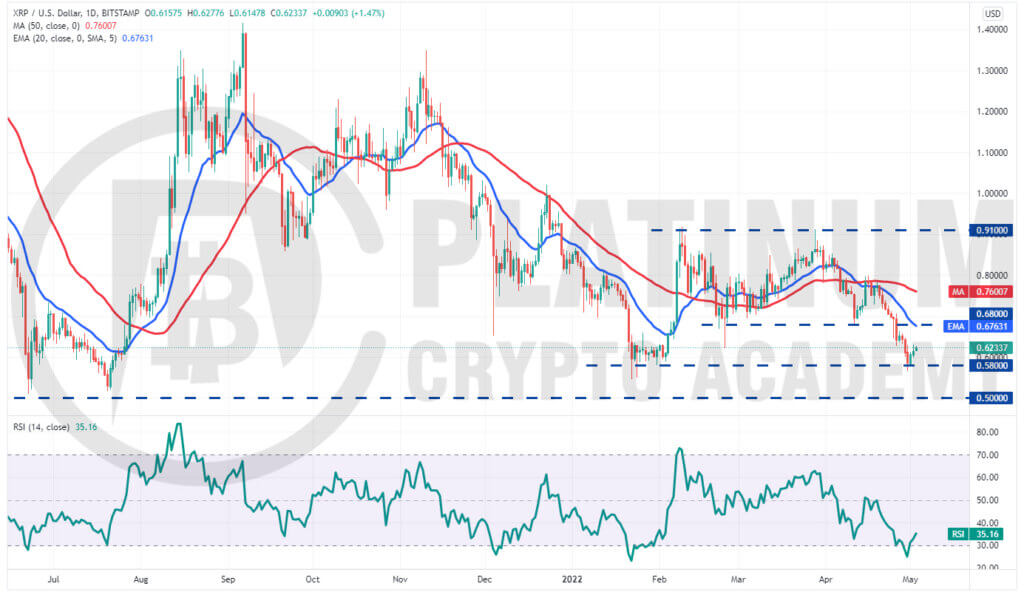
We had warned in our previous analysis that if buyers do not push the price above the 20-day EMA, XRP could plummet to $0.60 and that is what happened.
The XRP/USD pair broke and closed below the strong support at $0.68 on April 26 and dipped to an intraday low of $0.56 on April 30. The buyers are attempting to defend the level as seen from the rebound on May 1.
The recovery is likely to face strong selling at the 20-day EMA. If the price turns down from this resistance, the bears will attempt to sink the pair to the psychological support at $0.50.
Alternatively, a break and close above the break down level of $0.68 will suggest that the pair may remain stuck inside the large range between $0.91 and $0.58 for the next few days.
LUNA/USD Market Analysis
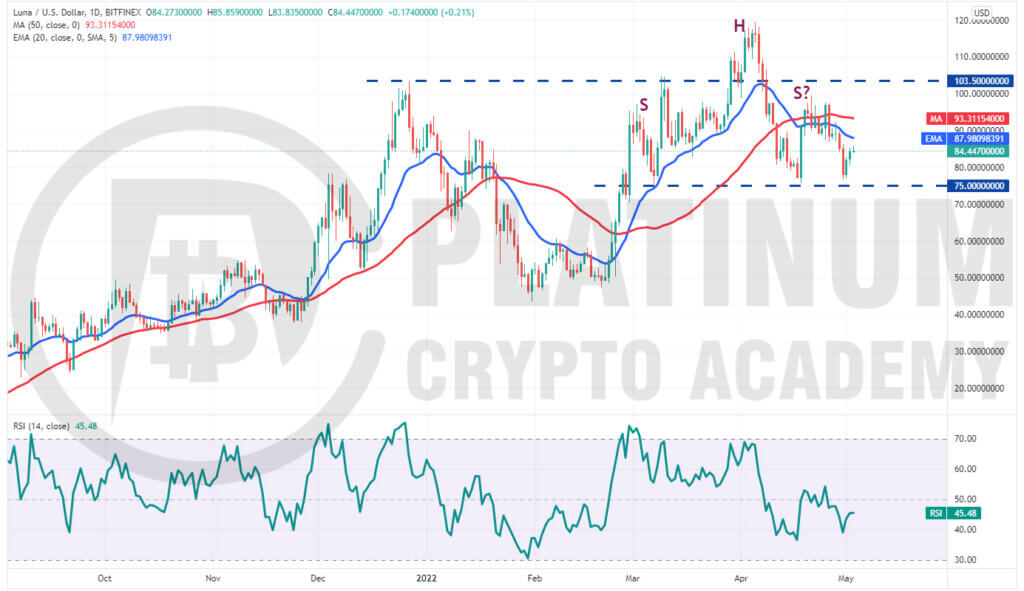
Terra’s LUNA token plunged near the strong support at $75 on April 30. The bulls purchased this dip and are attempting to push the price above the 20-day EMA.
If they succeed, the LUNA/USD pair could rise to the overhead resistance zone between $100 and $103.50. The bulls will have to clear this hurdle to gain the upper hand.
If the price turns down from the overhead zone, the pair may consolidate between $103.50 and $75 for a few more days.
Conversely, if the price turns down from the 20-day EMA, the bears will again try to pull the pair below $75. If they succeed, the pair will complete a bearish head and shoulders pattern.
This negative setup could result in aggressive selling, which could sink the pair to the psychological support at $50.
Hopefully, you have enjoyed today’s article for further coverage please check out our crypto Blog Page. Thanks for reading! Have a fantastic day! Live from the Platinum Crypto Trading Floor.
Earnings Disclaimer: The information you’ll find in this article is for educational purpose only. We make no promise or guarantee of income or earnings. You have to do some work, use your best judgement and perform due diligence before using the information in this article. Your success is still up to you. Nothing in this article is intended to be professional, legal, financial and/or accounting advice. Always seek competent advice from professionals in these matters. If you break the city or other local laws, we will not be held liable for any damages you incur.
