
The first half of 2022 has been brutal for the Bitcoin price, other cryptocurrencies and equity markets. Investors fled risky assets as the United States Federal Reserve commenced aggressive monetary tightening to control surging inflation and that stoked fears of a recession.
The S&P 500 plunged 20.6% in the first six months of the year, its worst performance since the first half of 1970. According to Fox Business, Nasdaq recorded its worst-ever performance in the first six months of the year with a drop of 29.5%.
The damage in the crypto markets was even harsher with Bitcoin plunging 56.2% in the second quarter, its sharpest quarterly fall since the 67% fall in the third quarter of 2011. A large part of the losses happened in June when Bitcoin shed 37.3%, its biggest monthly fall since 2011.
The collapse in the Terra ecosystem created a crisis in crypto lender Celsius and drove crypto hedge fund Three Arrows Capital to file for bankruptcy. Several other crypto lending platforms and exchanges are also rumoured to be under pressure. This has increased fears that some of them may go belly up and that has put a cap on any recovery efforts.
The massive deleveraging has removed a lot of froth from the crypto space and that could be a sign that the worst of the bear market may be behind us, according to JPMorgan strategist Nikolaos Panigirtzoglou. He added that the willingness of crypto firms coming forward to bail out struggling companies and steady inflows of venture capital funding in May and June are positives for the crypto markets.
In another morale booster to Bitcoin bulls, Deutsche Bank analysts Marion Laboure and Galina Pozdnyakova said in a recent report that Bitcoin could rise to $28,000 by the end of the year. According to the analysts, the crypto markets will be boosted by a strong recovery in the S&P 500 which could rise to its January levels.
Is the current fall a good buying opportunity or could the crypto markets fall further? Bitcoin price predicted a bounce back on its rally above $21,500 and $23,000 against the US Dollar. Read the full analysis on Bitcoin price movements today!
BTC/USD Market Analysis
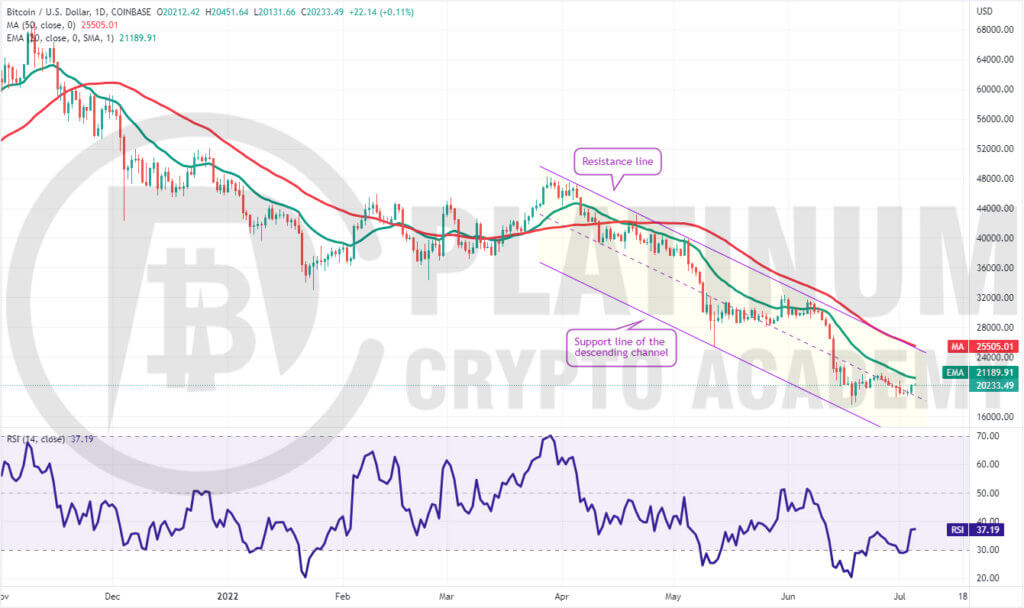
Bitcoin plunged below the immediate support at $19,500 but the bulls bought the dip near $18,500. The buyers successfully defended this level from June 30 to July 3 and that started a recovery on July 4.
The bulls will attempt to push the price above the 20-day exponential moving average (EMA). This is an important level to keep an eye on because a break and close above it will suggest that the bears may be losing their grip.
The critical level to watch on the downside is $19,500. If the price rebounds off this level with strength, it will suggest that bulls are attempting to form a higher low. The buyers will then make one more attempt to push the price above the 20-day EMA.
The BTC/USD pair could then attempt a rally to the resistance line of the descending channel. A break and close above this level could signal a potential change in trend.
Contrary to this assumption, if the price turns down from the 20-day EMA, it will suggest that the sentiment remains negative and traders are selling on rallies.
The bears will then again try to pull the price below $18,500 and challenge the critical support at $17,567.45. If this support cracks, the pair could resume the downtrend. The next support on the downside is $16,000 and then $14,000.
ETH/USD Market Analysis
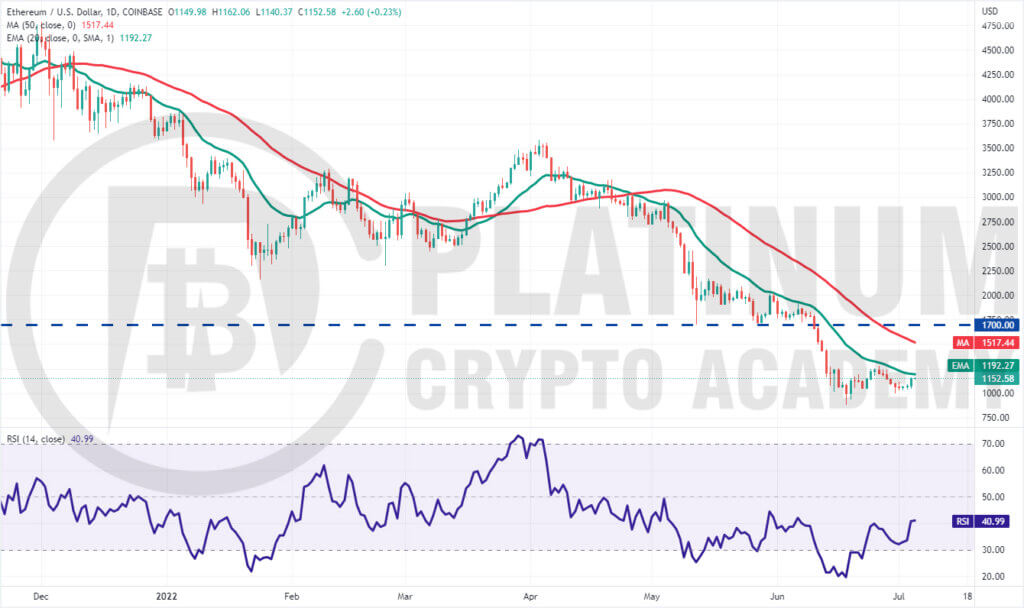
We had suggested in our previous analysis that $1,040 is the critical support to watch on the downside and that is where the pullback ended. Though the price dipped below the psychological level of $1,000 on June 30, the long tail on the day’s candlestick shows strong buying at lower levels.
Thereafter, the bulls did not allow the price to break below $1,025 and that started a recovery on July 4 which has reached the 20-day EMA. The bears are expected to defend this level aggressively.
If the price turns down from the current level, the ETH/USD pair could drop to $1,000. A break below this level could bring the vital support of $879.80 into play.
On the other hand, if buyers drive the price above the 20-day EMA, it will suggest that the downtrend may be ending. The pair could then rise to the 50-day simple moving average (SMA) and later to the breakdown level of $1,700.
BNB/USD Market Analysis
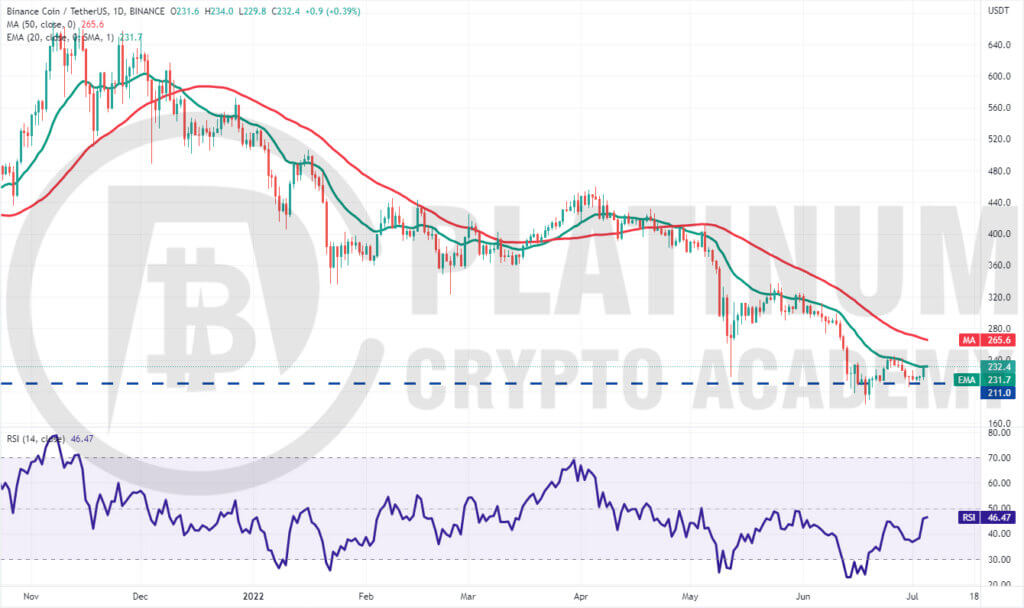
Binance Coin turned down from the 20-day EMA on June 28 and dipped below the strong support of $211 but the long tail on the day’s candlestick suggests that the bulls bought the dip aggressively. This implies that the buyers are attempting to form a higher low at $211.
The flattening 20-day EMA and the RSI just below the midpoint indicate that the selling pressure is reducing.
The BNB/USD pair rebounded sharply on July 4 and has reached the 20-day EMA. If buyers drive the price above this resistance, the pair could rally to the 50-day SMA. This level may again act as a resistance but if bulls overcome this barrier, the rally could extend to $300 and then to $325.
Contrary to this assumption, if the price fails to sustain above the 20-day EMA, it will suggest that bears are active at higher levels. A break below $211 could open the doors for a possible drop to $183.
XRP/USD Market Analysis
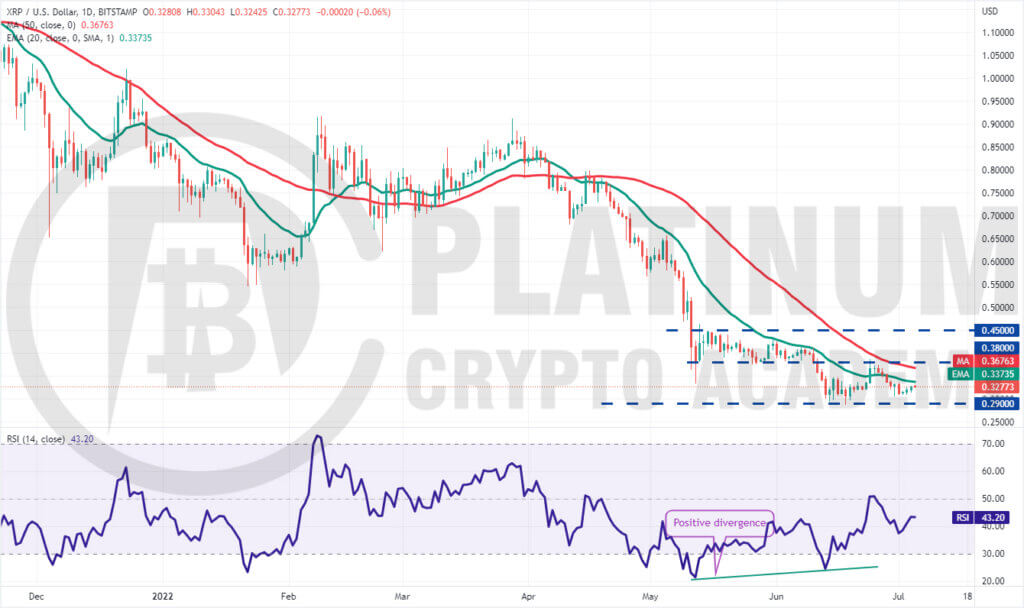
We suggested in our previous analysis that XRP may remain stuck between $0.29 and $0.38 and that is how it has been.
The buyers bought the dip to $0.31 and are attempting to start a relief rally. This effort could face a strong resistance at the 20-day EMA. If the price turns down from this level, it will indicate that bears are selling on minor rallies.
The bears will then make another attempt to sink the XRP/USD pair below $0.29. If they succeed, the pair could resume its downtrend. The next support is at $0.24.
On the contrary, if bulls thrust the price above the 20-day EMA, the pair may rise to the overhead resistance at $0.38. The bulls will have to clear this hurdle to gain the upper hand. Until then, the pair may continue to oscillate between $0.29 and $0.38.
ADA/USD Market Analysis
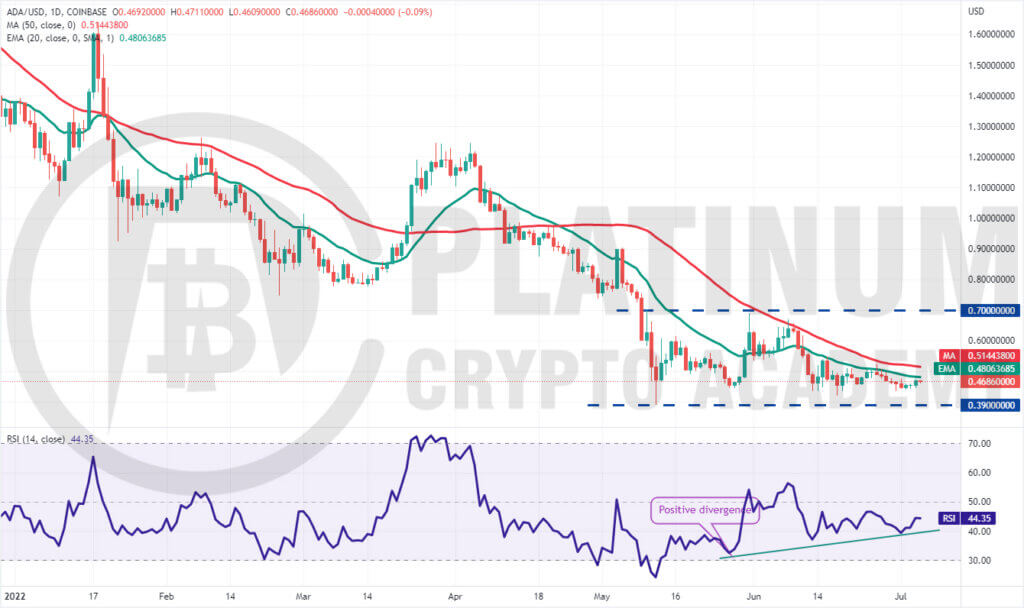
Cardano turned down from the 20-day EMA but a positive sign is that the bulls defended the immediate support at $0.43. This suggests that lower levels are attracting buying by the bulls.
Both moving averages are flattening out and the RSI is gradually rising toward the midpoint, indicating that the bears may be losing their grip.
The buyers will now make one more attempt to push the price above the moving averages. If they succeed, the bullish momentum could pick up and the pair may start its northward march toward $0.70.
This positive view could invalidate if the price turns down from the current level and breaks below $0.43. That could pull the pair toward the critical support at $0.39. A break and close below this level could indicate the start of the next leg of the downtrend.
Hopefully, you have enjoyed today’s article for further coverage please check out our crypto Blog Page. Thanks for reading! Have a fantastic day! Live from the Platinum Crypto Trading Floor.
Earnings Disclaimer: The information you’ll find in this article is for educational purpose only. We make no promise or guarantee of income or earnings. You have to do some work, use your best judgement and perform due diligence before using the information in this article. Your success is still up to you. Nothing in this article is intended to be professional, legal, financial and/or accounting advice. Always seek competent advice from professionals in these matters. If you break the city or other local laws, we will not be held liable for any damages you incur.
")