
The United States equities markets turned down sharply on August 19 after the minutes from the Federal Reserve’s July meeting showed that participants believed “that there was little evidence to date that inflation pressures were subsiding.” Additionally, Federal Reserve Bank of St. Louis President James Bullard said on August 18 that he favored another large rate hike in the September meeting as he did not believe that inflation had peaked.
This stoked fears that the Fed could continue with its aggressive rate hikes. The selling continued on August 22 as market participants speculated that Fed Chairman Jerome Powell may sound more hawkish during his speech on August 26 at the central banking conference in Jackson Hole.
The deteriorating macro environment and the close correlation with equities markets stalled the recovery in cryptocurrencies. Bitcoin witnessed a sharp drop on August 19 which resulted in liquidations of more than $551 million in a 24-hour period, according to data from crypto analytics platform Coinglass.
While the short-term investors may have been worried due to the recent volatile moves, the long-term investors have kept their calm and not panicked. Data from market intelligence firm Glassnode shows that Bitcoin supply that has been dormant in its wallets for five years or more has reached a new all-time high of 24.46%.
The uncertain macro environment has kept the institutional investors at bay. CoinShares Digital Asset Fund Flows Weekly Report shows that volumes for digital asset investment products last week plunged to $1 billion, which is the second lowest this year and 55% below the year average.
CoinShares chief strategy officer Meltem Demirors while speaking to CNBC said that Bitcoin has been witnessing buying on dips, indicating that money kept on the sidelines has been gradually accumulating at lower levels. However, she added that flows have been weak in August. She expects Bitcoin to remain flat through the third quarter due to no media upside catalyst.
Could Bitcoin and major altcoins drop to new lows or will buyers limit the damage? Read our analysis of the major cryptocurrencies to find out.
BTC/USD Market Analysis
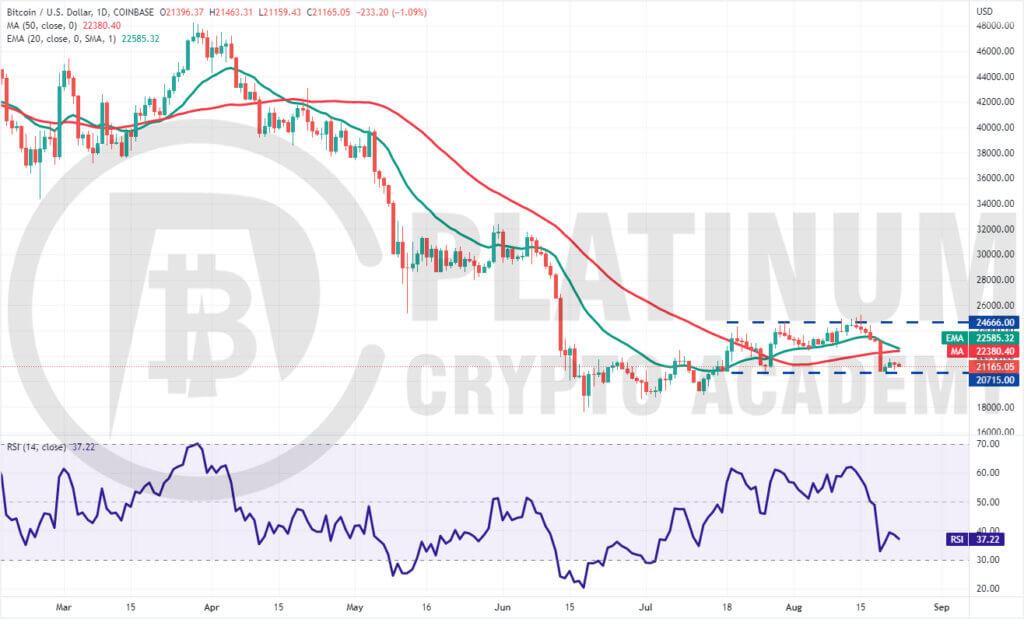
The bulls repeatedly pushed the price above the overhead resistance of $24,666 between August 13 to 15 but could not sustain the higher levels. The buyers again tried to clear the overhead hurdle on August 17 but the bears held their ground.
This may have tempted short-term traders to book profits. That pulled the price below the 20-day exponential moving average (EMA), which was the first sign that bulls may be losing their grip.
The selling momentum picked up on August 19 and the BTC/USD pair plunged to the strong support at $20,715. The bulls have successfully defended the level for the past three days but the shallow rebound suggests that demand dries up at higher levels.
The downsloping 20-day EMA and the relative strength index (RSI) in the negative territory indicate advantage to sellers. The bears will again attempt to sink the price below $20,715.
If they succeed, the pair could slide to the next support at $18,600. If this level also cracks, the decline could extend to the June 18 intraday low of $17,567.45.
The first sign of strength will be a break and close above the 20-day EMA. Such a move could open the doors for a possible rally to $24,666.
A buying opportunity could open for the aggressive traders above $21,800 with the stops placed just below $20,700.
ETH/USD Market Analysis
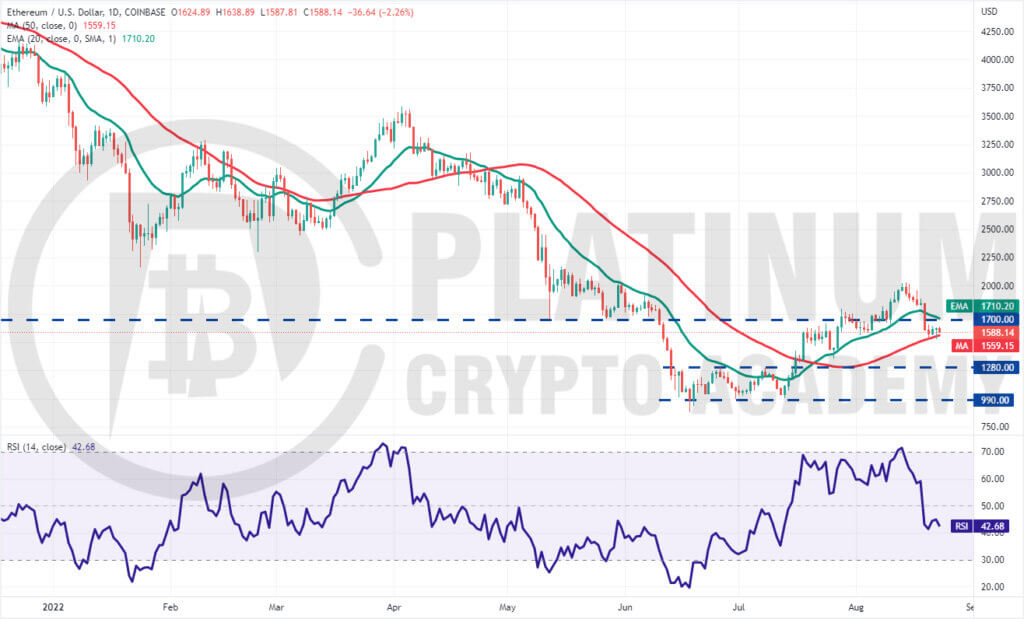
We had warned in our previous analysis that if bulls fail to defend the 20-day EMA and the breakout level of $1,700, Ether could plummet to the 50-day simple moving average (SMA) and that is what happened.
The ETH/USD pair plunged below $1,700 on August 19, signaling that the recovery was on a sticky wicket.
Although the bulls have defended the 50-day SMA for the past three days, they have failed to push the pair above $1,700. This indicates that the bears are trying to flip the $1,700 level into resistance.
If the price turns down and breaks below the 50-day SMA, the pair could extend its slide to the next major support at $1,280.
Contrary to this assumption, if the price turns up from the current level and breaks above $1,700, it will suggest strong accumulation at lower levels. That will increase the likelihood of a rally to $2,032. The buyers will have to clear this overhead hurdle to signal the resumption of the uptrend.
BNB/USD Market Analysis
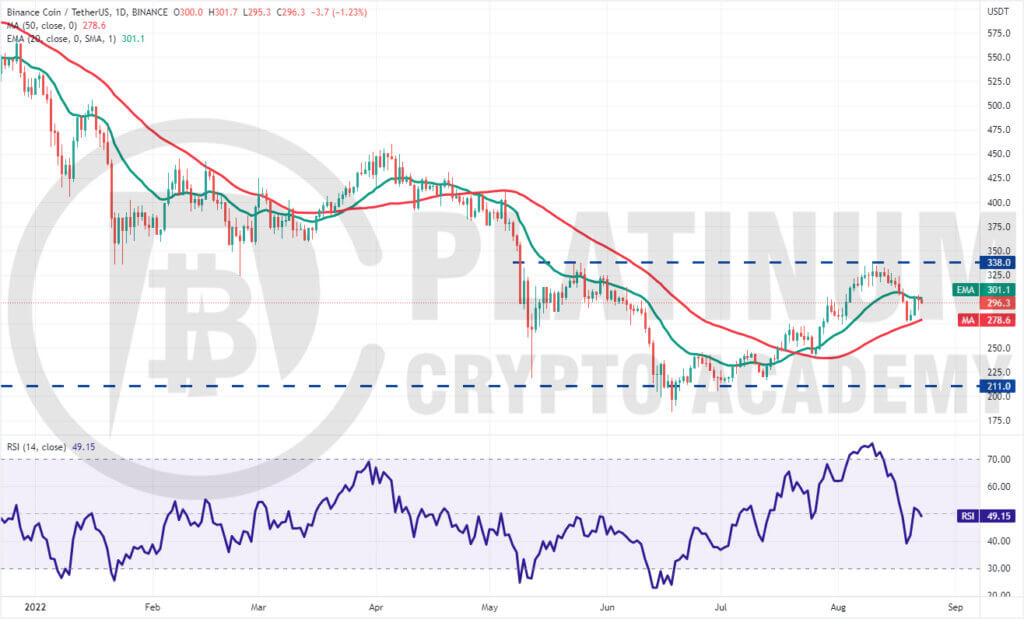
We said in our previous analysis that the failure to defend the 20-day EMA could pull the price to the 50-day SMA and that is what happened. Binance Coin dipped to the 50-day SMA on August 19 but started a rebound on August 20.
This is a positive indication as it shows that bulls are viewing the dips as a buying opportunity. The bears are posing a challenge at the 20-day EMA but the buyers have not given up much ground.
If bulls drive the price above the 20-day EMA, the BNB/USD pair could rise to the overhead resistance at $338. A break and close above this resistance could open the doors for a possible rally to $414 and then $460.
Conversely, if the price turns down from the 20-day EMA and breaks below the 50-day SMA, it will suggest that the pair could remain stuck inside the large range between $211 and $338 for some more time.
XRP/USD Market Analysis
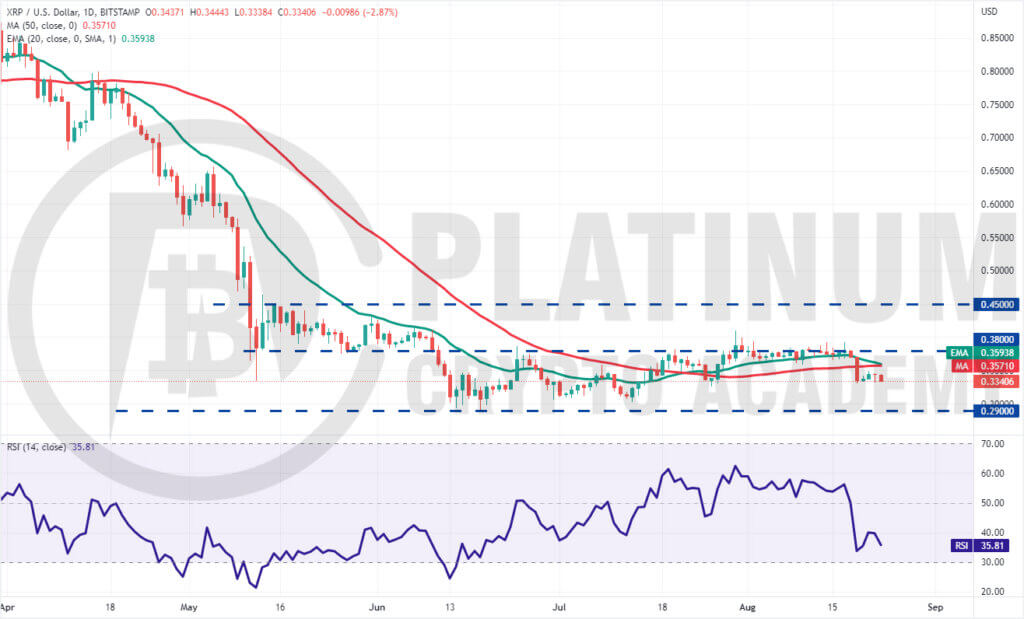
We suggested in our previous analysis that if bears sink the price below the 50-day SMA, XRP could slide to $0.32 and that is what happened.
XRP turned down from the overhead resistance of $0.38 on August 18 and broke below the 20-day EMA. This intensified the selling and the bears pulled the price below the 50-day SMA on August 19.
The bulls are attempting to defend the $0.33 level with vigor but they are facing stiff resistance from the bears near $0.35.
If bears sink the price below $0.32, the XRP/USD pair could plummet to the strong support at $0.29. This is an important level for the bulls to defend because if they fail to do that, the pair could resume its downtrend.
Conversely, if the price turns up from the current level and rises above the moving averages, the bulls will make another attempt to clear the overhead zone between $0.38 and $0.41.
ADA/USD Market Analysis
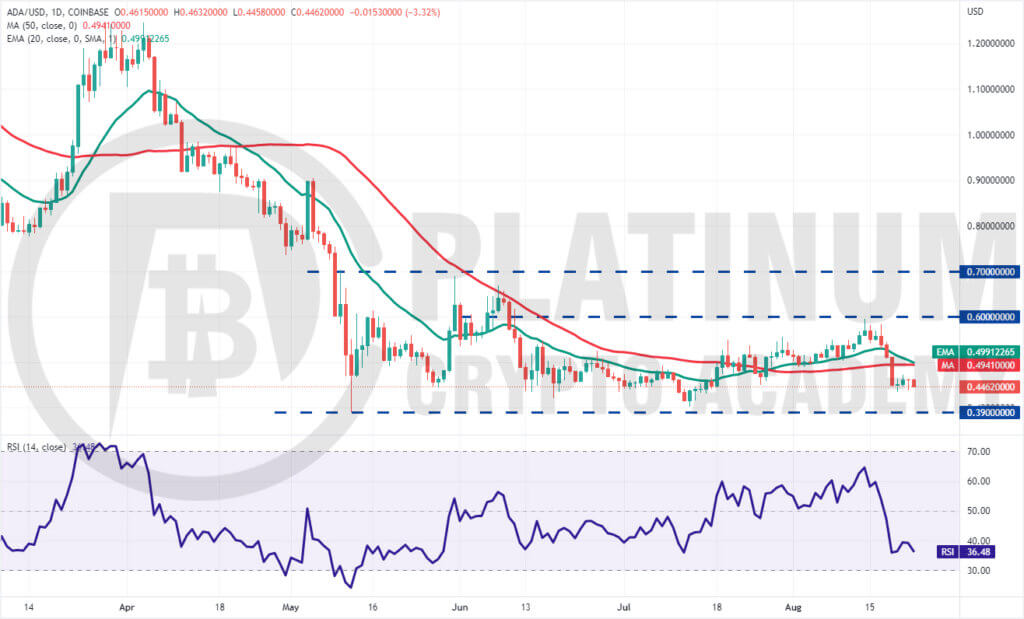
The bulls failed to push Cardano above $0.60 on August 17. This may have tempted short-term traders to book profits. The price broke below the 20-day EMA on August 18 and continued its downward journey on August 19.
The ADA/USD pair could extend its decline to the crucial support at $0.39. The bulls have defended this level on two previous occasions hence $0.39 is likely to act as a strong support.
A strong rebound off this level will suggest that the pair may remain range-bound between $0.39 and $0.60 for some more time.
If bears sink the price below $0.39, it will signal the start of the next leg of the downtrend. On the other hand, if buyers drive the price above $0.60, it will suggest that the pair may have bottomed out.
.
Hopefully, you have enjoyed today’s article for further coverage please check out our crypto Blog Page. Thanks for reading! Have a fantastic day! Live from the Platinum Crypto Trading Floor.
Earnings Disclaimer: The information you’ll find in this article is for educational purpose only. We make no promise or guarantee of income or earnings. You have to do some work, use your best judgement and perform due diligence before using the information in this article. Your success is still up to you. Nothing in this article is intended to be professional, legal, financial and/or accounting advice. Always seek competent advice from professionals in these matters. If you break the city or other local laws, we will not be held liable for any damages you incur.
