
Bitcoin’s price prediction giving signs on strong rally in the past two days has erased the losses for 2022. This has pushed the Crypto Fear and Greed Index into the “greed” territory. Interestingly, just a week back, the index was languishing in the “fear” zone. This shows how a few bullish days could change the investor sentiment quickly.
The institutional investors pumped $193 million into digital asset investment products last week, according to CoinShares Digital Asset Fund Flows Weekly Report. The inflows were the largest since mid-December of last year, signalling a return of bullish sentiment. Bitcoin price witnessed an inflow of $98 million while Solana saw record inflows of $87 million.
On-chain analytics firm IntoTheBlock recently tweeted that “the balance held by hodlers – addresses holding >1year, is currently at ath (all-time high). Hodlers increased their positions by 17% since late November. These addresses remained unfazed and accumulated throughout Q1 of 2022.”
Along with increased institutional interest, the purchase by the Luna Foundation may also have boosted sentiment. Do Kwon, the co-founder and chief executive officer of the firm behind the Terra blockchain, said to Bloomberg that it had purchased more than $1 billion in Bitcoin, with the latest purchase of about $135 million done on Monday.
It is not only Bitcoin’s price prediction, even Ether is seeing renewed interest among investors in anticipation of its transition from proof-of-work to proof-of-stake. Google Trends data showed a peak value of 100 for the “Ethereum Merge” query.
The Ether whales have been accumulating in the past few days. Data from crypto intelligence firm Santiment shows that the number of Ethereum whales holding more than 10,000 Ether has risen to its highest level since December 2021.
What will Bitcoin be worth by 2022 on the current Bitcoin price prediction? Could Bitcoin and the altcoins continue their bull run? What do the charts project? Read our analysis of the major cryptocurrencies to find out.
BTC/USD Market Analysis
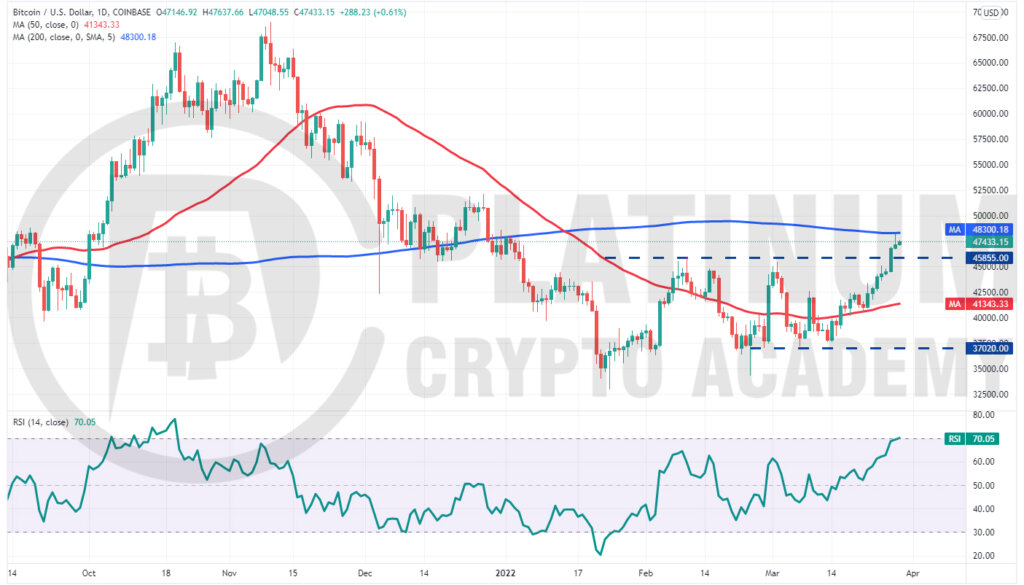
We said in our previous analysis that $45,855 may act as resistance but if bulls push the price above it, the rally could reach the 200-day simple moving average (SMA) and that is how it happened.
The long wick on March 28 candlestick shows that bears are attempting to stall the rally at the 200-day SMA. If the price turns down from this level but does not drop below $45,855, it will suggest that the previous resistance has turned into support. This increases the possibility of a break above the 200-day SMA.
If that happens, the BTC/USD pair could start its rally to $52,000 where the bears may again mount a strong defence.
If the price turns down from the 200-day SMA and plummets below $45,855, it will suggest that the short-term traders who may have purchased at lower levels are closing their positions. That could open the doors for a possible drop to $42,500.
If that happens, the pair may remain range-bound between the moving averages for a few days.
ETH/USD Market Analysis
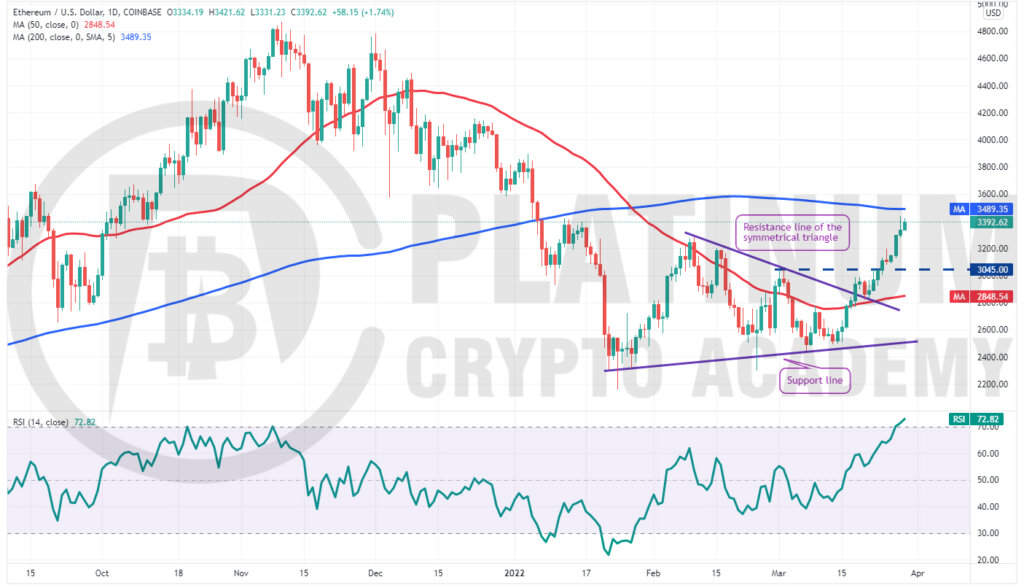
We projected Ether to reach the 200-day SMA in our previous analysis and that happened on March 28. The long wick on the day’s candlestick suggests that bears are trying to defend this level.
If the price turns down from the 200-day SMA, the ETH/USD pair could drop to the strong support at $3,045. If the price rebounds off this level, the bulls will again try to push the pair above the overhead resistance.
If they succeed, the pair could embark on a northward journey to the psychological level at $4,000.
However, the relative strength index (RSI) has jumped into the overbought zone, indicating a minor correction or consolidation in the near term. If the price turns down sharply from the 200-day SMA, the pair could remain range-bound for a few days.
The bears will have to sink and sustain the price below $3,045 to suggest that the bullish momentum has weakened.
BNB/USD Market Analysis
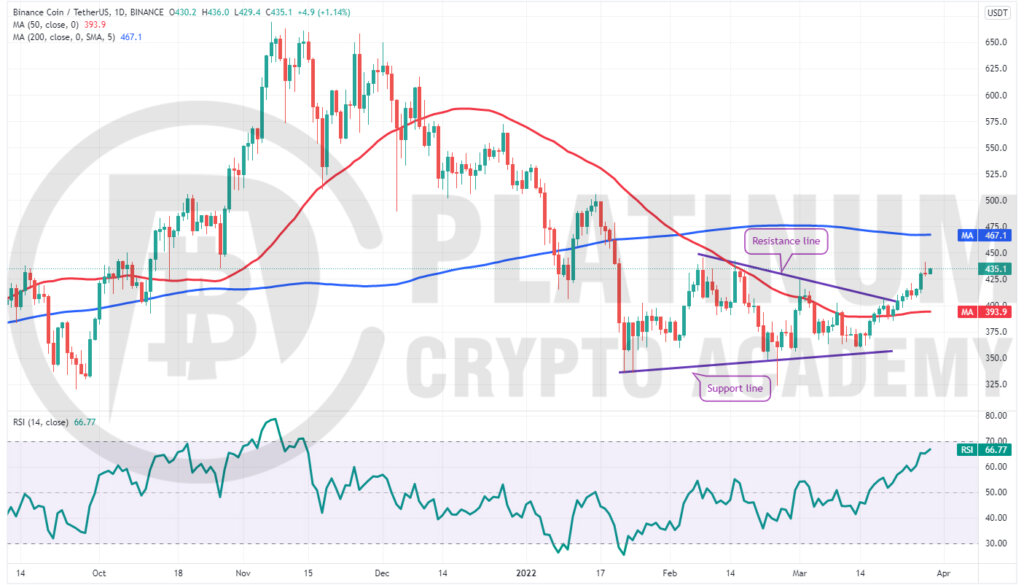
We suggested traders turn positive on a breakout from the triangle and that proved to be the right thing to do.
Binance Coin broke and closed above the resistance line of the triangle on March 23 and has continued to move up since then. The BNB/USD pair formed a shooting star candlestick pattern on March 28, indicating that bears are attempting to stall the recovery.
If bulls do not give up much ground and push the price above the overhead resistance at $450, the pair could rally to the 200-day SMA. This level is likely to act as a strong resistance.
If the price turns down from the current level or the overhead resistance, the bears will try to pull the pair to the 50-day SMA. If they succeed, it will suggest that the bullish momentum has weakened. The price could then consolidate between the moving averages for a few days.
XRP/USD Market Analysis
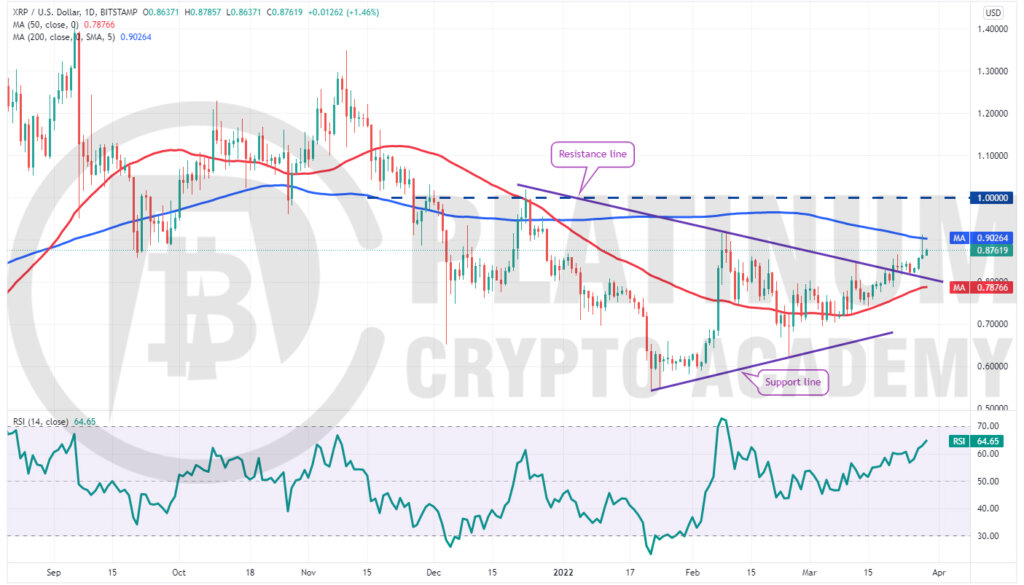
We said in our previous analysis that XRP is likely to face strong resistance at the 200-day SMA and that is what happened on March 28. The long wick on the day’s candlestick indicates that bears are defending the level with vigour.
However, if bulls do not allow the price to slip below the breakout level, it will suggest that traders are buying on dips. That will enhance the prospects of a break above the 200-day SMA.
If that happens, the XRP/USD pair could extend its rally to the psychological level at $1. This level is likely to act as a strong resistance but if bulls flip the 200-day SMA into support, the uptrend could continue.
The critical support to watch on the downside is the 50-day SMA. If the bears sink and sustain the price below this level, it will suggest that the recent break above the triangle may have been a bull trap.
LUNA/USD Market Analysis
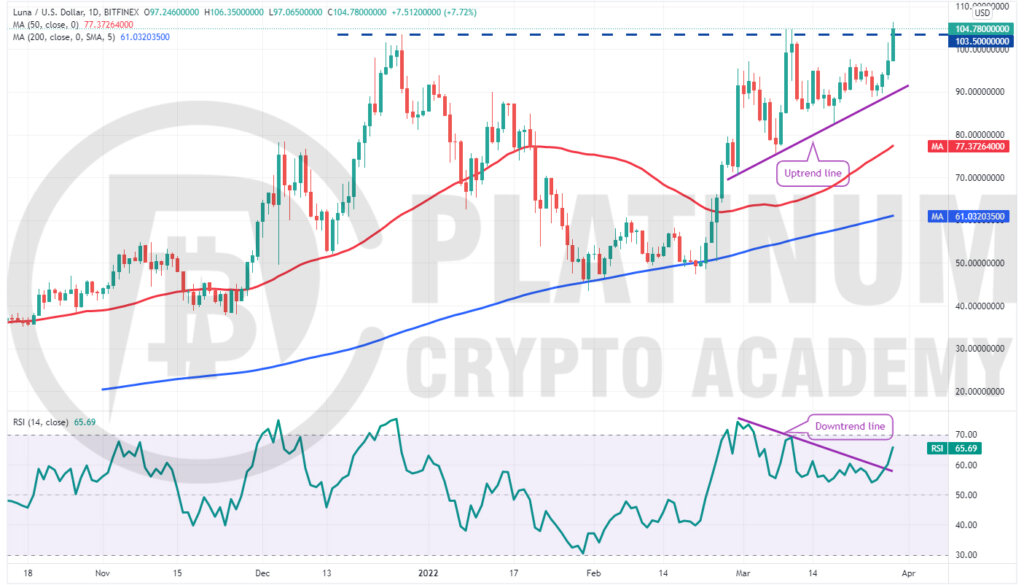
Terra’s LUNA token bounced off the uptrend line on March 26 and the RSI broke above the downtrend line, indicating that the bulls are back in the game.
Although the long wick on the March 28 candlestick indicates selling near the all-time high, the bulls did not waste time and resumed their purchase today. The buyers have pushed the price above the previous all-time high at $104.73.
If buyers sustain the price above $105, the bullish momentum could pick up further and the LUNA/USD pair could rally to $115 and thereafter to $125.
The rising 50-day SMA and the RSI in the positive territory suggest that the path of least resistance is to the upside.
Contrary to this assumption, if the price fails to close above $105, the bears will try to pull the price below the uptrend line and trap the aggressive bulls. If they manage to do that, the pair could enter a deep correction.
Hopefully, you have enjoyed today’s article for further coverage please check out our crypto Blog Page. Thanks for reading! Have a fantastic day! Live from the Platinum Crypto Trading Floor.
Earnings Disclaimer: The information you’ll find in this article is for educational purpose only. We make no promise or guarantee of income or earnings. You have to do some work, use your best judgement and perform due diligence before using the information in this article. Your success is still up to you. Nothing in this article is intended to be professional, legal, financial and/or accounting advice. Always seek competent advice from professionals in these matters. If you break the city or other local laws, we will not be held liable for any damages you incur.
