
Bitcoin briefly hit $25,000 and Ether $2,000 in the past week, signalling that the crypto recovery remains intact. Risky assets received a boost after the United States consumer price index cooled to 8.5% in July from a year ago, below economists expectations of 8.7%. This raised hopes that inflation may have peaked and the Federal Reserve may slow down its aggressive pace of rate hikes.
In another positive news, the world’s largest asset manager, BlackRock Inc. said it will offer its first ever investment product that gives institutional clients direct exposure to Bitcoin. The company said in a statement that it was “seeing substantial interest from some institutional clients” despite the sharp downturn in crypto prices.
Mike Novogratz, CEO of Galaxy Investment Partners, in an interview with CNBC, said that the forced deleveraging in the crypto space was over and the markets may have hit an equilibrium. He said that Bitcoin “remains a really good macro asset for an environment where the macro is pretty uncertain.” Novogratz added that Ethereum’s upcoming Merge in September could be a major catalyst that may generate enthusiasm among investors.
The Goerli testnet successfully shifted to the proof-of-stake consensus mechanism on August 11, increasing confidence that Ethereum’s Merge will finally happen in September. Ethereum co-founder Vitalik Buterin tweeted on August 12 that the terminal total difficulty was set to 58750000000000000000000. And according to bordel.wtf, the Merge is expected to happen around September 15.
Ether has been outperforming Bitcoin in the recent recovery as investors buy in anticipation of the Merge. According to coinmarketcap data, Ether’s market dominance has risen above 20% while Bitcoin has been losing ground and its market dominance is down to 40%.
Glassnode said in its “The Week Onchain Newsletter” on August 8 that investors seem to be using call options to “bet on the Ether price into September” but the futures and options backwardation suggests that the news may be sold into.
Could Bitcoin and major altcoins attract buyers at lower levels? Read our analysis of the major cryptocurrencies to find out.
BTC/USD Market Analysis
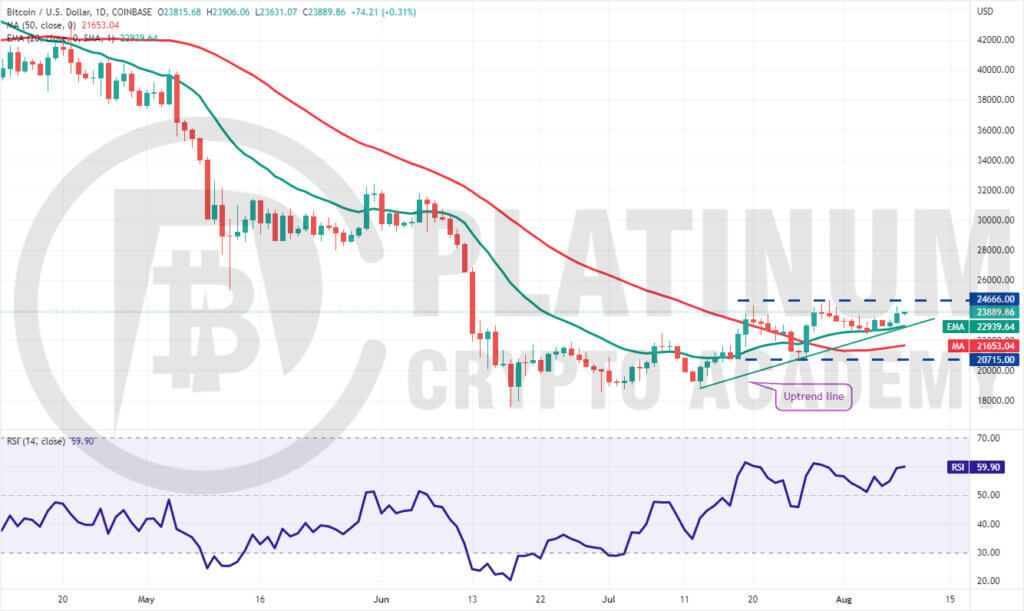
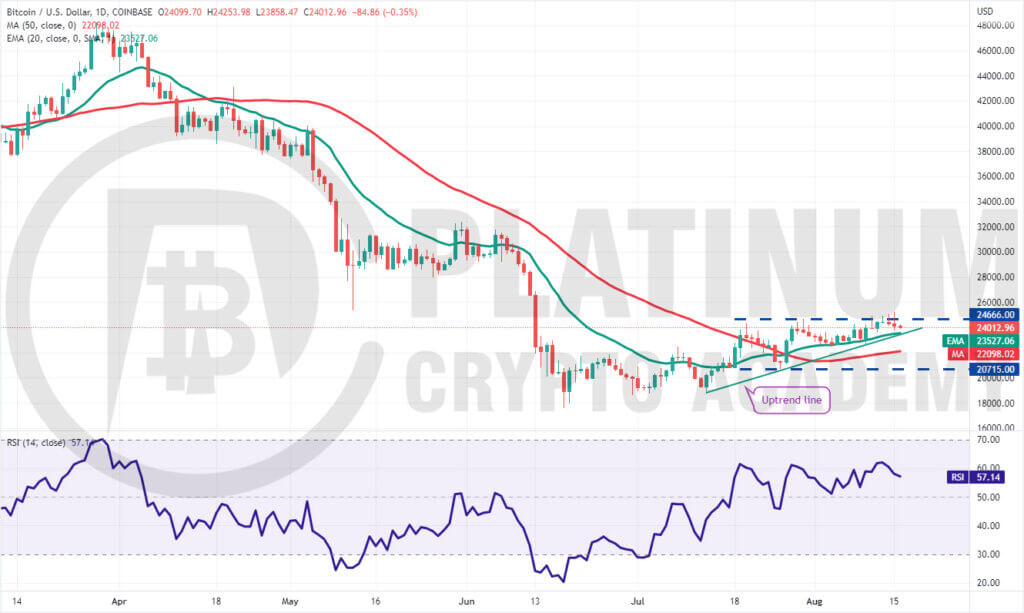
The bulls repeatedly pushed Bitcoin above the overhead resistance at $24,666 last week but they could not sustain the higher levels. This suggests that the bears are aggressively defending this level.
However, a minor positive is that the bulls have not given up much ground. This suggests that the traders are not rushing to the exit as they expect the up-move to continue.
The upsloping 20-day exponential moving average (EMA) and the relative strength index (RSI) in the positive territory suggest that the path of least resistance is to the upside.
If buyers sustain the price above $24,666, the bullish momentum could pick up and the BTC/USD pair could rally to $28,000. This level may again act as a major hurdle but if bulls push the price above it, the rally could reach $32,000. The first sign of weakness will be a break and close below the 20-day EMA. Such a move will indicate that the short-term traders may be booking profits. That could pull the price down to the 50-day simple moving average (SMA). This level is likely to attract buyers
ETH/USD Market Analysis
Ether reached $2,000 last week as we had projected in our previous analysis. However, this level acted as a major hurdle and short-term traders may have been tempted to book profits.
The price could retrace to the strong support zone between the 20-day EMA and $1,700. If the price rebounds off this zone, it will suggest that the sentiment has turned positive and traders are buying on dips. That will increase the possibility of the resumption of the up-move.
The rising moving averages and the RSI in the positive territory indicate that bulls have the upper hand.
If buyers drive the price above $2,032, the ETH/USD pair could rally to $2,220. This level may again act as a barrier but if bulls overcome it, the next stop could be $2,450.
This positive move could invalidate in the short term if the price breaks below $1,700. Such a move will indicate aggressive profit-booking by traders. That could sink the pair to the 50-day SMA.
BNB/USD Market Analysis
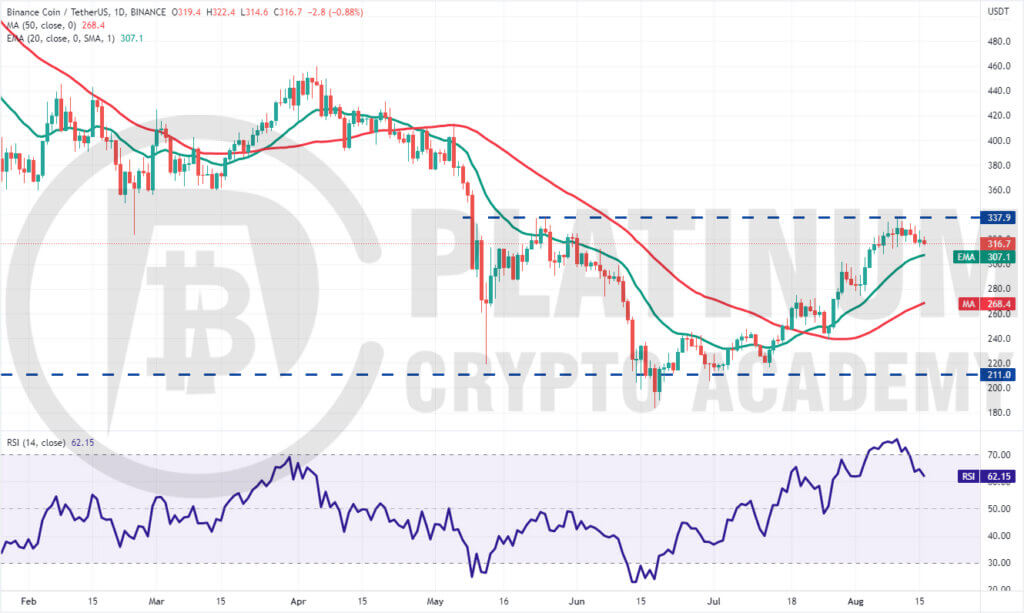
We mentioned in our previous analysis that the RSI had risen into the overbought zone and a minor correction or consolidation was possible and that is what happened.
Binance Coin turned down from the overhead resistance at $338 and is nearing the 20-day EMA. This is an important level for the bulls to defend if they want to keep the up-move intact.
The upsloping moving averages and the RSI in the positive territory indicate advantage to buyers.
If the price rebounds off the 20-day EMA with strength, it will improve the prospects of a break above $338. If that happens, the BNB/USD pair could pick up momentum and rally to $400 and then to $414.
Conversely, if the price slips below the 20-day EMA, short-term traders may book profits and that could pull the pair to the 50-day SMA. Such a move could delay the start of the next leg of the up-move.
XRP/USD Market Analysis
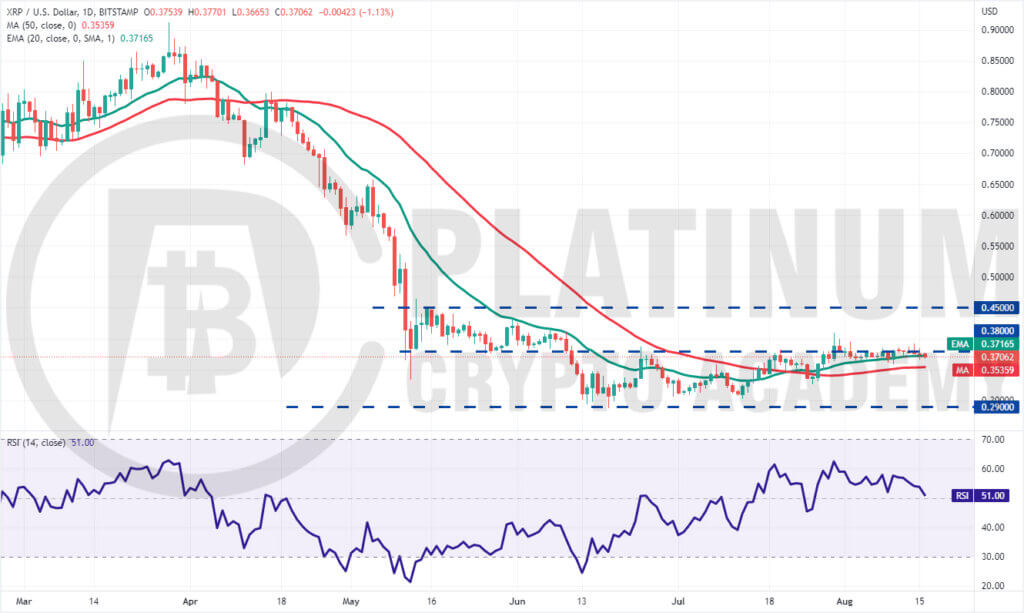
The bulls attempted to propel XRP above the $0.38 to $0.41 resistance zone on August 14 but the bears held their ground. The sellers are now attempting to sink the price below the 20-day EMA.
If they succeed, the XRP/USD pair may decline to the 50-day SMA. This level is likely to attract strong buying from the bulls. A sharp rebound off this support could keep the pair range-bound between the 50-day SMA and $0.41 for a few days.
The flattish moving averages and the RSI near the midpoint also indicate a range formation in the near term.
The bears will have to sink the pair below the 50-day SMA to gain the upper hand. If they do that, the pair could gradually slip to $0.32 and then to $0.29.
On the contrary, if the price rebounds off the current level and breaks above $0.41, it will tilt the advantage in favour of the buyers. The pair could then rally to $0.45 which may act as a strong hurdle. The bulls will have to overcome this barrier to signal a potential trend change.
ADA/USD Market Analysis
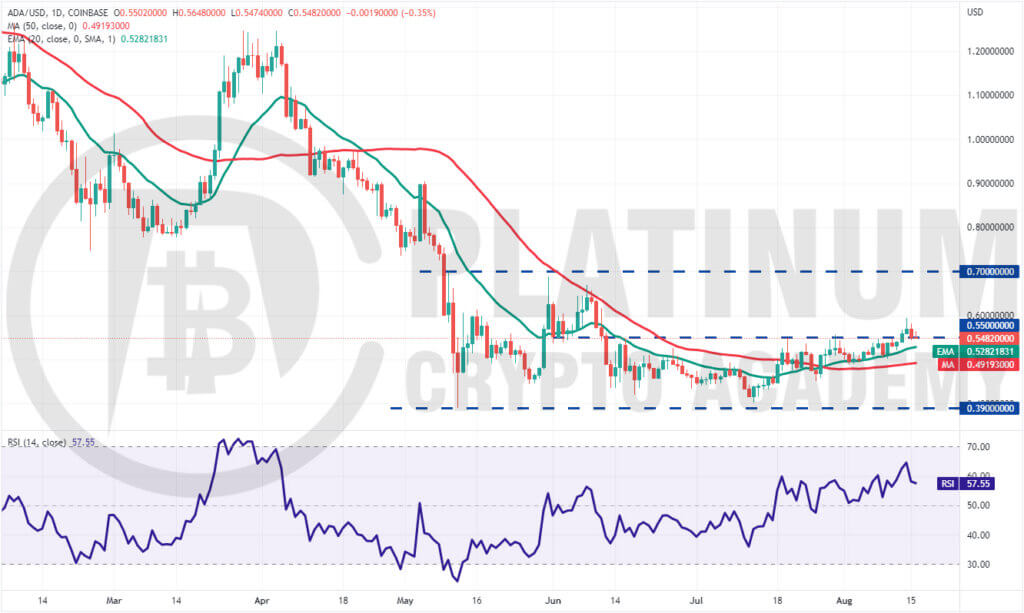
Cardano rose above the overhead resistance at $0.55 on August 13, indicating that the bulls had overpowered the bears. However, the ADA/USD pair could not reach $0.67 as we had expected.
The bears posed a strong challenge near $0.60 which pulled the price back to the breakout level of $0.55. The buyers are likely to defend the zone between the 20-day EMA and $0.55.
If the price bounces off this zone, the bulls will make one more attempt to push the pair to $0.67 and then to $0.70. This level could invite strong selling by the bears.
The upsloping 20-day EMA and the RSI in the positive zone indicate a slight advantage to the bulls.
To invalidate this positive view, the bears will have to sink the pair below the 50-day SMA. If that happens, it will suggest that the recent break above $0.55 may have been a bull trap.
.
Hopefully, you have enjoyed today’s article for further coverage please check out our crypto Blog Page. Thanks for reading! Have a fantastic day! Live from the Platinum Crypto Trading Floor.
Earnings Disclaimer: The information you’ll find in this article is for educational purpose only. We make no promise or guarantee of income or earnings. You have to do some work, use your best judgement and perform due diligence before using the information in this article. Your success is still up to you. Nothing in this article is intended to be professional, legal, financial and/or accounting advice. Always seek competent advice from professionals in these matters. If you break the city or other local laws, we will not be held liable for any damages you incur.
