
Bitcoin dropped close to $38,000 on April 25 but made a sharp reversal from the intraday lows, taking clues from the US equity markets which also made a strong recovery. This shows that the tight correlation between Bitcoin and the Nasdaq (NDX) remains intact.
This could be a cause for concern to the crypto investors because some equity analysts anticipate Nasdaq to correct sharply. Veteran trader Peter Brandt tweeted a chart of the Nasdaq 100 index and highlighted similarities between the current chart structure and the one that formed just before the dotcom crash.
The weak performance of cryptocurrencies in 2022 and their tight correlation with US equity markets has resulted in sharp withdrawal from crypto exchange-traded funds. According to UBS analysis, crypto-ETFs witnessed outflows of $417 million in April, the largest on record.
Google Trends data has shown that worldwide searches for Bitcoin have fallen off the cliff compared to May 2021 readings. This suggests that the retail interest in Bitcoin may be waning.
According to Arcane Research, Bitcoin’s 30-day volatility plunged to 2.2% in the last week, its lowest level since November 5, 2020. Due to the uncertainty and the weakness in the crypto markets, traders seem to be sitting on their hands. Kaiko Research’s latest weekly newsletter highlighted that Bitcoin and Ether’s weekly trading volumes on centralised exchanges declined to their lowest levels since June 2021.
Among all the gloomy reports, there is a silver lining. The long-term investors of Bitcoin have not panicked during the current fall and have held onto their positions. This shows that their conviction in the long-term story of Bitcoin remains intact. Economist Jan Wuestenfeld recently tweeted referring to Glassnode data that the “percentage of the Bitcoin supply last active 1+ years ago just crossed 64% for the first time ever.”
Could Bitcoin price will be rise and major altcoins start a strong recovery in the next few days? Or we can assume it as a bull trap? Read our analysis of the major cryptocurrencies to find out.
BTC/USD Market Analysis
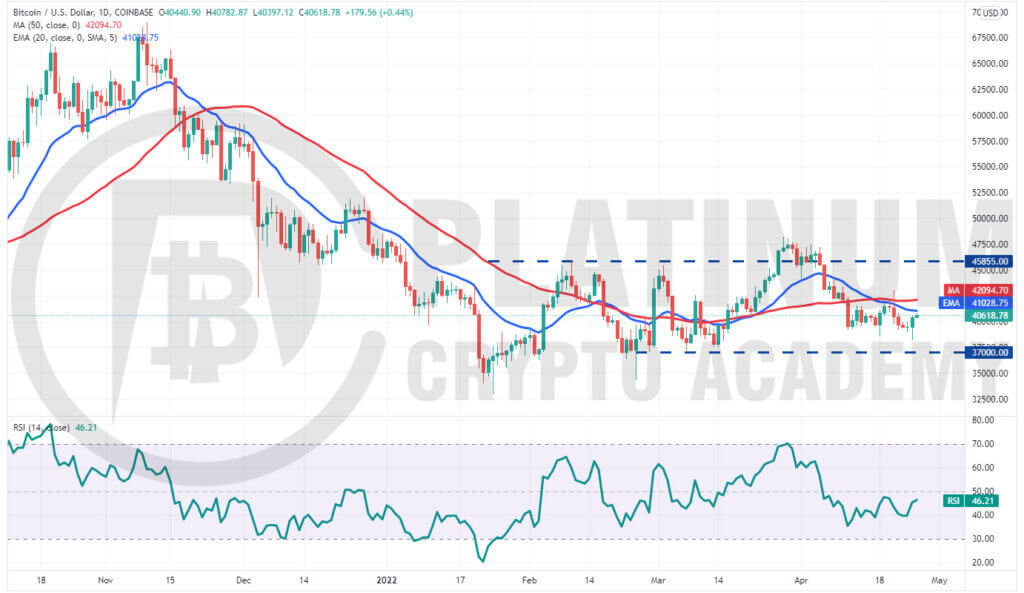
We had suggested in our previous analysis that bulls will aggressively defend the strong support at $37,000 and that is what happened on April 25. Strong buying at lower levels lead to a sharp recovery in Bitcoin from $38,210.
The BTC/USD pair has reached the 20-day exponential moving average (EMA), which is likely to act as a resistance. If the price turns down sharply from the current level, it will increase the possibility of a drop to $37,000.
This is an important level to watch out for because a break and close below it could intensify selling and the pair may plummet to $32,933.
Contrary to this assumption, if buyers drive the price above the 50-day simple moving average (SMA), the bullish momentum could pick up and the pair may rally to the overhead resistance zone between $45,855 and $48,240. The bears are likely to mount a strong defence in this zone.
Until Bitcoin breaks above $48,240 or plummets below $32,933, volatile random range-bound action is likely to continue.
ETH/USD Market Analysis
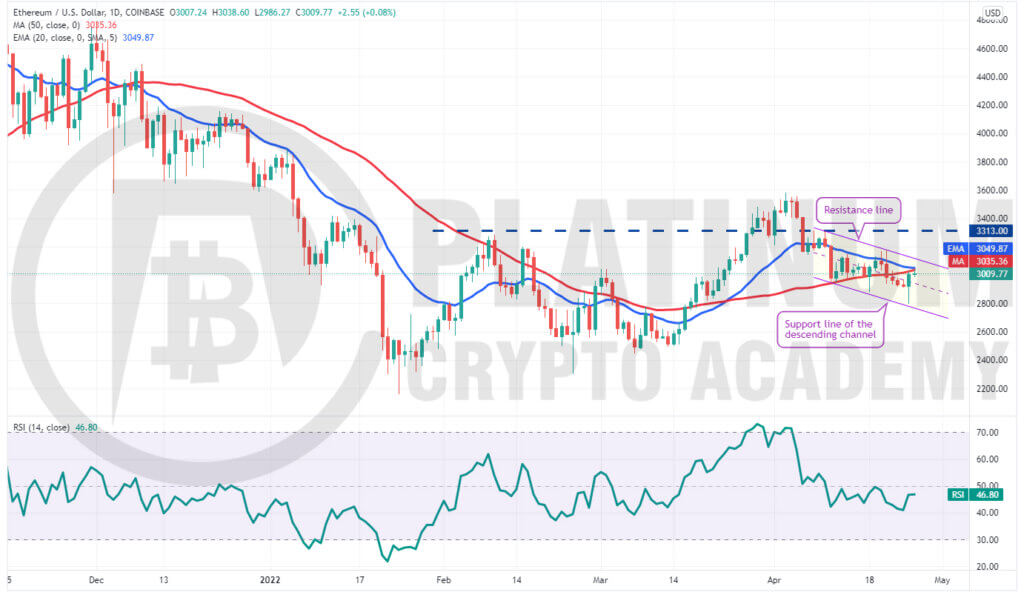
The bulls tried to push Ether above the 20-day EMA on April 20 and 21 but could not sustain the higher levels. This may have attracted selling by the short-term bears who pulled the price below the 50-day SMA.
The bears tried to gain the upper hand by sinking the ETH/USD pair below the $2,880 support but the bulls had other plans. They aggressively purchased the dip near $2,797 resulting in a strong recovery on April 25.
If bulls drive the price above the 20-day EMA, the pair could rise to the resistance line of the descending channel. A break and close above this level will clear the path for a possible rally to $3,313 and later to $3,581.
On the other hand, if the price turns down from the current level or the resistance line of the channel, it will suggest that bears continue to sell on rallies. That could keep the pair inside the channel for a few more days.
BNB/USD Market Analysis
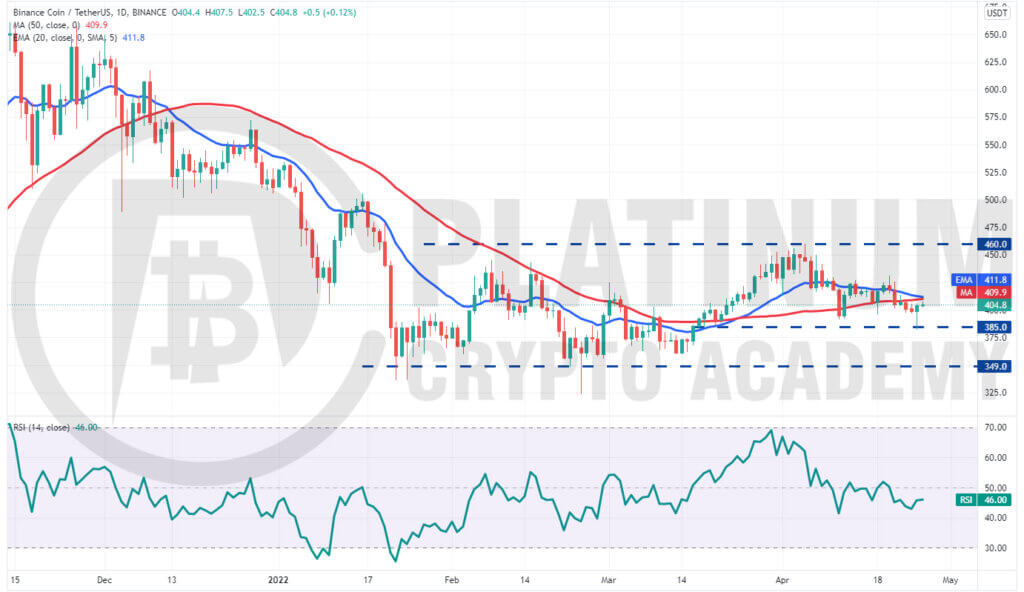
Binance Coin rose above the 20-day EMA on April 19 but the bulls could not build upon this strength. The BNB/USD pair turned down from $431.4 on April 20 and plunged below the 50-day SMA on April 21.
The selling continued and the pair dropped below the strong support at $385 on April 25. However, the bears could not sustain the lower levels as the bulls aggressively defended the $385 support resulting in a sharp recovery.
The price has reached the 20-day EMA which may again act as a resistance. If the price turns down from this level, the bears will make one more attempt to sink and sustain the pair below $385. If they succeed, the pair could drop to $350.
Alternatively, if buyers propel the price above the 20-day EMA, the possibility of a rise to $431 and later to $460 increases.
XRP/USD Market Analysis
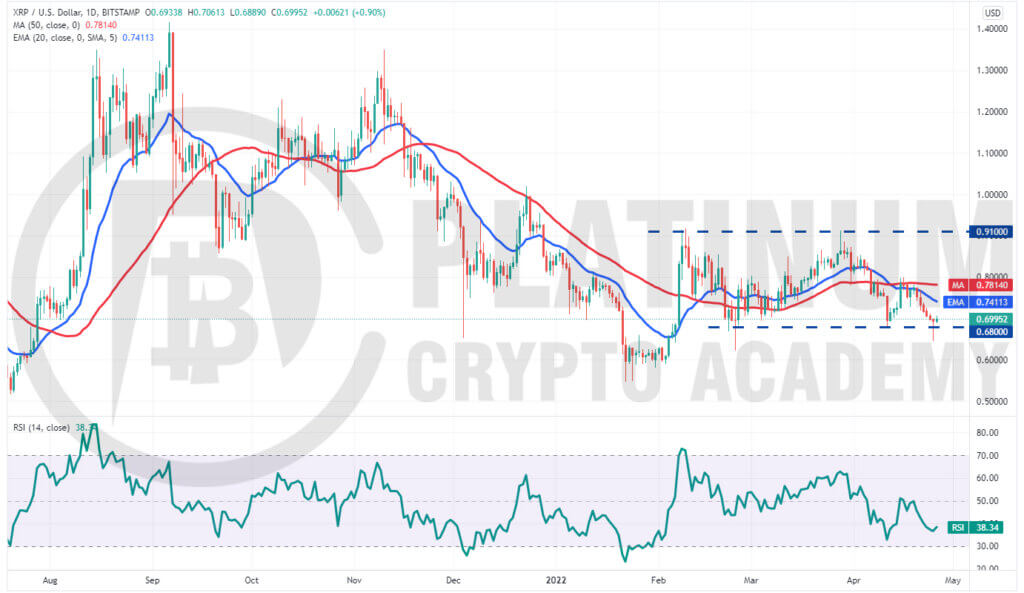
XRP turned down from the 50-day SMA on April 19 and plunged below the strong support at $0.68 on April 25. However, the bears could not sustain the lower levels as seen from the long tail on the April 25 candlestick.
The buyers will now try to push the price to the 20-day EMA which is an important level to keep an eye on. The downsloping 20-day EMA and the RSI in the negative territory suggest advantage to sellers.
If the price turns down from the 20-day EMA, the possibility of a break below $0.68 increases. If that happens, the pair could sink to $0.60.
Conversely, if bulls push the price above the moving averages, it will suggest that the pair could extend its stay inside the large range between $0.68 and $0.91 for a few more days.
LUNA/USD Market Analysis
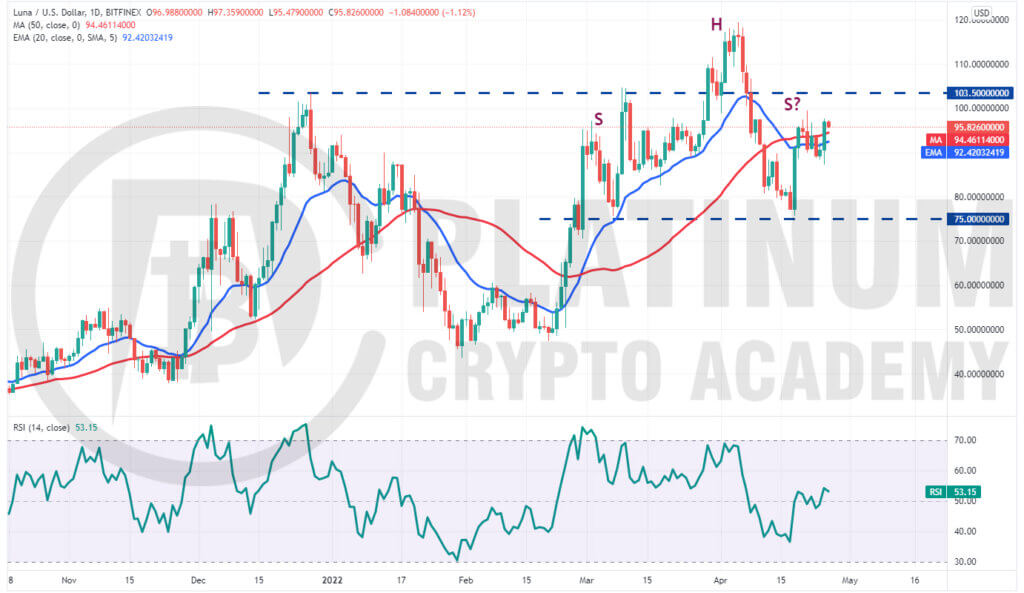
We had projected in our previous analysis that bears will defend the $100 to $103.50 zone aggressively and that is what happened. Terra’s LUNA token turned around from $99.48 on April 21.
Although the price dipped below the 20-day EMA, the bears could not capitalise on the weakness. The failure by the bears to sink and sustain the LUNA/USD pair below $88 may have attracted buying by the bulls.
The pair has once again risen near the overhead resistance zone. If the price turns down from this zone, the pair could remain stuck between $103.50 and $87 for the next few days.
The bears will have to pull and sustain the price below $87 to gain the upper hand. The pair could then drop to the strong support at $75.
Conversely, if bulls thrust the price above $103.50, the pair could retest the all-time high at $119.44. A break and close above this resistance could signal the resumption of the uptrend.
Hopefully, you have enjoyed today’s article for further coverage please check out our crypto Blog Page. Thanks for reading! Have a fantastic day! Live from the Platinum Crypto Trading Floor.
Earnings Disclaimer: The information you’ll find in this article is for educational purpose only. We make no promise or guarantee of income or earnings. You have to do some work, use your best judgement and perform due diligence before using the information in this article. Your success is still up to you. Nothing in this article is intended to be professional, legal, financial and/or accounting advice. Always seek competent advice from professionals in these matters. If you break the city or other local laws, we will not be held liable for any damages you incur.
