
BTC futures and stablecoin margin data shows a lack of appetite from buyers even as Bitcoin gained 7.5% in a week. Bitcoin rallied on the back of the United States stock market’s 3.4% gains on Oct. 28, with the S&P 500 index rising to its highest level in 44 days. In addition, recently released data showed that inflation might be slowing down, which gave investors hope that the Federal Reserve might break its pattern of 75 basis-point rate hikes after its November meeting.
Retail traders usually avoid quarterly futures due to their price difference from spot markets. Still, they are professional traders’ preferred instruments because they prevent the perpetual fluctuation of contracts’ funding rates.These fixed-month contracts usually trade at a slight premium to spot markets because investors demand more money to withhold the settlement. But this situation is not exclusive to crypto markets, so futures should trade at a 4%–10% annualized premium in healthy markets. Bitcoin’s futures premium has stood below 2% for the past 30 days, signaling a complete lack of interest from leverage buyers. Furthermore, there was no significant improvement on Oct. 29 as BTC rallied toward the $21,000 resistance.
The first full week under the leadership of the newly-elected Prime Minister Rishi Sunak saw a major landmark for crypto regulation in the United Kingdom. The Financial Services and Markets Bill, made public on Oct. 25, aims to enhance the U.K.’s position as a “global leader in financial services” — but what is more important is that it contains some new definitions for crypto products.
What are the important levels that could signal a trend change in Bitcoin and the major altcoins? Read our analysis of the major cryptocurrencies to find out.
BTC/USD Market Analysis
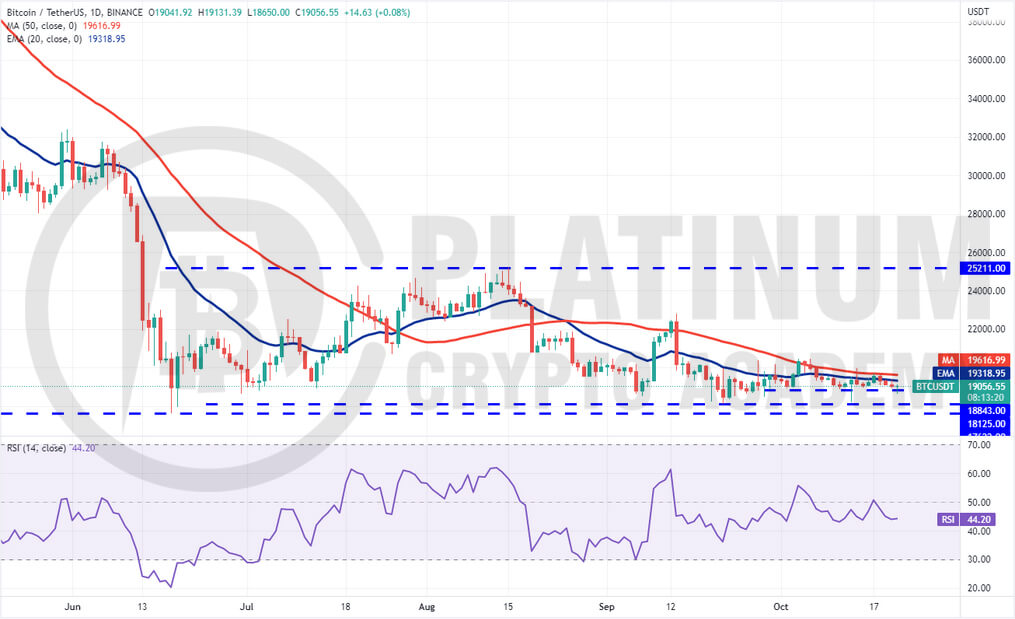
Bitcoin has been trading inside a tight range between $19,500 and $20,715 for the past few days. The failure to push the price back above $20,715 indicates that bears are trying to flip this level into resistance.
The downsloping 20-day exponential moving average (EMA) and the relative strength index (RSI) in the negative territory indicate advantage to sellers.
If bears sink the price below $19,500, the selling could intensify and the BTC/USD pair could drop to the next support zone between $18,600 and $17,567.45. The bulls are expected to defend this zone aggressively because a failure to do so could signal the resumption of the downtrend. The pair could then slide to $16,764.
Contrary to this assumption, if the price turns up from the current level and breaks above $20,715, it will suggest that bulls are back in the game. That could push the price to the 50-day simple moving average (SMA). This level may again act as a resistance but if bulls overcome this barrier, the pair could rally to $24,666.
ETH/USD Market Analysis
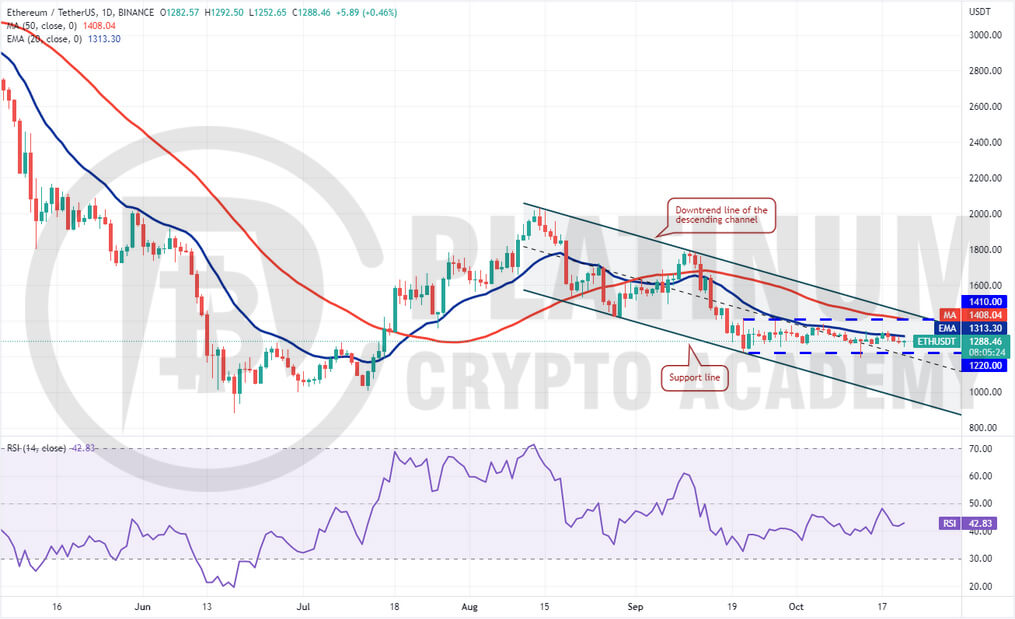
Ether has been clinging to the moving averages for the past few days. Though the bears failed to push the price down the 50-day SMA.The 20-day EMA has flattened out and the RSI has climbed into the positive territory, indicating that the selling pressure could be reducing. The buyers will make one more attempt to push the price above the overhead resistance at $1,700.
If they succeed, the ETH/USD pair could pick up momentum and rally toward the stiff resistance at $2,032. This level is likely to attract aggressive selling by the bears but if bulls absorb the supply, the likelihood of a rally to $2,200 increases. Such a move will indicate that the downtrend could be over.
Contrary to this assumption, if the price turns down from $1,700, it will suggest that bears are active at higher levels. The sellers will then make another attempt to sink the pair below $1,420 and challenge the strong support at $1,280.
BNB/USD Market Analysis
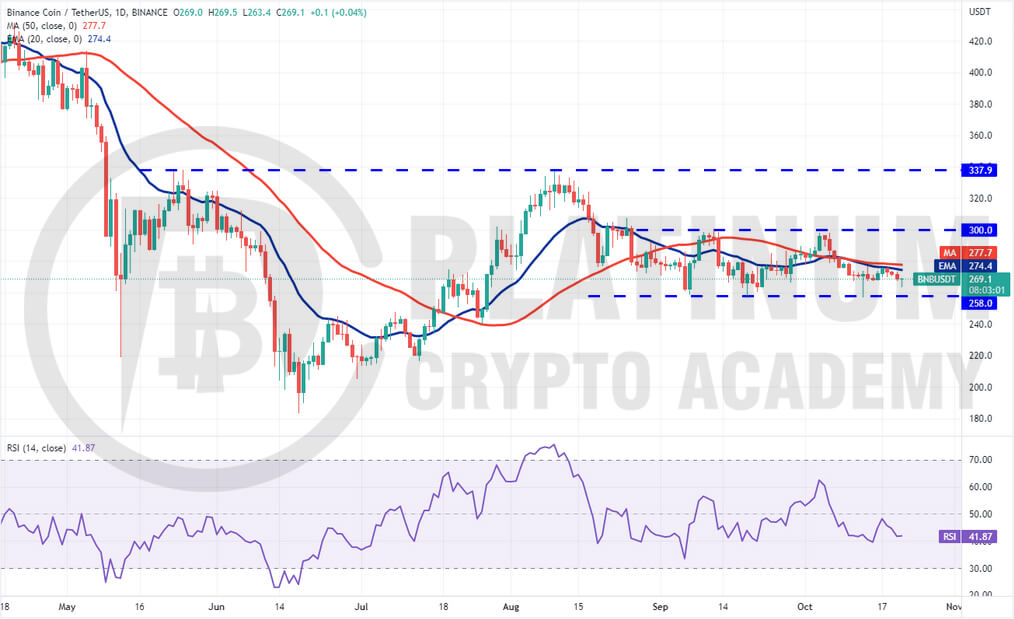
We mentioned in our previous analysis that if the bulls will try to push the pair above the moving averages. If that happens, the pair could attempt a rally to $300. This level is likely to act as a strong barrier but if bulls overcome it, the pair could rally to $338. That is what happened and Binance Coin rose to $333 on October 31.
The 20-day EMA remains the critical level to watch out for on the downside. If the price rebounds off this level, the bulls will again attempt to clear the overhead hurdle at $338. If they manage to do that, the BNB/USD pair could rally to the psychological level of $400 and then to $414.
Conversely, if the price plummets below the 20-day EMA, it will suggest that traders are booking profits after the recent rally. That could open the doors for a possible decline to the 50-day SMA.
XRP/USD Market Analysis
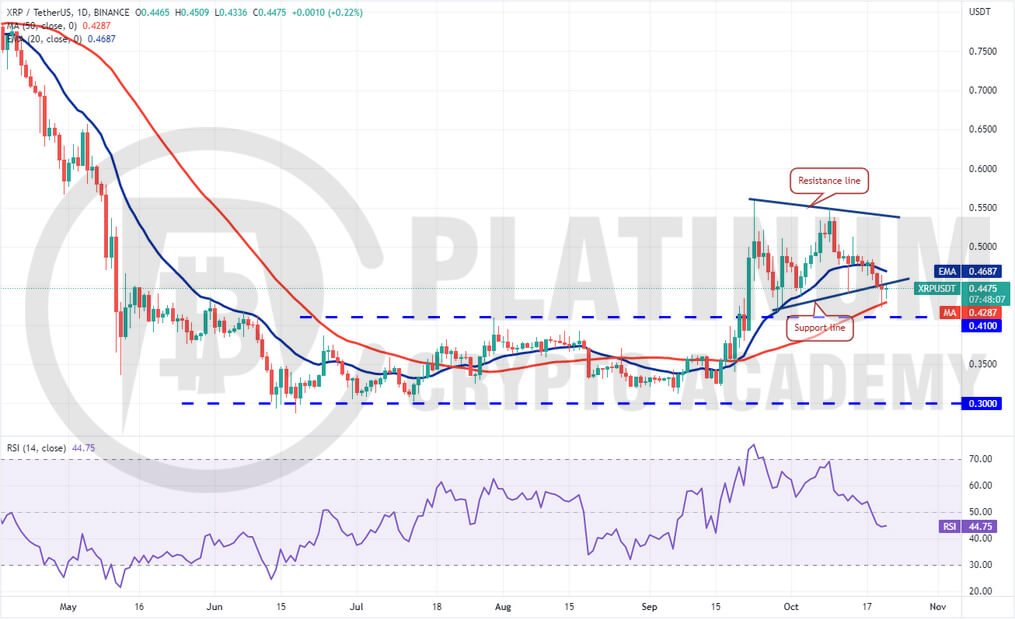
We had projected in our previous analysis that bulls are expected to defend the $0.45 to $0.41 zone with vigor and they did that. XRP rebounded sharply off $0.44
The 20-day EMA has flattened out and the RSI is near the midpoint, indicating that the bullish momentum has weakened. This suggests that the XRP/USD pair could remain stuck in a range for a few days.
If the price breaks below the 20-day EMA, the pair could again slide to $0.45 and later to $0.41. The bulls are likely to buy this dip aggressively. A strong rebound off this zone could suggest that the pair may extend its stay inside the range for a few more days.
Another possibility is that the price rebounds off the 20-day EMA. In that case, the pair could rise to the overhead zone between $0.52 and $0.56. The bears are expected to defend this zone but if bulls overcome the barrier, the pair could resume its uptrend.
ADA/USD Market Analysis
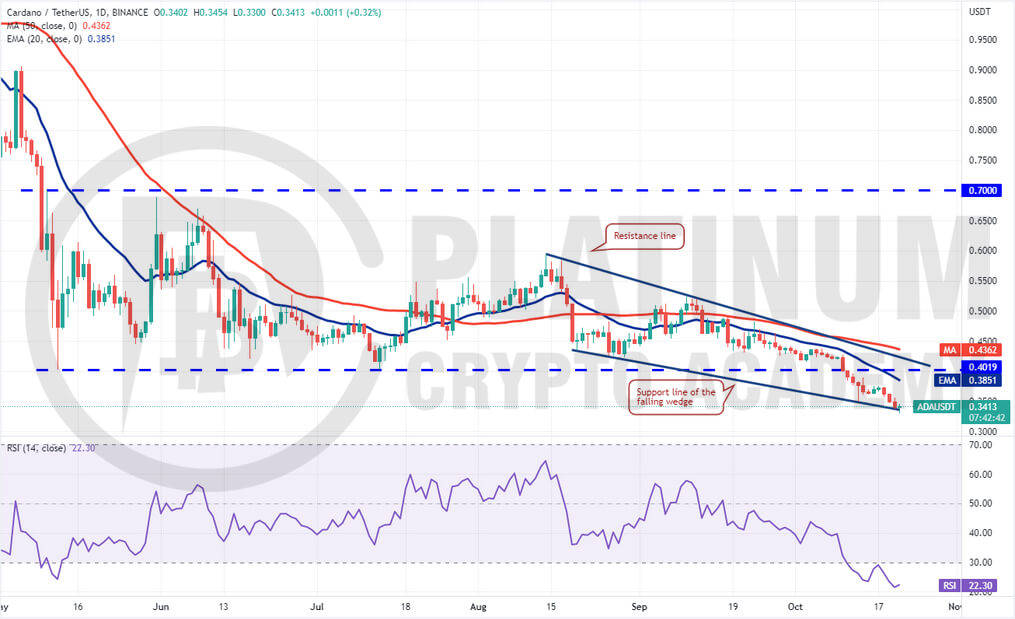
Cardano has been in a downtrend for the past few days. After a two-day relief rally, the selling resumed on Oct. 29 and the bears have pulled the price to the support line of the wedge.
The sharp selling of the past few days has sent the RSI tumbling deep into the oversold territory. This suggests that the selling may have been overdone in the near term and a relief rally or consolidation may be around the corner.
If the price turns down from $0.42, the bears will make one more attempt to sink the ADA/USD pair below $0.39. If the bears can pull it off, the pair could decline to $0.35.
This negative view could invalidate in the short term if the price rises and breaks above the downtrend line. Such a move will suggest aggressive buying at lower levels. The pair could then attempt a rally to $0.52.
Hopefully, you have enjoyed today’s article for further coverage please check out our crypto Blog Page. Thanks for reading! Have a fantastic day! Live from the Platinum Crypto Trading Floor.
Earnings Disclaimer: The information you’ll find in this article is for educational purpose only. We make no promise or guarantee of income or earnings. You have to do some work, use your best judgement and perform due diligence before using the information in this article. Your success is still up to you. Nothing in this article is intended to be professional, legal, financial and/or accounting advice. Always seek competent advice from professionals in these matters. If you break the city or other local laws, we will not be held liable for any damages you incur.
")