
Bitcoin dropped to $17,567 on June 18, its lowest level since November 2020. The drop below $20,000 was the first occasion in Bitcoin’s short history that it breached the all-time high made during the previous bull market cycle. Traders fear that if Bitcoin starts to trade below $20,000, it could lead to margin calls and forced liquidations. Jeffrey Gundlach, CEO of DoubleLine Capital, expects Bitcoin to drop to $10,000.
The selling is not limited to cryptocurrencies, United States equities markets also plunged sharply last week. The S&P 500 fell 5.8% to its worst level since March 2020 and the Nasdaq Composite dropped 4.8%. Both the indices are in bear market territory. The S&P 500 is down 23% from its all-time high while the Nasdaq is off 33% from its record high.
In comparison, the crypto universe has seen a much sharper fall. According to data compiled by CoinGoLive, 72 out of the top 100 coins have plunged more than 90% from their all-time high. The collapse of the Terra ecosystem, the crisis at crypto lending platform Celsius, liquidity issues at crypto hedge fund Three Arrows Capital, and the de-pegging of Staked Ether or stETH from its underlying Ether have created a sense of panic among crypto investors.
Some institutional investors seem to be dumping their positions in a hurry. Canada’s Purpose Bitcoin exchange-traded fund (BTCC) and 3iQ CoinShares Bitcoin ETF, have both witnessed massive liquidations in the past few days. BTCC’s holdings plunged from 47,818 Bitcoin to 23,307 Bitcoin between June 16 and June 17 while 3iQ’s stash reduced from 23,917 Bitcoin on June 1 to 12,668 Bitcoin on June 17.
However, after the sharp fall, some analysts are hopeful that the crypto markets may soon start to bottom out. Giles Keating, director of Bitcoin Suisse, told CNBC that “some of the real excess leverage has now been driven out of the system and a bottom can begin to be formed.”
What are the key levels to keep an eye on? Read our analysis about Bitcoin prices keep sinking and major altcoins have recovered from their recent lows. Now need to watch where could Bitcoin will bottom out.
BTC/USD Market Analysis
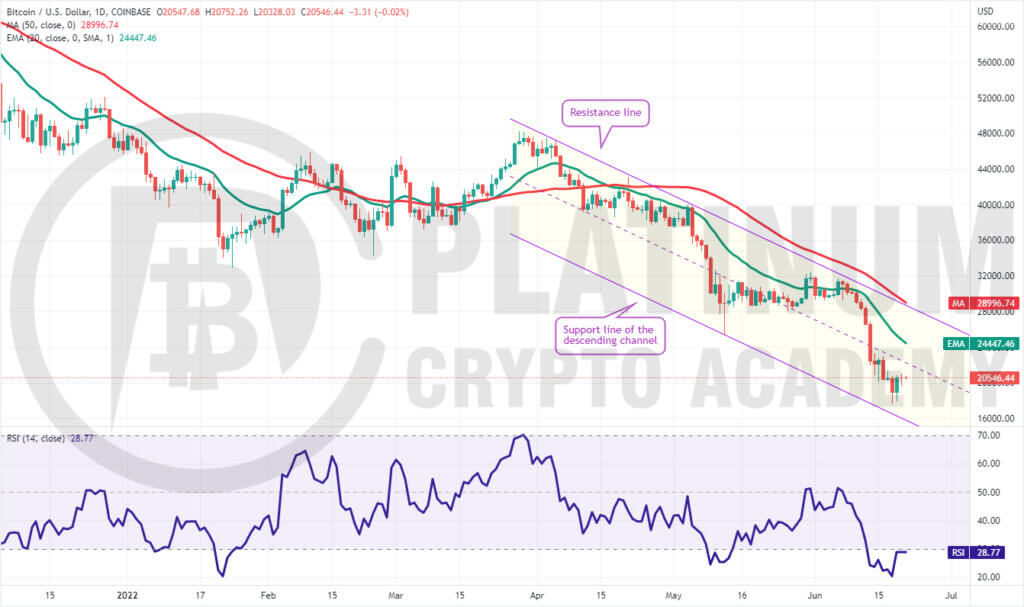
We expected bulls to defend the $20,000 support but the bears had other plans. They pulled the price to $17,567 on June 18 but could not sustain the lower levels. This suggests strong buying on dips. The BTC/USD pair rose back above $20,000 on June 19 but the buyers are struggling to build upon this recovery.
If the price turns down from the current level, it will suggest that bears have flipped the $20,000 level into resistance. That could increase the possibility of a drop to $17,567. If this level cracks, the next stop could be the support line of the descending channel near $16,000.
Conversely, if buyers sustain the price above $20,000, the pair could rally to the 20-day exponential moving average (EMA). This is an important level to watch out for.
If the price turns down from this level but rebounds off $20,000, it will suggest that buyers are attempting to form a higher low. The bulls will then attempt to push the price toward the 50-day simple moving average (SMA). A break and close above this resistance could indicate a potential change in trend.
ETH/USD Market Analysis
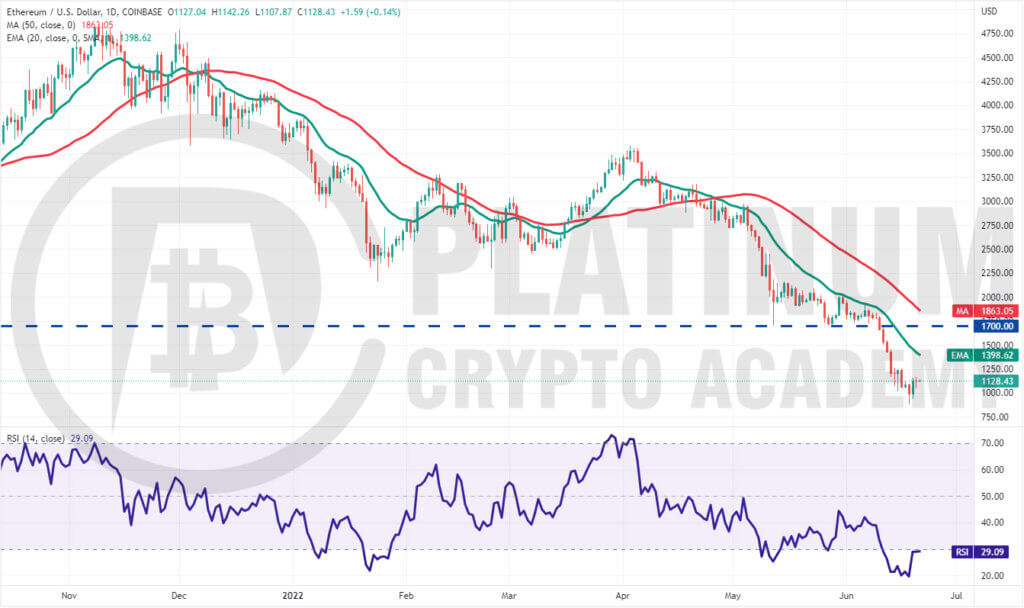
Buyers defended $1,000 from June 15 to June 17 but could not sustain the price above $1,250. This indicated a lack of demand at higher levels. The sellers used this opportunity and pulled Ether to $879 on June 18.
A minor positive is that bulls purchased the dip as seen from the long tail on the day’s candlestick. The buyers will again try to push the price above $1,250.
If they manage to do that, the ETH/USD pair could rally to the 20-day EMA. This is an important level to watch out for because the bulls have not been able to sustain the price above it since April 6.
If the price once again turns down from the 20-day EMA, it will suggest that the sentiment remains negative and traders are selling on rallies. The bears will then make one more attempt to pull the price toward $879. A break and close below this support could open the doors for a decline to $715.
On the contrary, a break and close above the 20-day EMA will indicate that the bears may be losing their grip. The pair could then rise to the breakdown level of $1,700.
BNB/USD Market Analysis
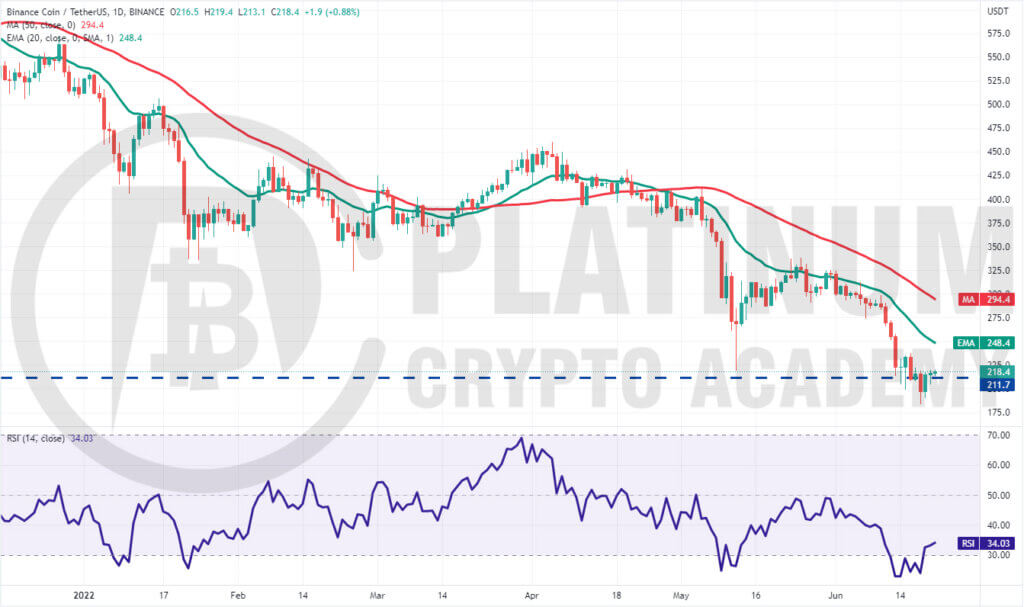
We had highlighted in our previous analysis that if the $200 level cracks, the next support is at $186. Binance Coin bounced off $183 on June 18 and the bulls have pushed the price back above the breakdown level of $211.
If buyers sustain the price above $211, it will suggest that the breakdown on June 18 may have been a bear trap. That could attract short-covering from the aggressive bears, pushing the price to the 20-day EMA.
If the price turns down from this level, the bears will again try to sink the pair below $211 and challenge the $183 support.
On the other hand, if buyers clear the overhead hurdle at the 20-day EMA, the pair could rally to the 50-day SMA. This level may again act as a strong resistance but if bulls overcome this barrier, it will suggest that the pair may have bottomed out at $183.
XRP/USD Market Analysis
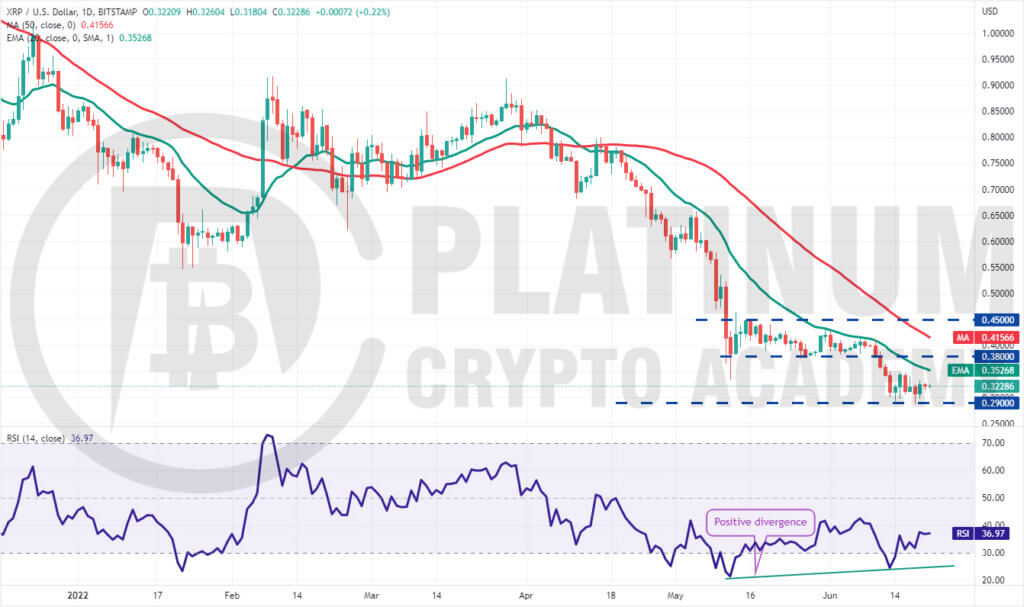
The bulls successfully defended the support at $0.29 for the past few days but struggled to start a recovery. This suggests that bears continue to sell on minor rallies.
However, the relative strength index (RSI) has formed a positive divergence indicating that the bearish momentum could be weakening. The bulls will again try to push the price above the 20-day EMA.
If they manage to do that, the XRP/USD pair could rise to $0.38 which could again act as a resistance. If bulls overcome this barrier, the up-move could reach $0.45.
Alternatively, if the price turns down from $0.38, the pair could plummet toward $0.29 and remain range-bound between these two levels for a few days. The bears will have to sink and sustain the price below $0.29 to signal the resumption of the downtrend. The next support on the downside is $0.24.
ADA/USD Market Analysis
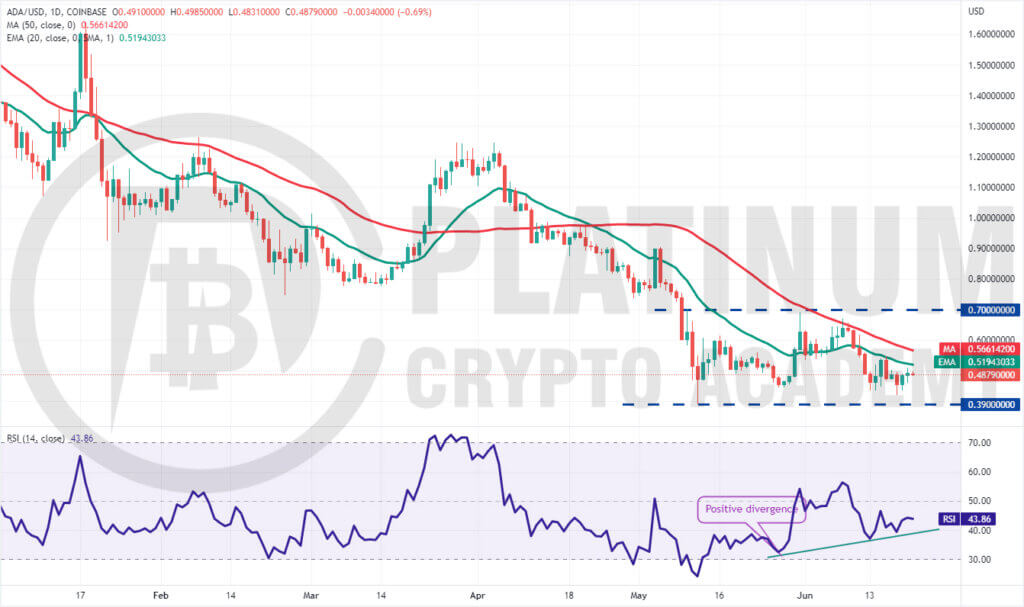
Cardano has been consolidating in a large range between $0.39 and $0.70 for the past several days. A positive sign is that the bulls have not allowed the price to dip below its May 12 intraday low of $0.39.
The positive divergence on the RSI suggests that the selling pressure may be reducing. The buyers will have to push the price above the moving averages to capitalise on this situation.
If they do that, the ADA/USD pair could rally to the overhead resistance at $0.70. This level may again act as a stiff hurdle and if the price turns down from it, the pair may extend its range-bound action for a few more days.
Contrary to this assumption, if the price turns down from the 20-day EMA, the bears will again try to pull the pair below $0.39. If they succeed, it will signal the start of the next leg of the downtrend. The pair could then decline to $0.30.
Hopefully, you have enjoyed today’s article for further coverage please check out our crypto Blog Page. Thanks for reading! Have a fantastic day! Live from the Platinum Crypto Trading Floor.
Earnings Disclaimer: The information you’ll find in this article is for educational purpose only. We make no promise or guarantee of income or earnings. You have to do some work, use your best judgement and perform due diligence before using the information in this article. Your success is still up to you. Nothing in this article is intended to be professional, legal, financial and/or accounting advice. Always seek competent advice from professionals in these matters. If you break the city or other local laws, we will not be held liable for any damages you incur.
