
Bitcoin decoupled from the US equities market last week but not the way the bulls may have wanted. The largest cryptocurrency by market capitalisation painted a record ninth red weekly candle last week while the US equities markets rose more than 6%.
However, in the week beginning May 30, the Bitcoin bulls came back with a vengeance and pushed the price above $30,000, its best one-day rally in two months. Glassnode said in its Uncharted newsletter on May 30 that Bitcoin’s “price action appeared to have bottomed for the time being.”
On similar lines, JPMorgan analysts in their note on May 25 said the recent drop in crypto markets looked “like capitulation relative to last January/February and going forward we see upside for Bitcoin and crypto markets more generally.” The bank has retained Bitcoin’s fair price at $38,000.
Glassnode data shows that Bitcoin whales holding less than 100 Bitcoin have increased their balance by 80,724 Bitcoin, which is eerily similar to the 80,081 Bitcoin liquidated by the LUNA Foundation Guard. The larger whales holding more than 10,000 Bitcoin have also added 46,260 Bitcoin during the same period. However, entities holding between 100 Bitcoin and 10,000 Bitcoin have shown “relatively little net change to their holdings.”
Although Bitcoin is trading about 55% from its all-time high, billionaire investor Tim Draper has retained his bullish view for the long term. While speaking on the Wolf of All Streets YouTube show on May 24, Draper said that Bitcoin’s next bull run will be triggered by women. He expects retailers to start accepting Bitcoin to save on transaction costs. When that happens, “all the women will have Bitcoin wallets and they will be buying things with Bitcoin.” Draper believes that could push Bitcoin’s price above his “$250,000 estimate.”
Could crypto markets build on the rebound or will higher levels continue to attract selling by the bears? Is the current crypto bull run indicates rally in Bitcoin and altcoins a dead cat bounce or is this a sign that a bottom has been made? Read our analysis of the major cryptocurrencies to find out.
BTC/USD Market Analysis
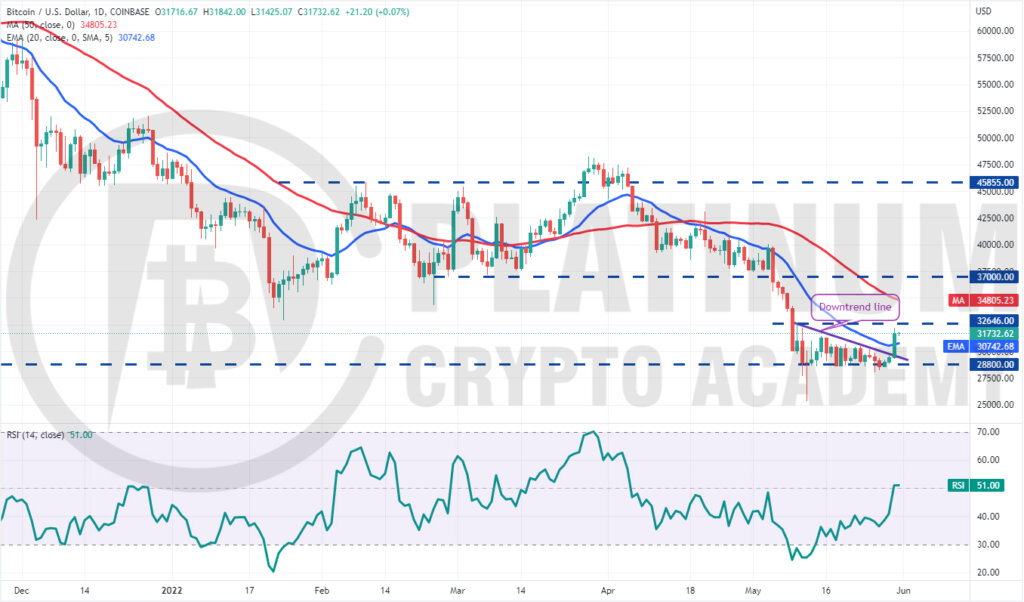
Bitcoin slipped below the strong support at $28,800 on May 26 and May 27 but the bears could not build upon this advantage. This indicated strong buying at lower levels.
The BTC/USD pair climbed back above $28,800 on May 28, trapping the aggressive bears. This started a recovery which picked up momentum after bulls pushed the price above the downtrend line.
The pair soared above the 20-day exponential moving average (EMA) on May 30, indicating that the downtrend is weakening. The relief rally may face resistance at $32,646.
If the price turns down from this level, it will suggest that bears continue to sell on rallies. That may keep the pair range-bound between $32,646 and $28,000 for a few days.
The flattening 20-day EMA and the relative strength index (RSI) near the midpoint also suggest a consolidation in the short term.
On the other hand, if buyers drive the price above $32,646, the pair could rally to the 50-day simple moving average (SMA) where the bears may again mount a strong defence.
On the downside, $28,000 is the key level for the bears to defend. A breach of this support could open the doors for a decline to $25,000.
ETH/USD Market Analysis
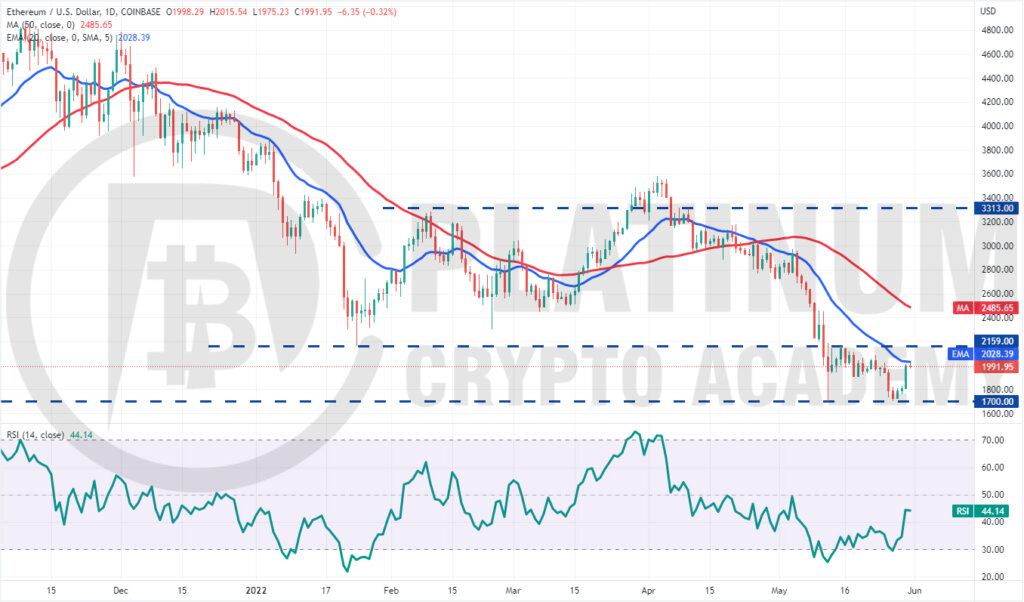
We had suggested in our previous analysis that Ether could plummet to $1,700 and the bulls will have to defend this level aggressively and that is what happened.
The ETH/USD pair dropped to $1,700 on May 27 but strong buying by the bulls started the rebound on May 28. Sustained buying at higher levels has pushed the pair to the 20-day EMA. If buyers propel the price above this resistance, the next stop could be $2,159.
The bears are likely to defend the $2,159 level aggressively. If the price turns down sharply from this level and breaks below the 20-day EMA, it will suggest that the pair may remain stuck between $2,159 and $1,700 for some time.
On the contrary, if bulls thrust the price above $2,159, the pair will complete a double bottom pattern. The pair could then rally to the 50-day SMA and later rise to the pattern target of $2,618.
This bullish view will be invalidated if the price turns down and plummets below the vital support of $1,700.
BNB/USD Market Analysis
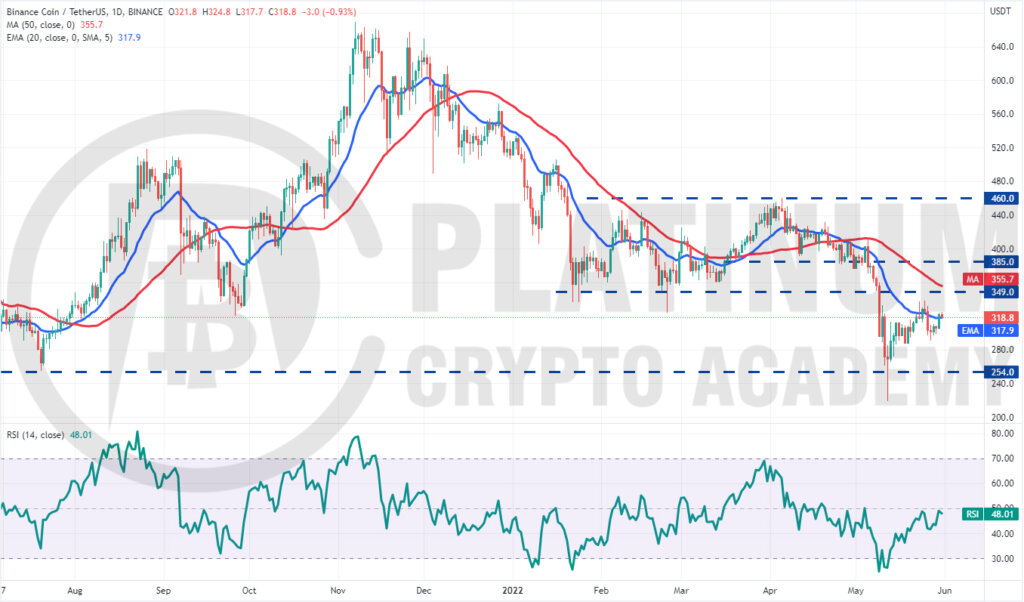
We had said in our previous analysis that $286 will act as a strong support and Binance Coin rebounded from $290.6 on May 27.
The buyers are attempting to sustain the price above the 20-day EMA. If they succeed, the BNB/USD pair could rise to $349 where the bears are expected to pose a strong challenge.
If the price turns down from the current level or the overhead resistance, it will suggest that the pair may remain stuck in a wide range between $349 and $254 for a few days.
The flattening 20-day EMA and the RSI near the midpoint also suggest a consolidation in the near term.
Contrary to this assumption, if bulls propel the price above $349, the pair could pick up momentum and rally to $385. On the downside, a break below $286 could pull the pair to $254.
XRP/USD Market Analysis
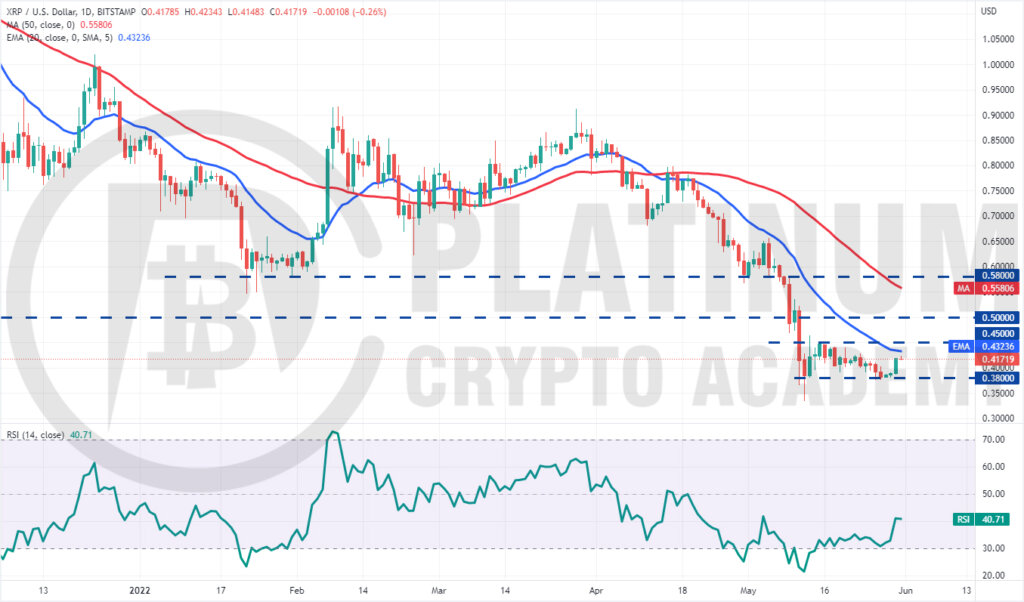
XRP remains stuck inside a tight range between $0.45 and $0.38. Although bears pulled the price below the range on May 26 and May 27, they could not sustain the lower levels. This suggests that bulls continue to buy on dips.
The XRP/USD pair started a recovery on May 30 and has reached the 20-day EMA. The bears are likely to defend the zone between the 20-day EMA and $0.45. If the price turns down from this zone, the range-bound action may continue for a few more days.
The buyers will have to push and sustain the price above $0.45 to indicate strength. That could clear the path for a possible rally to the psychological level of $0.50. A break and close above this resistance will suggest that the pair may have formed a bottom on May 12.
This bullish view will invalidate if the price turns down and plummets below $0.38. That could sink the pair to $0.33.
SOL/USD Market Analysis
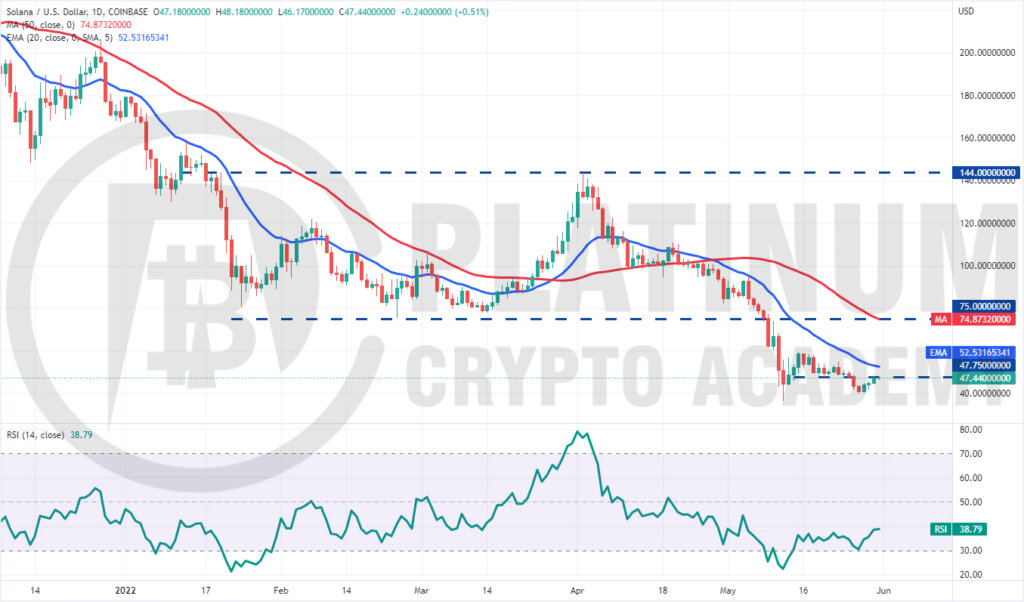
Solana plunged and closed below the $47.75 support on May 26 but the bears could not challenge the critical support of $36. This suggests that bulls are accumulating at lower levels.
The buyers are trying to push the price back above $47.75. If they succeed, the SOL/USD pair could rise to the 20-day EMA. This is an important level for the bears to defend because a break and close above it could suggest that the bulls are making a strong comeback.
The pair could then rally to $60 and later start its march toward the breakdown level of $75.
Contrary to this assumption, if the price turns down sharply from the 20-day EMA, it will suggest that bears remain in control. The sellers will then try to pull the pair down to $39 and later attempt a break below $36.
Hopefully, you have enjoyed today’s article for further coverage please check out our crypto Blog Page. Thanks for reading! Have a fantastic day! Live from the Platinum Crypto Trading Floor.
Earnings Disclaimer: The information you’ll find in this article is for educational purpose only. We make no promise or guarantee of income or earnings. You have to do some work, use your best judgement and perform due diligence before using the information in this article. Your success is still up to you. Nothing in this article is intended to be professional, legal, financial and/or accounting advice. Always seek competent advice from professionals in these matters. If you break the city or other local laws, we will not be held liable for any damages you incur.
