
The United States banking sector witnessed a huge turmoil in the past week. It started after Silicon Valley Bank (SVB) said on March 8 that it needed to raise $2.25 billion to strengthen its balance sheet. That spooked customers who withdrew $42 billion of deposits by the end of March 9, according to a California regulatory filing. This bank run unnerved investors and stoked fears that other banks may also get affected. To prevent that and to reassure customers, the U.S. regulators stepped in and shut down the bank on March 10.
However, by then, the contagion had already spread and customers withdrew $10 billion in deposits from Signature Bank, a board member told CNBC. The US regulators announced on March 12 that they will take over Signature Bank to protect the depositors and strengthen confidence in the US banking system.
The Federal Reserve announced the creation of a new Bank Term Funding Program to safeguard investors’ deposits but that did not stop the bloodbath in regional banks when US markets opened on March 13.
Some economists expect the Fed to hold rates steady due to the banking crisis. The CME FedWatch Tool shows a 25% probability of a pause by the Fed in their March meeting.
The collapse of the legacy banking system had an effect on the crypto companies. Circle, the issuer of USD Coin (USDC), tweeted on March 10 that $3.3 billion of its $40 billion USDC reserves were stuck at SVB. That created panic among crypto investors and resulted in the USDC losing its peg to the US dollar. The USDC fell to $0.87 on March 11 but recovered and fully re-pegged to the US dollar by March 13, according to CoinGecko data.
A silver lining in the chaos of the past few days is that Bitcoin witnessed aggressive buying at lower levels. Bitcoin rose from $19,568 on March 10 to $24,710 on March 13, a 26% jump within a short time. This suggests that Bitcoin is behaving as a safe haven during the crisis.
Could Bitcoin and major altcoins continue their recovery in the next few days? Let’s study the charts to find out.
BTC/USD Market Analysis
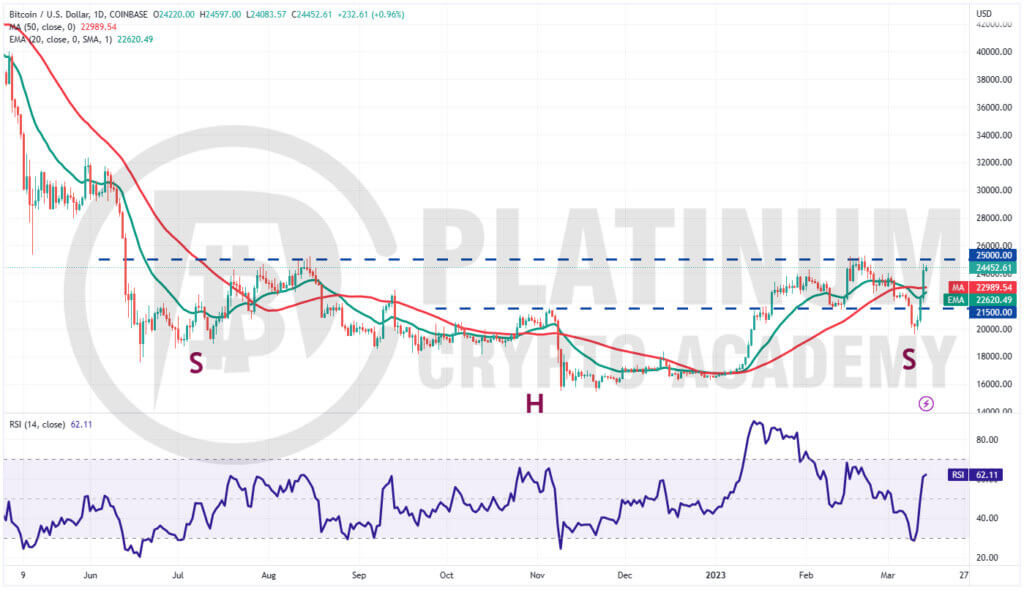
We said in our previous analysis that a break below $21,500 could result in a fall to $20,000 and that is what happened.
We added that if buyers drive the price above the 20-day exponential moving average (EMA), the BTC/USD pair could reach $25,000 and that also played out according to our assumption.
Bitcoin is near the stiff overhead resistance of $25,000. This is an important level to keep an eye on because a break and close above it will complete a large inverse head and shoulders (H&S) pattern.
This bullish setup could signal a potential trend change. The first target on the upside is $32,000 and then the pattern target of $34,500. The longer the price sustains above $25,000, the greater the possibility that the downtrend has ended.
Conversely, if the price turns down sharply from $25,000 and plummets below the moving averages, it will suggest that bears are unwilling to relent. That may keep the pair range-bound between $20,000 and $25,000 for a few days.
ETH/USD Market Analysis
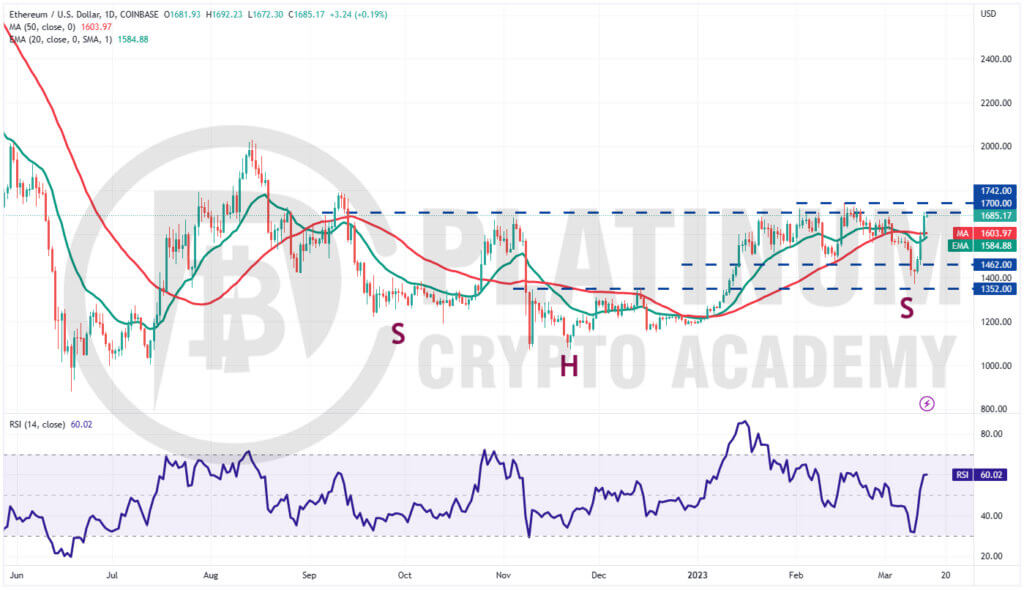
We projected in the previous analysis that Ether could fall to $1,462 where the bulls are likely to buy aggressively.
Although the price overshot on the downside and fell to $1,369 on March 10, the recovery was sharp and the ETH/USD pair reached $1,700 on March 13.
The 20-day EMA has started to turn up and the relative strength index (RSI) has jumped into the positive territory, indicating a minor advantage to buyers.
If buyers thrust the price above the $1,700 to $1,742 resistance zone, the pair will complete a bullish inverse H&S pattern. That may start a northward march to $2,000 and thereafter to the pattern target of $2,329.
Contrary to this assumption, if the price turns down sharply from the current level, it will suggest that the pair may oscillate between $1,352 and $1,742 for a while longer.
BNB/USD Market Analysis
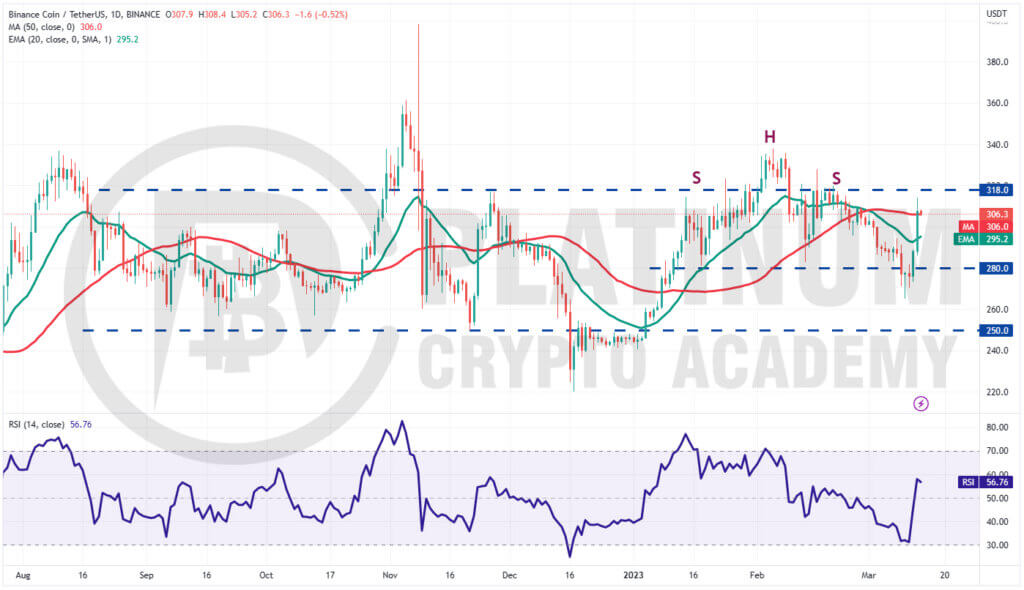
Binance Coin plunged below the $280 support on March 9, completing a bearish H&S pattern. However, the bears could not sustain the lower levels. The price turned up sharply and rose above the breakdown level on March 12.
This may have trapped the aggressive bears who rushed to cover their positions, causing a short squeeze. That propelled the price near the overhead resistance of $318 on March 13.
The bears are expected to fiercely defend the zone between $318 and $338. A break above this zone will invalidate the bearish setup and start a strong rally toward $400.
Conversely, if the price turns down from the current level, the bears will try to sink the pair below the 20-day EMA. If they succeed, the pair could slide to $280 and then to $265.
XRP/USD Market Analysis
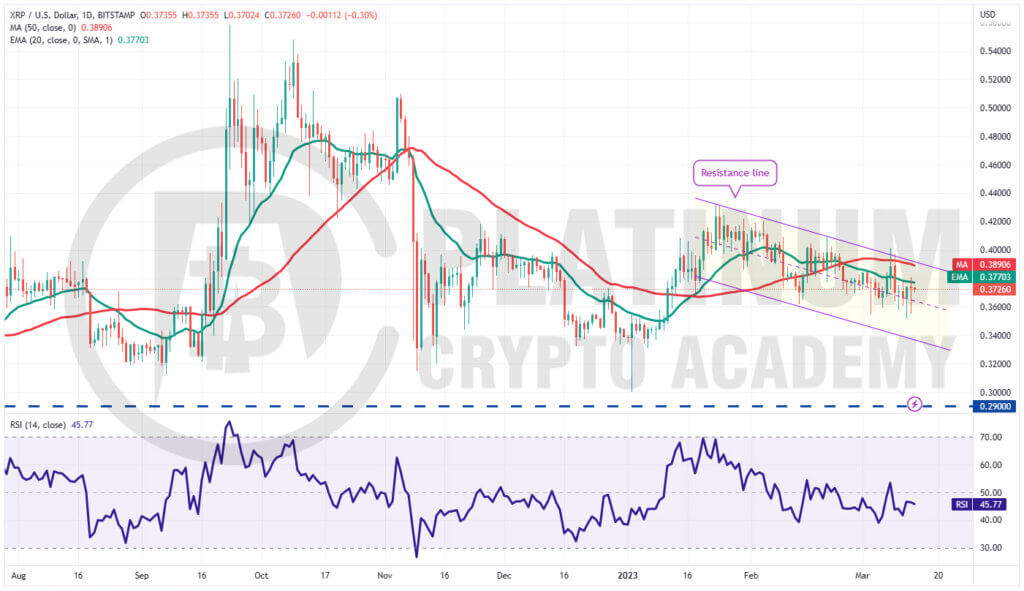
Ripple has been trading inside a descending channel pattern for the past few days. The bears tried to pull the price toward the support line of the channel but the bulls purchased the dip to $0.35.
However, the bears are protecting the 20-day EMA on the upside. This suggests that the sentiment remains negative and rallies are being sold into.
If the price turns down from the 20-day EMA or the 50-day simple moving average (SMA), the XRP/USD pair may extend its stay inside the channel for a few more days.
If bulls want to gain the upper hand, they will have to thrust the price above the channel. If they manage to do that, the pair may rally to $0.43.
Contrarily, if the price turns down from the current level and slips below $0.35, the pair could tumble to the support line of the channel. Buyers are expected to aggressively defend this support.
ADA/USD Market Analysis
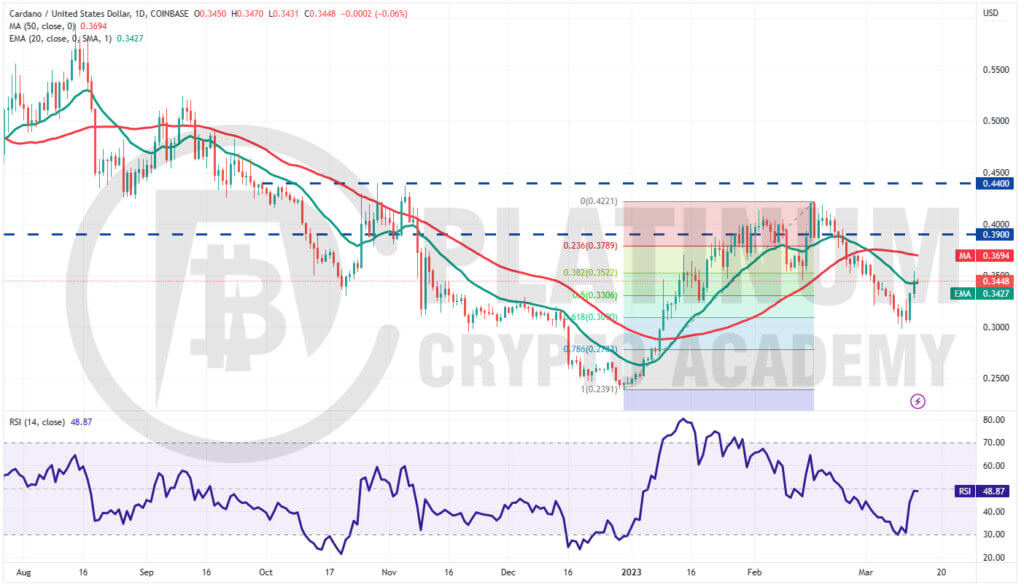
We mentioned in the previous analysis that if the $0.32 support cracks, Cardano could reach $0.30 and that happened on March 10. We also said that bulls are expected to defend the level and they did just that.
The ADA/USD pair rebounded off $0.30 support and rose above the 20-day EMA on March 13.
The bears are expected to mount a strong defense of the moving averages. If the price turns down from this zone, the bears will again try to sink the pair below $0.30.
If they manage to do that, the pair may plummet to the 78.6% Fibonacci retracement level of $0.27.
On the other hand, if the price rises above the 50-day SMA, it will open the gates for a possible rally to $0.42.
Hopefully, you have enjoyed today’s article for further coverage please check out our crypto Blog Page. Thanks for reading! Have a fantastic day! Live from the Platinum Crypto Trading Floor.
Earnings Disclaimer: The information you’ll find in this article is for educational purpose only. We make no promise or guarantee of income or earnings. You have to do some work, use your best judgement and perform due diligence before using the information in this article. Your success is still up to you. Nothing in this article is intended to be professional, legal, financial and/or accounting advice. Always seek competent advice from professionals in these matters. If you break the city or other local laws, we will not be held liable for any damages you incur.
