
The United States equities markets closed the month of September with sharp cuts. The S&P 500 dropped 9.3% while the Nasdaq Composite slipped 10.5%. For the third quarter ending September, the S&P 500 declined 5.3% and the Nasdaq 4.1%. This marked the first three-quarter losing streak for both these indices since 2009.
Although cryptocurrencies have been closely correlated with the US equities markets for a large part of 2022, Bitcoin showed the first signs of decoupling in September. The largest cryptocurrency by market capitalization fell only about 3% in September, indicating that lower levels may have attracted accumulation from long-term investors.
The bullish bias of the cryptocurrency traders may be due to Bitcoin’s historically strong performance in October. According to coinglass data, Bitcoin has closed October in the red only on two occasions, in 2014 and 2018. Hence, cryptocurrency enthusiasts popularly call the month as “Uptober.”
Robert Kiyosaki, businessman and best-selling author of Rich Dad Poor Dad, said in a tweet on October 2 that Bitcoin, gold and silver prices may go down if the Federal Reserve continues to increase interest rates as that would cause the US dollar to strengthen. He called this a buying opportunity because when the “Fed pivots and drops interest rates as England just did you will smile while others cry.”
However, institutional investors do not seem to be buying the bullish view on Bitcoin. Coinglass data on September 30 showed testosterone cypionate cycling that the discount on the Grayscale Bitcoin Trust (GBTC) to its net asset value reached more than 36%. The discount means that if an institution were to buy GBTC shares, they would get Bitcoin at a price of around $12,000, the only catch being the lock-in period of six months. Even these mouthwatering levels have not boosted demand for the GBTC shares, suggesting that institutional investors are not positive about Bitcoin over the next few months.
What are the important levels that could signal a trend change in Bitcoin and the major altcoins? Read our analysis of the major cryptocurrencies to find out.
BTC/USD Market Analysis
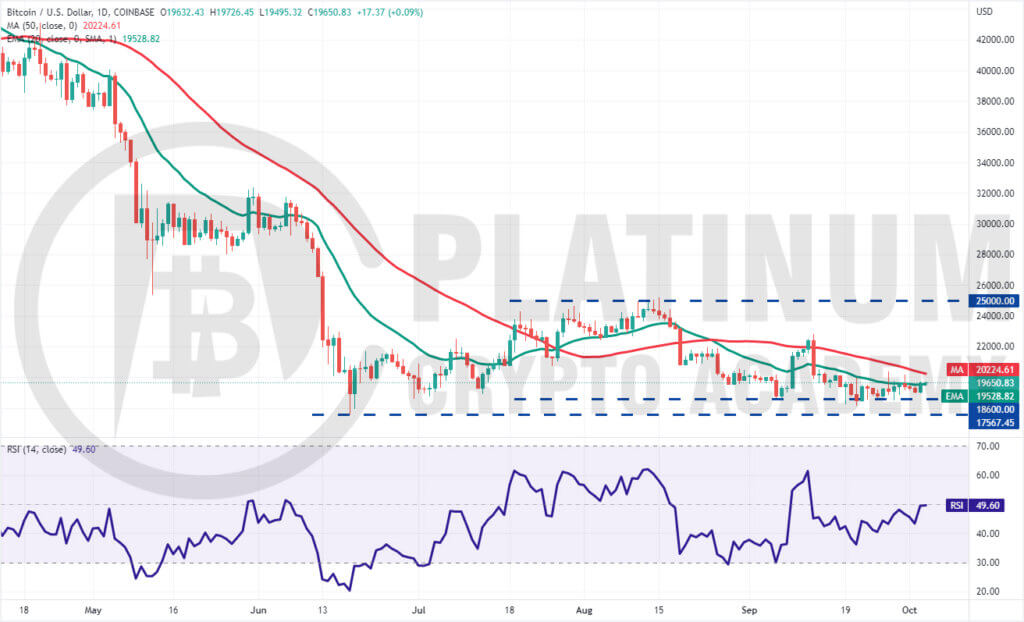
We had projected in the previous analysis that Bitcoin is likely to face resistance at the 50-day simple moving average and that is what happened.
Bitcoin climbed above the 20-day exponential moving average (EMA) on September 27 and again on September 30 but the bulls could not sustain the higher levels as seen from the long wick on the candlesticks.
The first major hurdle for the bulls to cross on the upside is $20,500. If they manage to do that, the bullish momentum could pick up and the BTC/USD pair could rally to the next stiff resistance of $22,800.
Alternatively, if the price turns down from the current level or the overhead resistance, the bears will again try to sink the pair below $18,600. If they succeed, the pair could drop to the June low of $17,567.45. The bears will have to pull the price below this vital support to signal the start of the next leg of the downtrend.
The flattish 20-day EMA and the relative strength index (RSI) near the midpoint do not give a clear advantage either to the bulls or the bears. It points to a possible range-bound action between $18,600 and $20,500 for the next few days.
ETH/USD Market Analysis
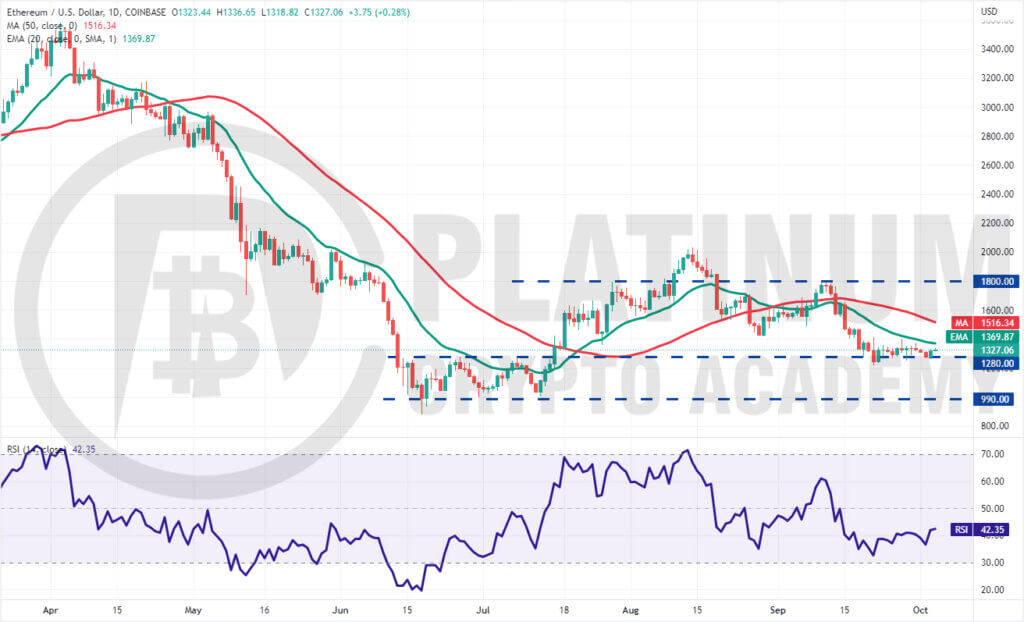
Ether’s price is getting squeezed between the 20-day EMA and $1,280 for the past few days. This shows that the bulls are aggressively defending the $1,280 support but they haven’t been able to clear the obstacle at the 20-day EMA.
This tight-range trading is unlikely to continue for long and could soon resolve with a sharp breakout. However, it is difficult to predict the direction of the breakout with certainty. Hence, traders should wait for the price to break above the 20-day EMA or drop below $1,280 before taking directional bets.
If bulls drive the price above the 20-day EMA, the ETH/USD pair could rally to the 50-day SMA. This level may again act as a barrier but if bulls overcome it, the pair could rally to $1,800.
Conversely, if the price turns down and plummets below $1,280, the selling could intensify and the pair could drop toward the psychological support at $1,000.
BNB/USD Market Analysis
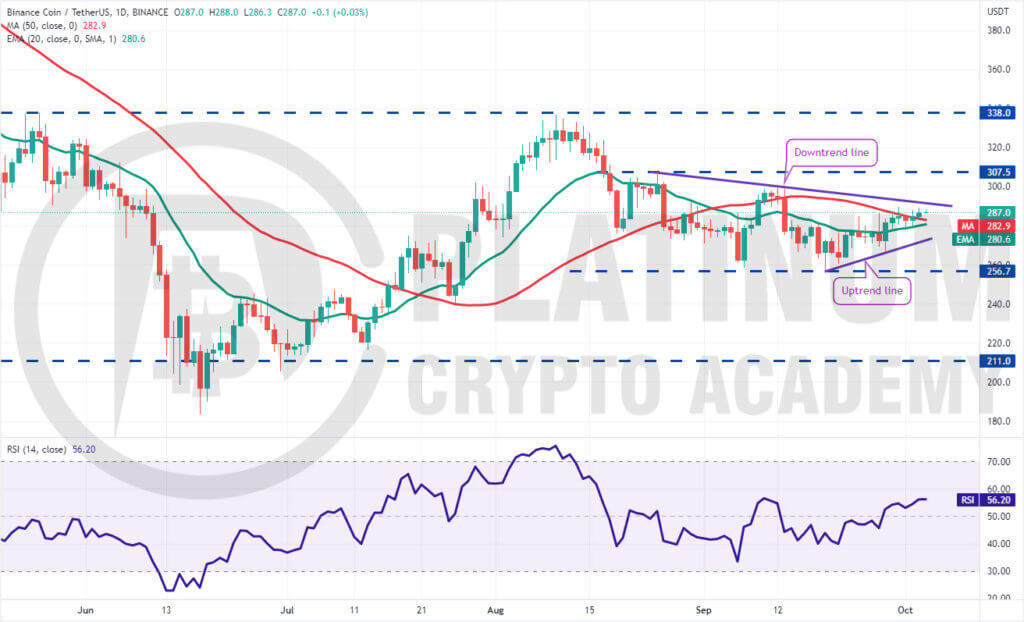
Binance Coin has been stuck inside a large range between $256.70 and $307.50 for the past several days. The bulls have pushed the price above the 50-day SMA but may face resistance at the downtrend line.
The gradually rising 20-day EMA and the RSI in the positive territory indicate advantage to buyers.
If the price turns down from the downtrend line but does not dip below the 20-day EMA, it will suggest that the sentiment has changed from selling on rallies to buying on dips.
That will increase the possibility of a break above the downtrend line. If that happens, the BNB/USD pair could rise to the stiff overhead resistance at $307.50.
On the contrary, if the price turns down and breaks below the 20-day EMA, it will suggest that bears continue to sell on rallies. The pair could then decline to the uptrend line. A break below this support could open the doors for a possible drop to the crucial support of $256.70.
XRP/USD Market Analysis
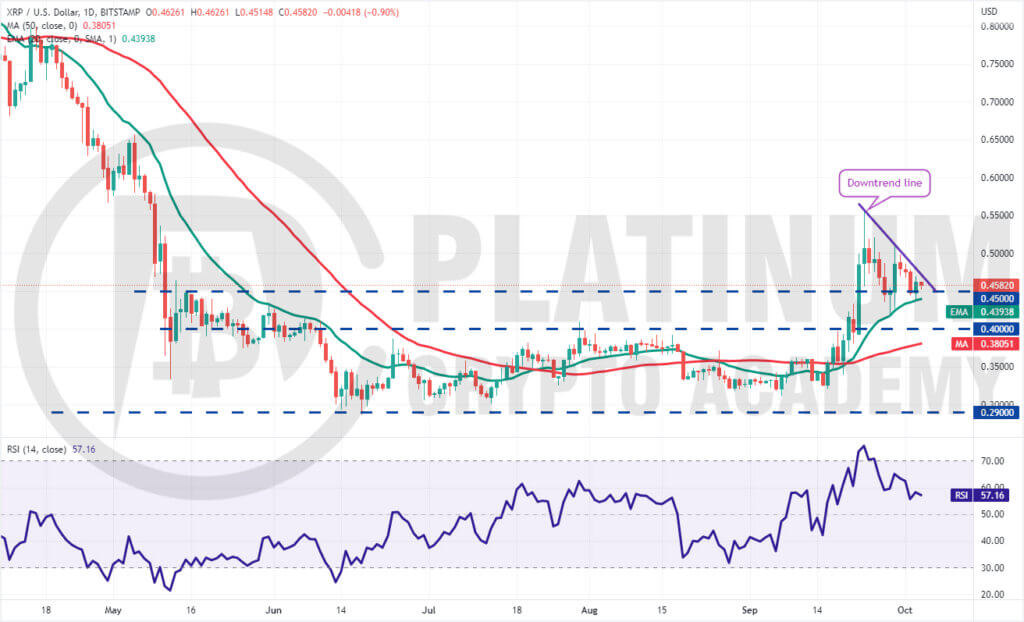
XRP dropped below the breakout level of $0.45 on September 27 but found support at the 20-day EMA on September 28. This is a positive sign as it suggests that bulls are buying on dips.
If buyers push the price above the downtrend line, the XRP/USD pair could rise to the overhead resistance zone between $0.52 and $0.56. The bulls will have to clear this zone to signal the resumption of the uptrend. The pair could then attempt a rally to $0.65.
On the other hand, if the price rises above the downtrend line but faces rejection at $0.56, it could suggest that the pair may remain range-bound for a few days.
If the price turns down and breaks below the 20-day EMA, the pair could slide to $0.40. This is an important level for the bulls to defend because a break and close below it could intensify selling. The pair could then drop to $0.34.
ADA/USD Market Analysis
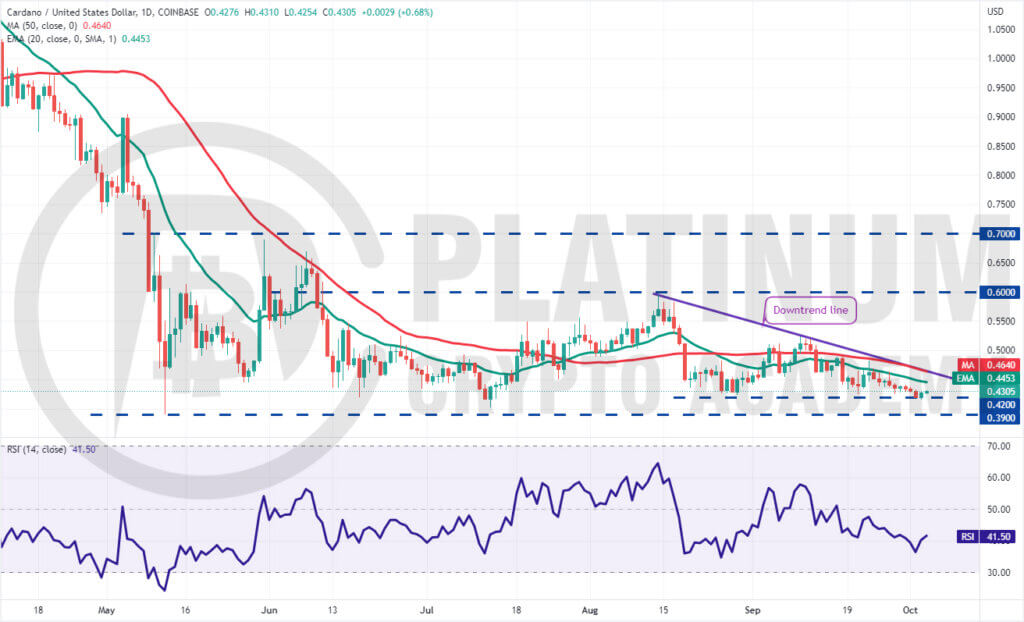
Cardano turned down from the 20-day EMA on September 27 and dropped to the strong support at $0.42 on October 2. The price rebounded off this level on October 3 but the recovery could face resistance at the 20-day EMA.
The downsloping moving averages and the RSI in the negative territory indicate that bears have the upper hand. If the price turns down from the 20-day EMA and breaks below $0.42, the ADA/USD pair could drop to the vital support of $0.39.
This is an important level to keep an eye on because a break below it could start the next leg of the downtrend.
Contrarily, if bulls thrust the price above the downtrend line, the developing descending triangle pattern will be invalidated. This may attract buyers and propel the price to the overhead resistance at $0.52. If this resistance is scaled, the rally could reach $0.60.
.
Hopefully, you have enjoyed today’s article for further coverage please check out our crypto Blog Page. Thanks for reading! Have a fantastic day! Live from the Platinum Crypto Trading Floor.
Earnings Disclaimer: The information you’ll find in this article is for educational purpose only. We make no promise or guarantee of income or earnings. You have to do some work, use your best judgement and perform due diligence before using the information in this article. Your success is still up to you. Nothing in this article is intended to be professional, legal, financial and/or accounting advice. Always seek competent advice from professionals in these matters. If you break the city or other local laws, we will not be held liable for any damages you incur.
")