
The S&P 500 index has fallen more than 2% in February but Bitcoin is still latching on to minor gains of 1%, with one more day of trading left in the month. The gains in February are much more muted compared to the previous month because of the hotter-than-expected inflation data in the past two weeks.
The latest data to rattle the markets was the core personal consumption expenditures price index, which increased 0.6% in January and was 4.7% higher from a year ago. Economists expected readings of 0.5% and 4.4%.
Consistently high inflation numbers have stoked fears that the United States Federal Reserve may have to continue with its rate hikes to bring inflation under control. The CME FedWatch Tool shows that the probability of a 50 basis points rate hike in the March meeting increased from 0% a month back to 24%. Though the majority still expect a 25 basis points rate increase, the uncertainty could deter the investors from waging large bets.
The absence of large ticket buying has sent the Bitcoin whale numbers, unique entities holding 1,000 Bitcoin or more, tumbling to 1,663, its lowest in three years. Glassnode data shows that at the peak, there were 2,161 whale entities in February 2021.
Mike McGlone, senior macro strategist at Bloomberg Intelligence, does not believe the bounce could continue further. He cautioned his Twitter followers that the $25,000 resistance on Bitcoin “may prove significant for all risk assets.”
Looks like the institutional investors also believe that $25,000 is unlikely to be crossed in a hurry in the near term. CoinShares data shows that short-Bitcoin products saw an inflow of $10 million in the past week. This suggests that investors expect a correction in the next few days.
What are the important levels on the downside that could attract buyers in Bitcoin and the major altcoins? Let’s study the charts to find out.
BTC/USD Market Analysis
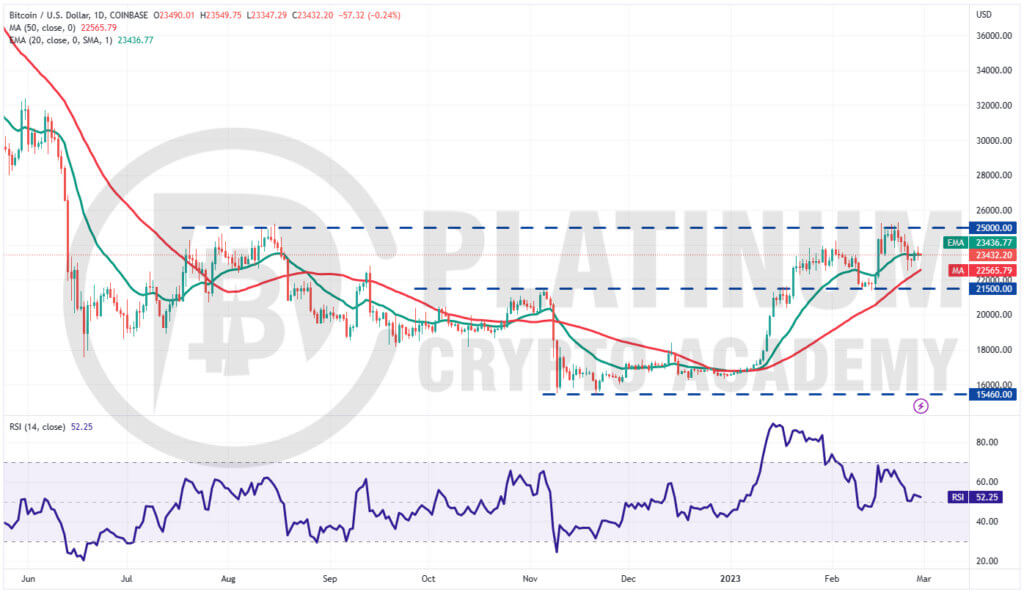
We warned traders in the previous analysis that bears are unlikely to give up and Bitcoin may plummet to the 50-day simple moving average (SMA) and that is how it played out.
The bulls pushed the price above $25,000 on February 21 but they could not sustain the higher levels. That may have tempted some short-term bulls to book profits and aggressive bears to establish short positions.
Continued selling pulled the price below the 20-day exponential moving average (EMA) on February 24 but a minor solace for the bulls is that the 50-day SMA did not break down.
The 20-day EMA has flattened out and the relative strength index (RSI) is near the midpoint, indicating a balance between supply and demand.
If the price breaks below the 50-day SMA, the pair could plummet to $21,500. This level is likely to attract strong buying by the bulls. If that happens, the BTC/USD pair may swing between $21,500 and $25,000 for a few days.
A break above $25,000 or below $21,500 could start a trending move. Until then, the price action is likely to remain random and volatile.
ETH/USD Market Analysis
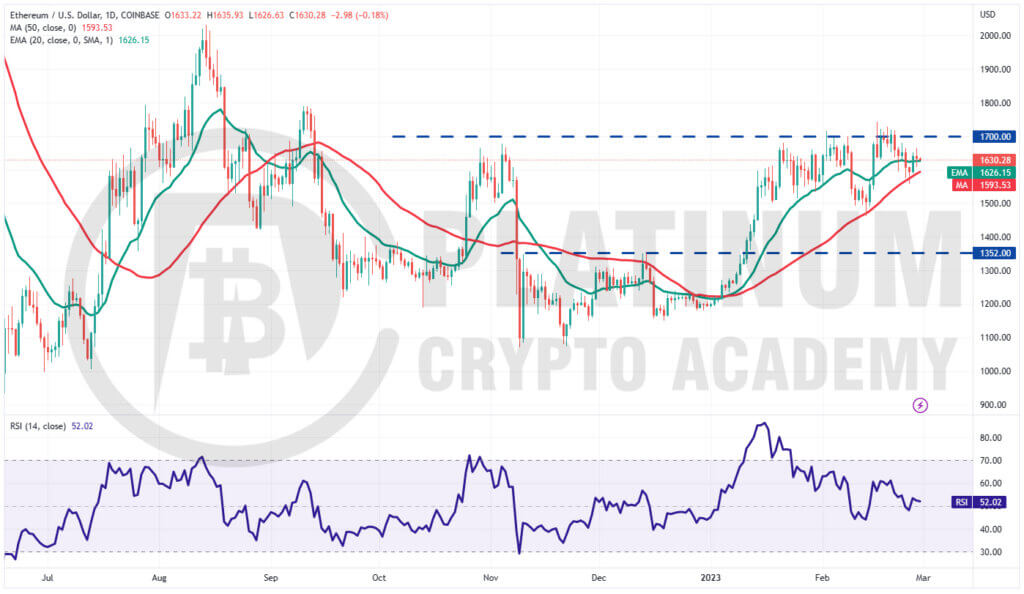
We warned traders in the previous analysis that bears are unlikely to give up and Bitcoin may plummet to the 50-day simple moving average (SMA) and that is how it played out.
The bulls pushed the price above $25,000 on February 21 but they could not sustain the higher levels. That may have tempted some short-term bulls to book profits and aggressive bears to establish short positions.
Continued selling pulled the price below the 20-day exponential moving average (EMA) on February 24 but a minor solace for the bulls is that the 50-day SMA did not break down.
The 20-day EMA has flattened out and the relative strength index (RSI) is near the midpoint, indicating a balance between supply and demand.
If the price breaks below the 50-day SMA, the pair could plummet to $21,500. This level is likely to attract strong buying by the bulls. If that happens, the BTC/USD pair may swing between $21,500 and $25,000 for a few days.
A break above $25,000 or below $21,500 could start a trending move. Until then, the price action is likely to remain random and volatile.
BNB/USD Market Analysis
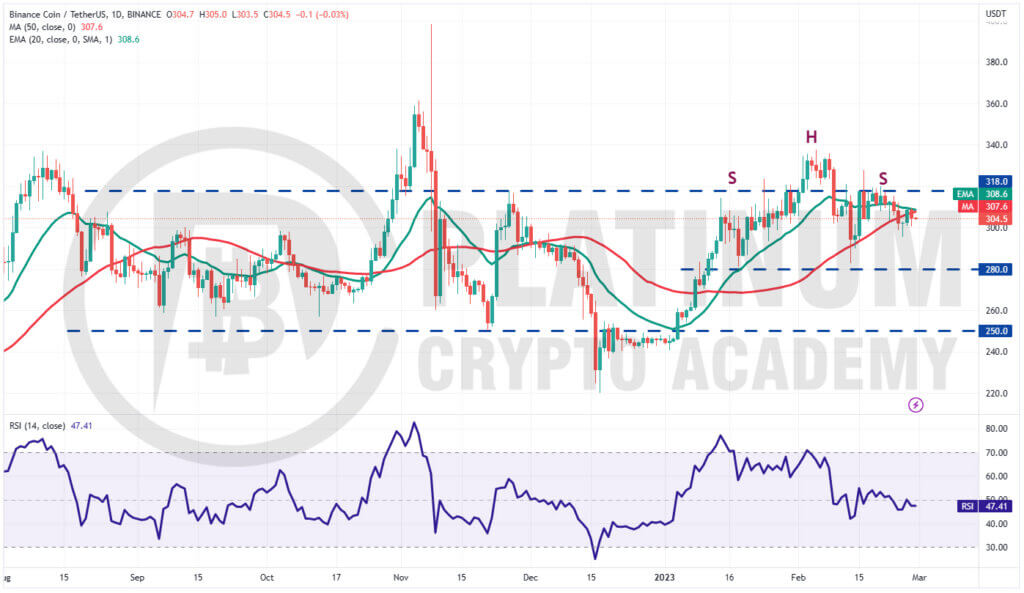
Binance Coin continues to trade inside the range between $280 and $318. The moving averages are on the verge of a bearish crossover, where the 20-day EMA is about to fall below the 50-day SMA.
This will signal a minor advantage to the bears. If the price turns down and breaks below $295, the pair could tumble to $280.
Buyers are expected to defend this level with all their might because if this support collapses, the BNB/USD pair will complete a bearish Head and Shoulders pattern. This negative setup has a pattern target of $220.
This negative view could invalidate in the near term if the price turns up from the current level and rises above $318. Such a move will suggest that bulls are back in the driver’s seat. That will increase the possibility of a break above $338. If that happens, the bearish H&S setup will be negated which is a bullish sign. The pair could then soar to $360 and later reach $400
XRP/USD Market Analysis
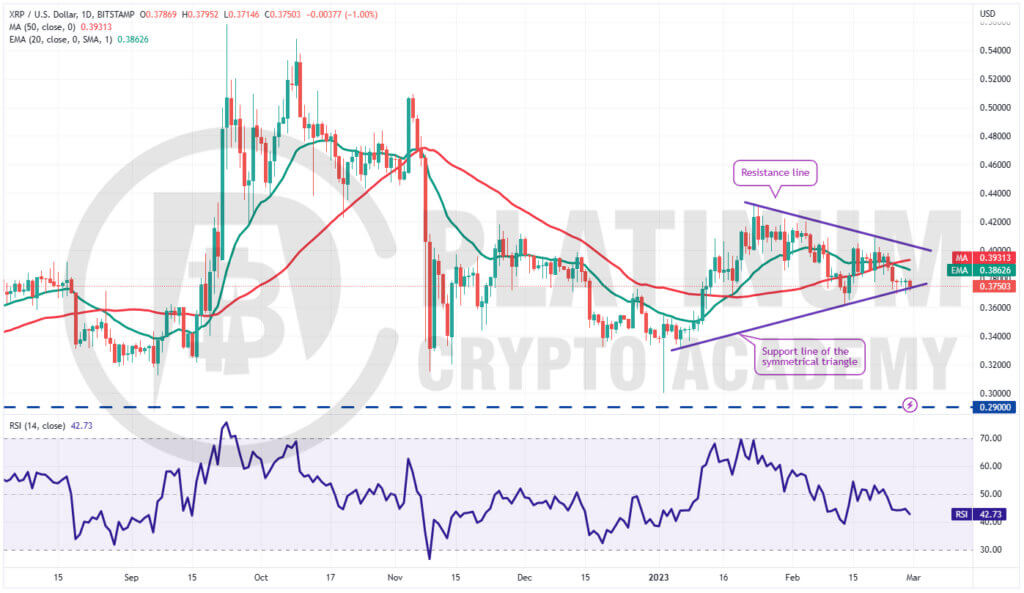
XRP broke below the moving averages on February 24 and reached the support line of the symmetrical triangle pattern. Though the bulls have held this level, they failed to achieve a strong rebound off it.
This suggests an absence of aggressive buying at the current level. The 20-day EMA has started to turn down and the RSI is in the negative territory, indicating that the path of least resistance is to the downside.
If the price dives below $0.36, the selling could accelerate and the XRP/USD pair may tumble toward $0.33. The zone between $0.33 to $0.30 is likely to act as solid support.
Contrary to this assumption, if the price turns up from the current level and rises above the 20-day EMA, the bulls may breathe a sigh of relief.
The short-term advantage will turn in favor of the buyers after they push and sustain the pair above the triangle.
ADA/USD Market Analysis
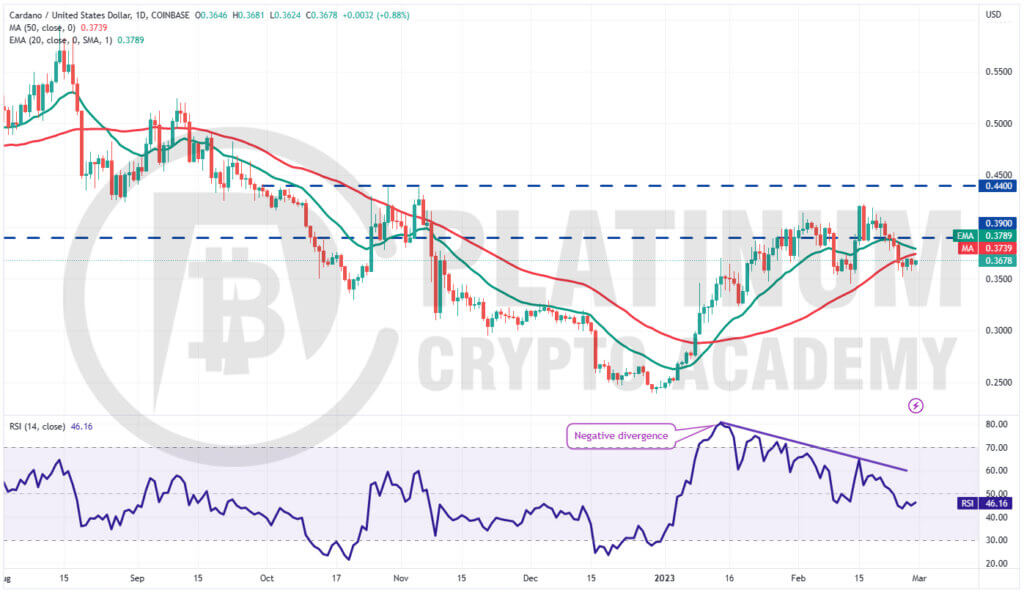
XRP broke below the moving averages on February 24 and reached the support line of the symmetrical triangle pattern. Though the bulls have held this level, they failed to achieve a strong rebound off it.
This suggests an absence of aggressive buying at the current level. The 20-day EMA has started to turn down and the RSI is in the negative territory, indicating that the path of least resistance is to the downside.
If the price dives below $0.36, the selling could accelerate and the XRP/USD pair may tumble toward $0.33. The zone between $0.33 to $0.30 is likely to act as solid support.
Contrary to this assumption, if the price turns up from the current level and rises above the 20-day EMA, the bulls may breathe a sigh of relief.
The short-term advantage will turn in favor of the buyers after they push and sustain the pair above the triangle.
Hopefully, you have enjoyed today’s article for further coverage please check out our crypto Blog Page. Thanks for reading! Have a fantastic day! Live from the Platinum Crypto Trading Floor.
Earnings Disclaimer: The information you’ll find in this article is for educational purpose only. We make no promise or guarantee of income or earnings. You have to do some work, use your best judgement and perform due diligence before using the information in this article. Your success is still up to you. Nothing in this article is intended to be professional, legal, financial and/or accounting advice. Always seek competent advice from professionals in these matters. If you break the city or other local laws, we will not be held liable for any damages you incur.
