
The aggressive rate hikes by the US Federal Reserve have been touted as one of the main reasons for the sharp fall in the price of risky assets. Market observers took a sigh of relief when Fed Chair Jerome Powell recently said while speaking at the Brookings Institution that the pace of rate hikes will slow down and it may happen “as soon as the December meeting.”
However, the nonfarm payroll increase of 263,000 in November was way ahead of economists’ estimates of 200,000. This shows that the Fed’s anti-inflation efforts have not produced the desired result. Analysts believe the latest data may force the Fed to continue with its aggressive rate hikes in the next meeting.
Galaxy Digital CEO Mike Novogratz, while speaking with Bloomberg, said the real reason for Bitcoin’s fall from $69,000 to near $20,000 was the central bank’s series of rate hikes. He added that the collapse of Three Arrows and BlockFi and Celsius which were either poorly run or fraudulently run also hurt confidence in the sector. Novogratz scaled back on his previous forecast of $500,000 by 2027, saying that it may take longer.
But venture capitalist Tim Draper remains unmoved by the FTX crisis or the Fed rate hikes. While speaking with CNBC, Draper said that Bitcoin will hit $250,000 by the middle of 2023. Draper believes that more women using Bitcoin will trigger the move higher because they control “80% of retail spending and only 1 in 7 bitcoin wallets are currently held by women.”
Draper’s enthusiasm is not shared by Standard Chartered, which said in a note titled “The financial-market surprises of 2023,” that Bitcoin could plummet to $5,000 in 2023. Eric Robertsen, global head of research at the bank, anticipates a liquidity crunch to hit crypto firms, resulting in “further bankruptcies and a collapse in investor confidence in digital assets.”
With such wide-ranging targets on Bitcoin, it becomes difficult for investors to take a call on whether to buy or sell. Let’s look at the charts and determine levels above which an up-move could begin.
BTC/USD Market Analysis
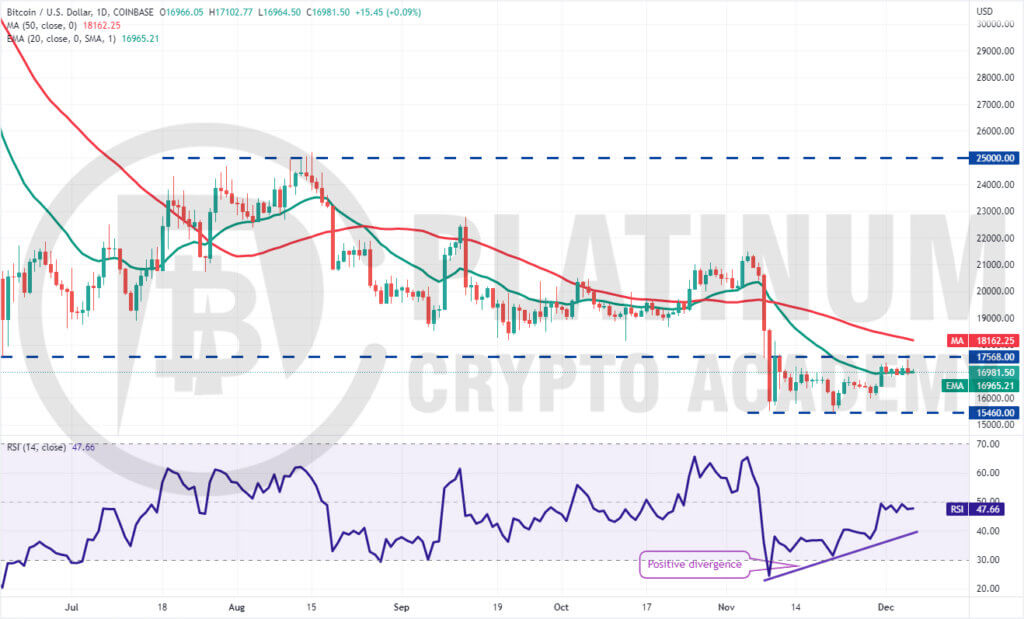
Bitcoin has been trading in the upper half of the range between $15,460 and $17,568. This suggests that buyers are not booking profits near the resistance as they anticipate a breakout.
The bulls tried to clear the overhead hurdle at $17,568 on December 5 but the bears held their ground. A minor positive is that the bulls have not allowed the price to break below $16,791. This increases the likelihood of a break above the overhead resistance.
If that happens, the BTC/USD pair could challenge the resistance at the 50-day simple moving average (SMA). This level may again act as a minor hurdle but it is likely to be crossed. The pair could then rally to $20,000 and later to $21,500.
A break and close above the 50-day SMA could offer a buying opportunity but until then, it may be better to watch from the sidelines.
If the price turns down and breaks below $16,791, it will suggest that the pair may extend its stay inside the range for a few more days. The flat 20-day exponential moving average (EMA) and the relative strength index (RSI) near the midpoint also hint at a range-bound action in the near term.
ETH/USD Market Analysis
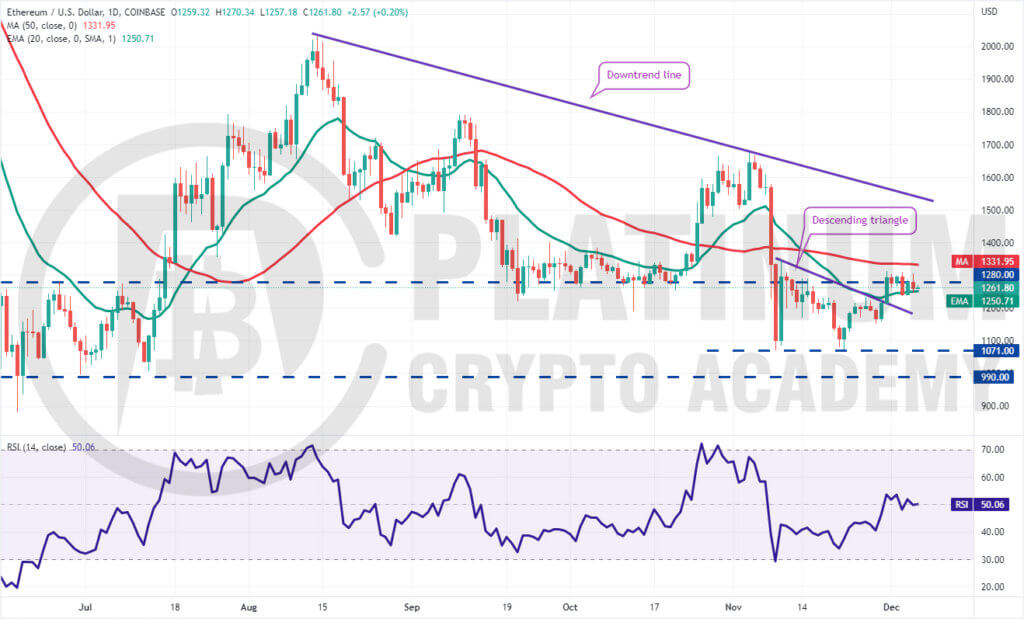
We said in our previous analysis that if Ether breaks out of the descending triangle, the price could rise to $1,280 and thereafter to $1,347 but the bears will try to defend this zone and that is what happened.
The ETH/USD pair broke above the triangle on November 30 and soared to $1,311 but the bulls could not continue the momentum and thrust the price above the 50-day SMA.
Nonetheless, it is encouraging to note that the bulls did not allow the price to plummet below the 20-day EMA. This suggests that traders are viewing the dips as a buying opportunity.
The price is stuck between the moving averages as both the bulls and the bears try to gain the upper hand.
If the price soars above the 50-day SMA, the pair could pick up momentum and rally toward the downtrend line and then to $1,700. Alternatively, if the price plummets below the 20-day EMA, the pair could slide to $1,150 and thereafter to $1,071.
BNB/USD Market Analysis
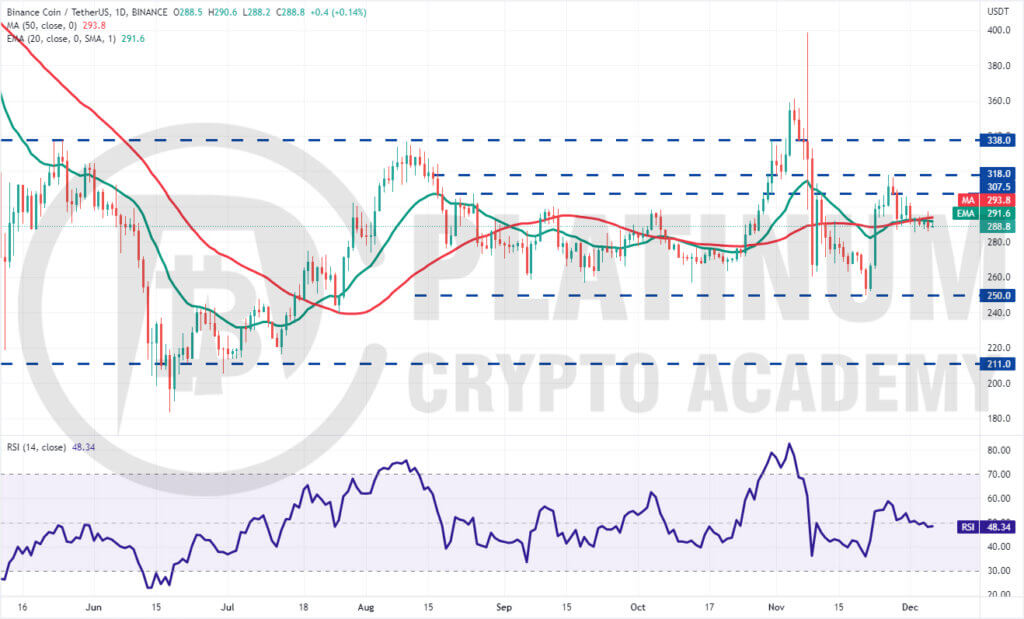
Binance Coin bounced off the moving averages on November 29 but the bulls could not overcome the barrier at $307.50. This may have tempted short-term bulls to book profits and aggressive bears to establish short positions. This pulled the price below the moving averages on December 5.
If the price breaks below $285, the BNB/USD pair could gradually decline toward $275. That could keep the pair stuck inside a large range between $250 and $318 for some time.
The flattish moving averages and the RSI near the midpoint indicate a consolidation in the near term. The advantage could tilt in favor of the bulls if they drive the price above $318. Buyers may again face strong resistance at $338 but if this level is crossed, the pair could soar to $360.
XRP/USD Market Analysis
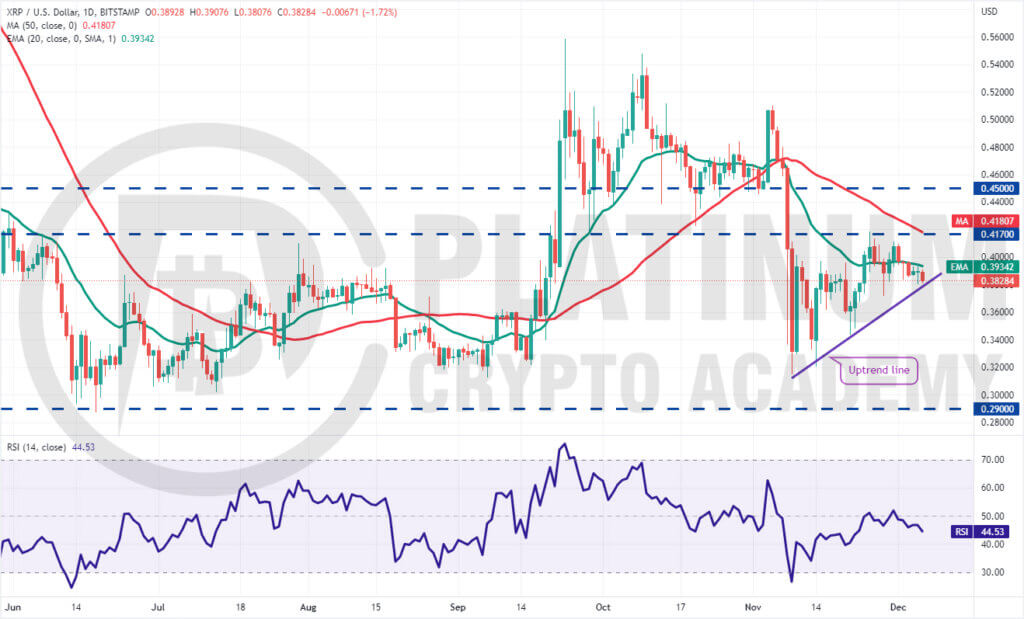
XRP once again turned down from the overhead resistance of $0.41 on November 30. This suggests that the bears are defending the level with vigor. The XRP/USD pair turned down on Dec. 1 and slipped below the 20-day EMA.
The bulls are trying to defend the uptrend line. If the price turns up from the current level and breaks above the 20-day EMA, the bulls will make one more attempt to propel the pair above $0.41.
If they succeed, it will complete a bullish ascending triangle pattern. The pair could then pick up momentum and rally to $0.45 and thereafter to $0.51.
On the other hand, if the price continues lower and breaks below the uptrend line, the next stop could be $0.37 and then $0.34. Such a move could keep the pair range-bound between $0.32 and $0.41 for a few days.
ADA/USD Market Analysis
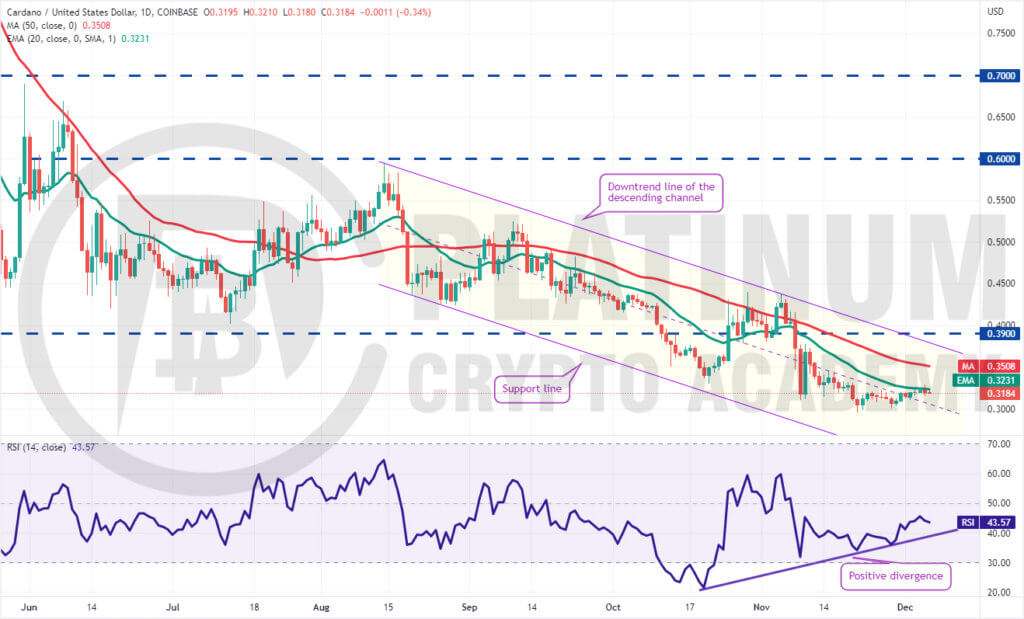
Cardano remains in a downtrend. Attempts by the bulls to start a recovery met with stiff resistance from the bears at the 20-day EMA. This suggests that the sentiment remains negative and traders are selling on rallies.
A small advantage in favor of the bulls is that they have not given up much ground from the 20-day EMA. This suggests that the buyers are not dumping their positions yet and may again try to kick the price above the 20-day EMA.
If they can pull it off, the ADA/USD pair may rally to the 50-day SMA and eventually to the downtrend line of the descending channel.
This positive view could invalidate in the near term if the price turns down and breaks below $0.30. The pair could then resume its downtrend and drop to the support line of the channel.
Hopefully, you have enjoyed today’s article for further coverage please check out our crypto Blog Page. Thanks for reading! Have a fantastic day! Live from the Platinum Crypto Trading Floor.
Earnings Disclaimer: The information you’ll find in this article is for educational purpose only. We make no promise or guarantee of income or earnings. You have to do some work, use your best judgement and perform due diligence before using the information in this article. Your success is still up to you. Nothing in this article is intended to be professional, legal, financial and/or accounting advice. Always seek competent advice from professionals in these matters. If you break the city or other local laws, we will not be held liable for any damages you incur.
")