
After two weeks of decline, Bitcoin made a strong comeback last week and rose more than 11%. Although the consumer price index data released on February 14 was hotter than expected, the cryptocurrency markets shrugged off the negative news and continued their journey higher. When the price rises after adverse news flow, it is a sign that the undercurrent is bullish and investors believe that the worst is over.
Retail traders seem to have made the most of Bitcoin’s sharp drop in price during the bear phase. The number of wallets holding more than one Bitcoin soared from 788,000 in February 2020 to 982,000, according to Glassnode data. In comparison, the number of Bitcoin whales, holding 1,000 or more Bitcoin, dropped to 2,027 on February 19, the lowest since August 2019.
The strong recovery in Bitcoin has improved investor sentiment, sending the Crypto Fear & Greed Index into the “greed” zone. The reading of 62 recorded on February 16 was the highest since November 2021. While improving sentiment is a positive sign for the long term, euphoria in the short term could lead to a correction, shaking out the weak hands.
The two things that pose a risk to the crypto rally in the near term are Fed’s actions and the regulatory crackdown. The U.S. Securities and Exchange Commission has not initiated action against Paxos but if they do, it will not only impact stablecoin Binance USD but also other stablecoins in the crypto space. Market observers will be keenly watching for the release of the FOMC minutes of the January meeting on February 22 as that could give an insight into the future rate hike trajectory.
Pullbacks are a part and parcel of any uptrend. Once investors determine that a bottom has been made and a new up-move has started, then pullbacks could be used for building up positions in the desired cryptocurrency.
Could Bitcoin and the major altcoins continue their uptrend or is it time to book profits? Let’s study the charts to find out.
BTC/USD Market Analysis
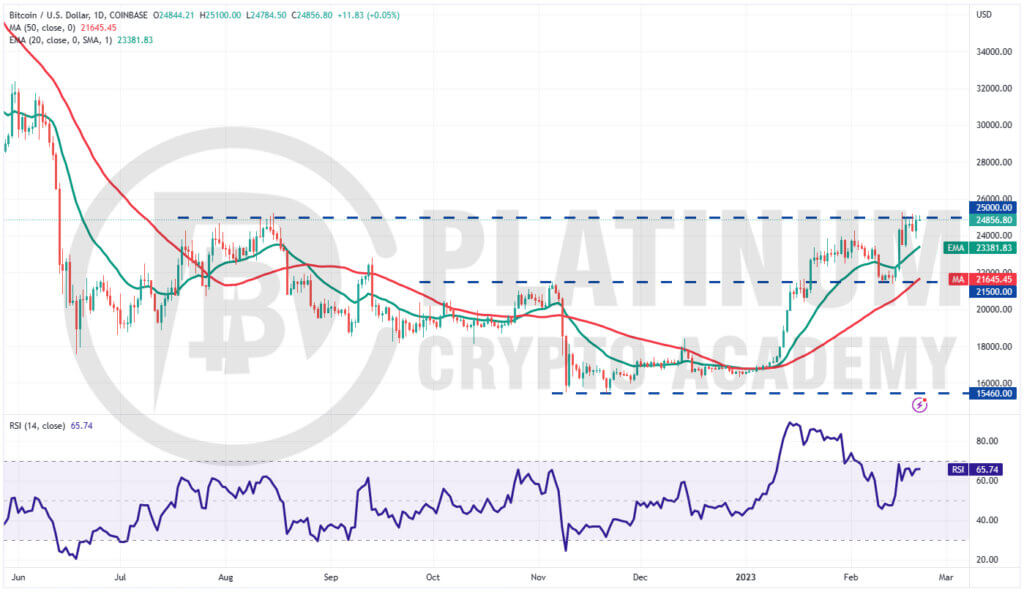
Bitcoin turned up from $21,500 on February 14, indicating that bulls had flipped the level into support. The BTC/USD pair picked up momentum after breaking out of the 20-day exponential moving average (EMA).
Buyers pushed the price above $25,000 on several occasions in the past few days but they haven’t been able to sustain the higher levels. This shows that the bears are protecting the level with vigor.
A minor positive in favor of the bulls is that they have not allowed the price to give up much ground from $25,000. This indicates that traders are holding on to their positions as they anticipate the rally to continue.
If bulls push and sustain the price above $25,000, the pair could signal a potential trend change. But the bears are unlikely to surrender easily.
They will try to trap the aggressive bulls by pulling the price back below the 20-day EMA. If they manage to do that, the pair could witness a correction to the 50-day simple moving average (SMA).
Contrarily, if bulls successfully hold $25,000 during the next retest, the pair could soar to $31,000.
ETH/USD Market Analysis
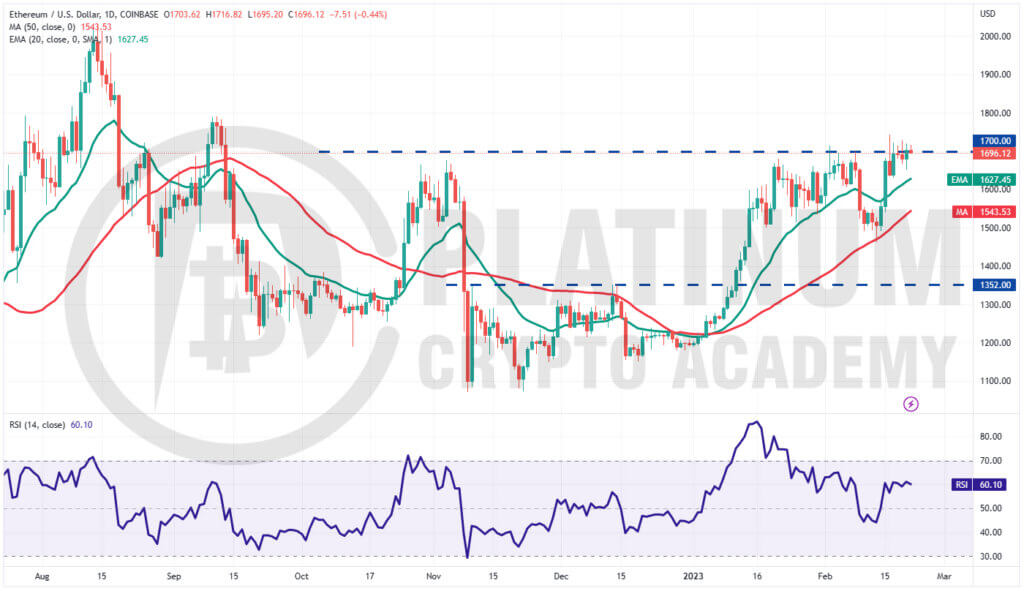
We said in our previous analysis that if bulls push the price above the 20-day EMA, Ether could rally to $1,700 and that is what happened. The ETH/USD pair broke above the 20-day EMA on February 15 and climbed above $1,700 on February 16.
However, the long wick on the day’s candlestick shows that the bears are fiercely guarding the $1,700 level. The bulls made several attempts to clear the overhead obstacle but the bears stood their ground.
The rising moving averages and the relative strength index (RSI) in the positive territory suggest the path of least resistance is to the upside.
If bulls drive the price above $1,742, the pair could start its northward journey toward the psychological level of $2,000. There is a minor resistance at $1,800 but it is likely to be crossed.
This positive view will be invalidated in the near term if the price turns down and plunges below the 20-day EMA. That could tempt several short-term traders to book profits and the pair may then plummet to $1,500.
BNB/USD Market Analysis
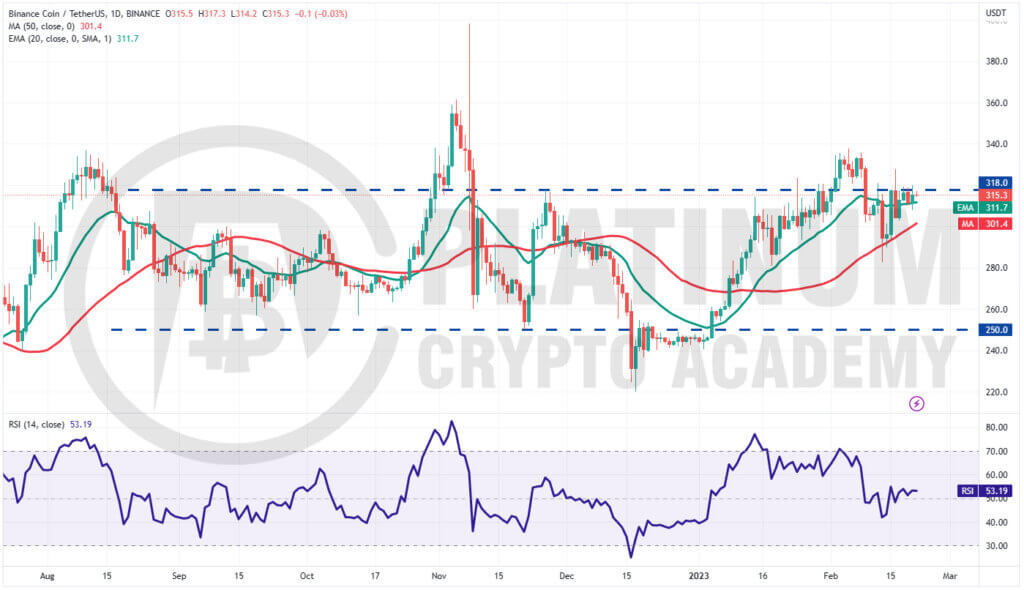
We projected in the previous analysis that Binance Coin may extend its stay inside the $250 to $318 range for a few days and that is how it has been.
The BNB/USDT pair rebounded off the 50-day simple moving average (SMA) on February 15 and reached the overhead resistance of $318.
Buyers tried to strengthen their position on February 16 by pushing the price above $318 but the bears sold at higher levels as seen from the long wick on the day’s candlestick.
Although the flattish 20-day EMA and the RSI near the midpoint indicate a balance between supply and demand, the tight consolidation near the overhead resistance of $318 suggests a slight advantage to the bulls.
If the price sustains above $318, the pair could rise to $340 and thereafter to $360. The bears are expected to defend this level aggressively.
On the downside, a break below the 50-day SMA could open the doors for a retest of the support at $280.
XRP/USD Market Analysis
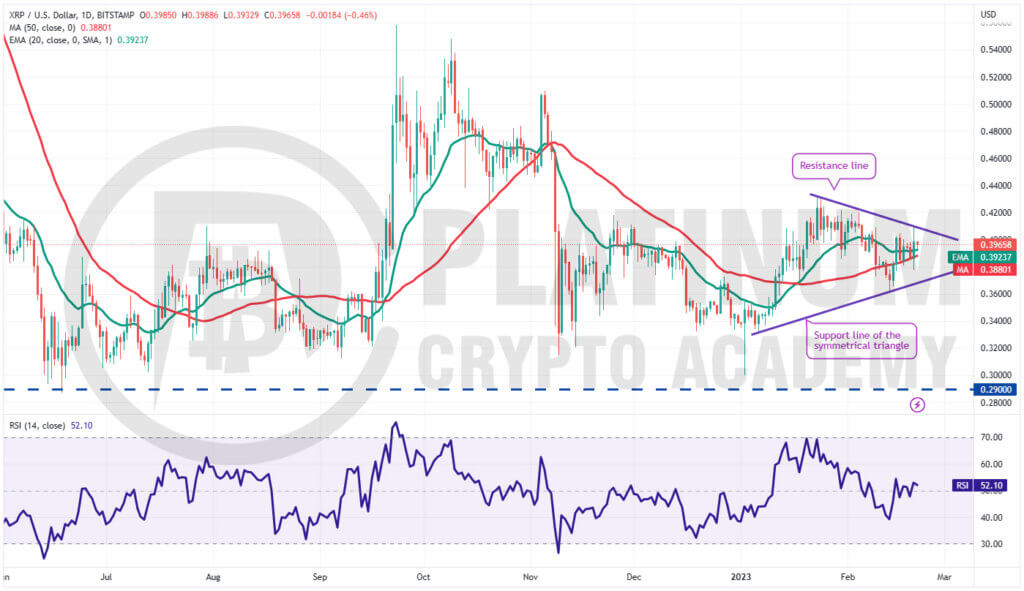
XRP is stuck inside a symmetrical triangle pattern, indicating indecision among the bulls and the bears. The flattish 20-day EMA and the RSI near the midpoint also do not give a clear advantage either to the bulls or the bears.
The price action inside the triangle is usually random and volatile. If bulls propel the price above the resistance line of the triangle, the XRP/USD pair could rise to $0.43. This level may again attract strong selling by the bears.
Conversely, if the price turns down from the current level and breaks below the moving averages, the bears will fancy their chances.
A break and close below the triangle and the $0.36 support could clear the path for a possible retest of $0.33.
ADA/USD Market Analysis
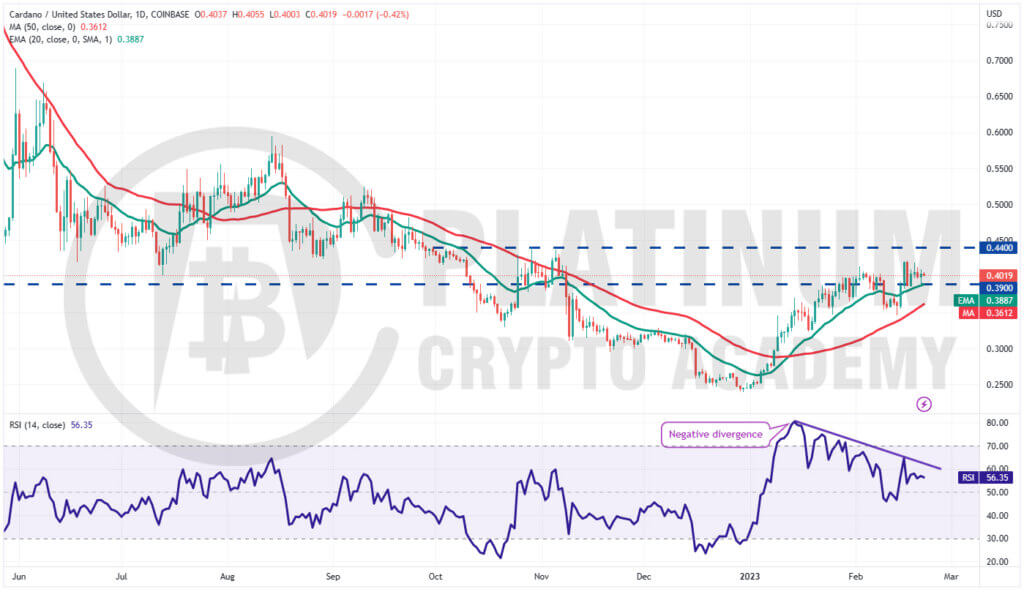
Cardano has been trading between $0.39 and $0.44 since February 15. This suggests that traders are trying to flip $0.39 into support but the negative divergence on the RSI warns that the bullish momentum could be weakening.
If the price breaks below the 20-day EMA, the ADA/USD pair could slip to the 50-day SMA. This is an important level for the bulls to defend because a break below it could increase the risk of a drop to $0.32.
On the upside, the bulls will have to thrust the price above the solid resistance at $0.44. If they did that, the pair could start its northward march toward $0.52.
Hopefully, you have enjoyed today’s article for further coverage please check out our crypto Blog Page. Thanks for reading! Have a fantastic day! Live from the Platinum Crypto Trading Floor.
Earnings Disclaimer: The information you’ll find in this article is for educational purpose only. We make no promise or guarantee of income or earnings. You have to do some work, use your best judgement and perform due diligence before using the information in this article. Your success is still up to you. Nothing in this article is intended to be professional, legal, financial and/or accounting advice. Always seek competent advice from professionals in these matters. If you break the city or other local laws, we will not be held liable for any damages you incur.
")