
Bitcoin waited for cues at the Oct. 24 Wall Street open as expectations of a breakout ran high after the pair BTC/USD hit weekly highs of $19,700 overnight. Despite what Michaël van de Poppe, CEO and founder of trading firm Eight, called “way worse than expected” manufacturing data from the United States, Bitcoin suffered from a declining trajectory on the day.
The 10-year Treasury yield in the United States rose to its highest level since 2008. Although this type of rally is usually negative for risky assets, the U.S. stock markets recovered ground after the Wall Street Journal reported that some officials of the Federal Reserve were concerned about the pace of the rate hikes and the risks of over-tightening.
While it is widely accepted that the U.S. will enter a recession, a debate rages on about how long it could last. On that, Tesla CEO Elon Musk recently said on Twitter that the recession could last “probably until spring of ‘24,” and added that it would be nice to spend “one year without a horrible global event.”
The short-term uncertainty in cryptocurrencies does not seem to have altered the long-term view of institutional investors. BNY Mellon CEO Robin Vince said that a survey commissioned by the bank showed that 91% of institutional investors were keen to invest in some type of tokenized assets in the next few years. Although some believe that institutions have been slow to move into crypto, Coinbase senior adviser John D’Agostino thinks otherwise. While speaking in an interview with SALT, D’Agostino said that “institutional inertia is a very real thing” but in the case of digital assets, institutional adoption has been “moving very, very fast.”
What are the important support levels the bulls need to defend to avoid a collapse in Bitcoin and select altcoins? Let’s study the charts of the top 5 cryptocurrencies to find out.
BTC/USD Market Analysis
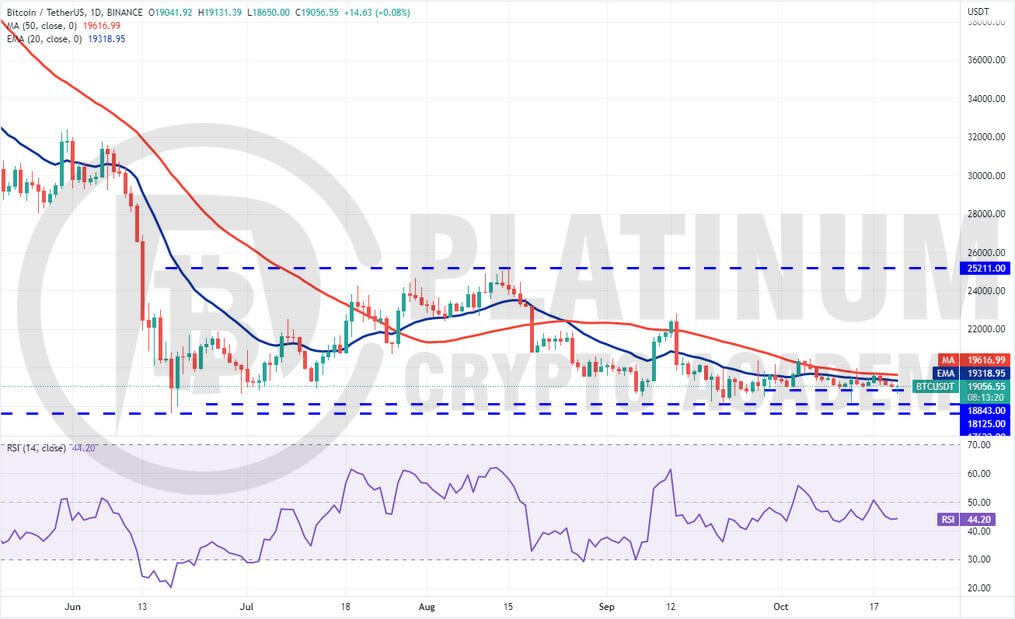
Bitcoin bounced off the nearest support at $18,843 on Oct. 20 but the bulls could not overcome the obstacle at the 20-day EMA ($19,318). This suggests that the bears want to further cement their hold.
If the price slips and sustains below $18,843, the BTC/USDT pair could drop to $18,125. The bulls are expected to defend the zone between $18,125 and $17,622 vigorously because if they fail to do that, the pair could resume its downtrend. The next stop on the downside could be $15,750.
The long tail on the Oct. 21 candlestick shows that buyers purchased the dip below $18,843. They will try to propel the price above the moving averages. A break above the 50-day SMA ($19,616) could clear the path for a possible rally to $20,500. This is an important level to keep an eye on because a break above it could signal the start of a strong recovery to $22,800 and then $25,211.
ETH/USD Market Analysis
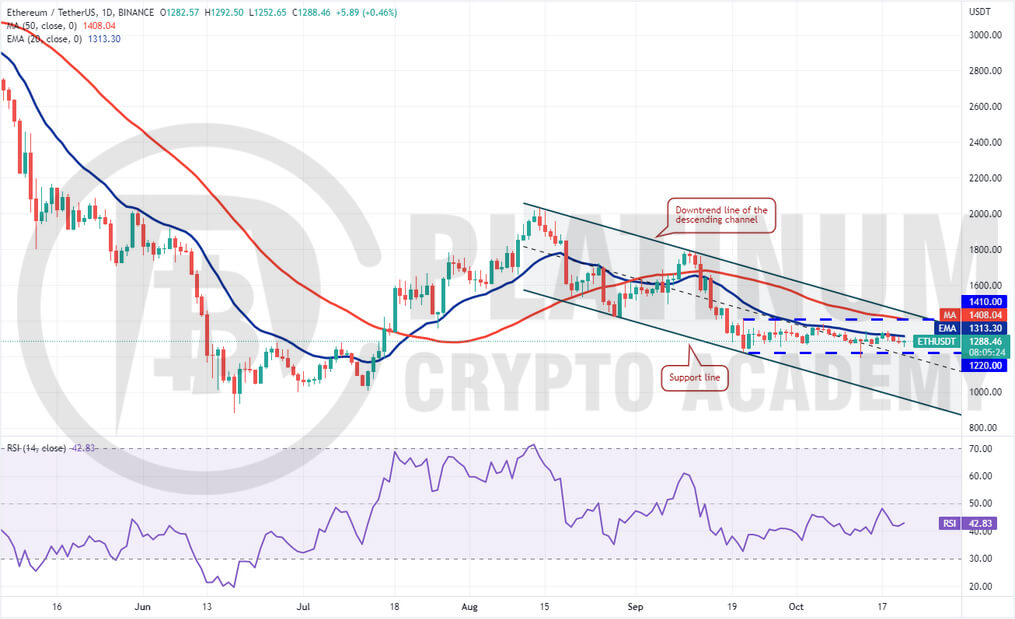
Ether is struggling to rise above the 20-day EMA ($1,313) but a minor positive is that the bulls have not allowed the price to sustain below the immediate support at $1,263.
If the price turns up from the current level and breaks above the 20-day EMA, the ETH/USDT pair could rally to the downtrend line of the descending channel. Buyers will have to thrust the price above this resistance to indicate the start of a new up-move.
On the contrary, if the price continues lower and breaks below the $1,220 to $1,190 support zone, the selling could intensify and the pair could drop to the psychological level at $1,000 and then to the support line of the channel.
BNB/USD Market Analysis
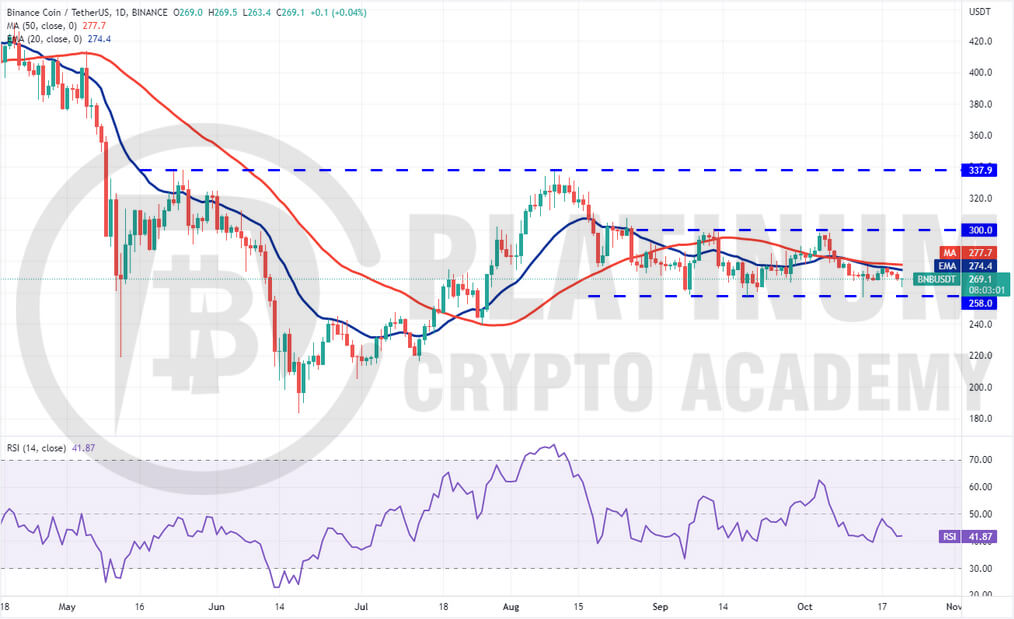
BNB has been trading below both the moving averages and the bears are trying to sink the price to the support of the range at $258.
The gradually downsloping 20-day EMA ($274) and the relative strength index (RSI) in the negative territory indicate advantage to bears. The $258 level is likely to witness a tough battle between the bulls and the bears. If sellers come out on top, the BNB/USDT pair could drop to $216.
Instead, if the price turns up from the current level or the $258 support, the bulls will try to push the pair above the moving averages. If that happens, the pair could attempt a rally to $300. This level is likely to act as a strong barrier but if bulls overcome it, the pair could rally to $338.
XRP/USD Market Analysis
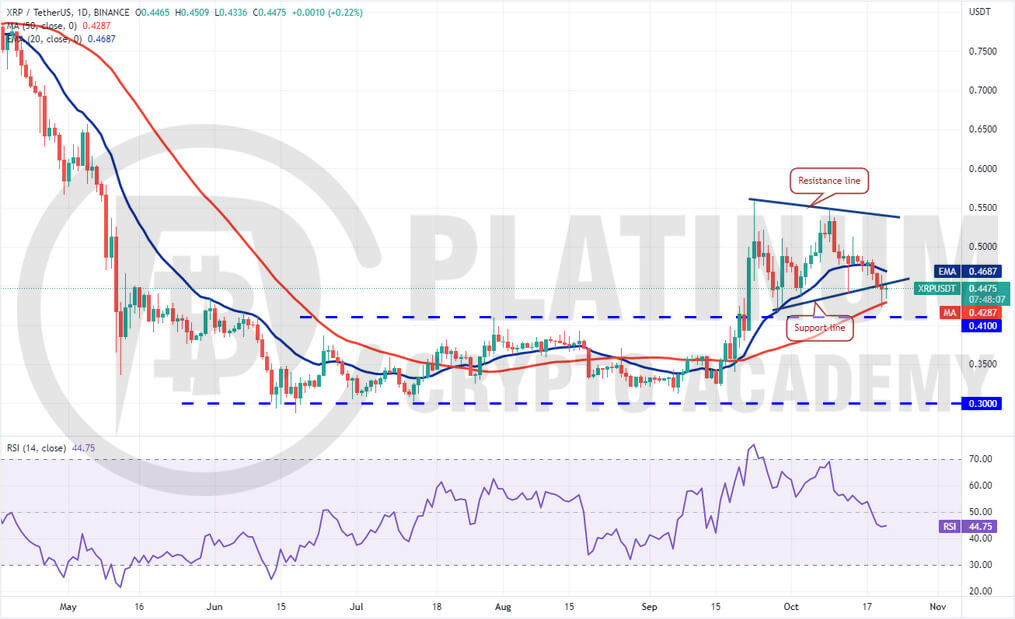
XRP plunged below the developing symmetrical triangle pattern on Oct. 20 but the long tail on the candlestick shows that the bulls are buying the dips to the 50-day SMA ($0.43). Buyers again defended the 50-day SMA on Oct. 21.
The 20-day EMA ($0.46) has started to turn down and the RSI has slipped into negative territory, indicating that the bears have a slight edge. If the price turns down from the current level or the 20-day EMA, the bears will try to pull the XRP/USDT pair to the breakout level of $0.41. This level is likely to attract strong buying. On the upside, a break and close above the 20-day EMA will be the first indication of strength. The pair could then rise to $0.51 and later to the resistance line. A break and close above the triangle could improve the prospects of the resumption of the uptrend
ADA/USD Market Analysis
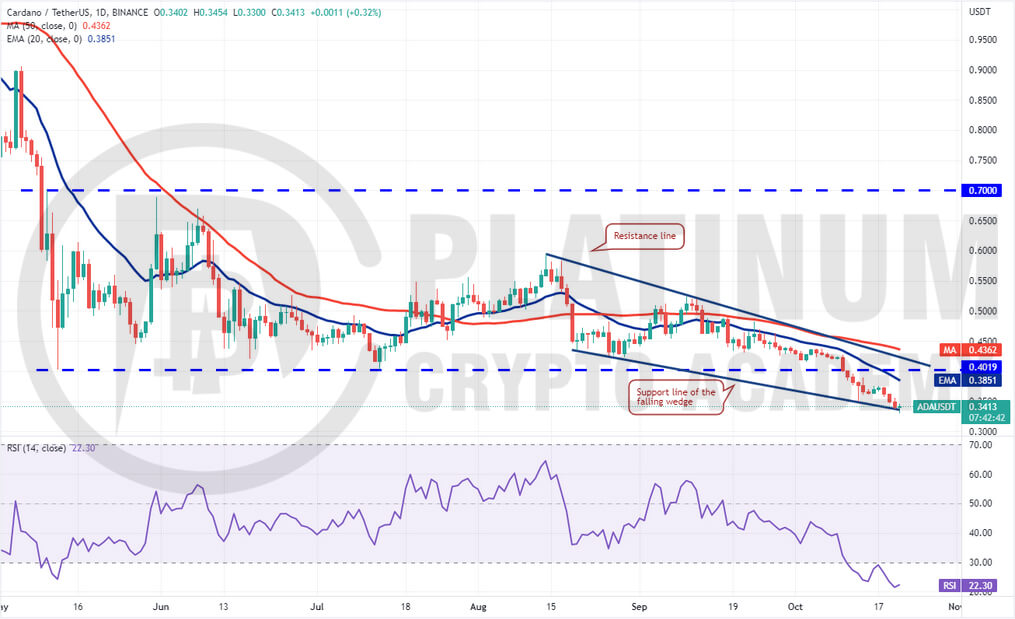
Cardano has been in a downtrend for the past several days. After a two-day relief rally, the selling resumed on Oct. 18 and the bears have pulled the price to the support line of the wedge.
The sharp selling of the past few days has sent the RSI tumbling deep into the oversold territory. This suggests that the selling may have been overdone in the near term and a relief rally or consolidation may be around the corner.
If the price rebounds off the support line, the ADA/USDT pair will attempt to rise to $0.36 and then to the 20-day EMA ($0.38). A break above this level will be the first indication that the bears may be losing their grip.
On the downside, if the price breaks below the support line, the selling could further pick up momentum and the pair could plummet to $0.30.
Hopefully, you have enjoyed today’s article for further coverage please check out our crypto Blog Page. Thanks for reading! Have a fantastic day! Live from the Platinum Crypto Trading Floor.
Earnings Disclaimer: The information you’ll find in this article is for educational purpose only. We make no promise or guarantee of income or earnings. You have to do some work, use your best judgement and perform due diligence before using the information in this article. Your success is still up to you. Nothing in this article is intended to be professional, legal, financial and/or accounting advice. Always seek competent advice from professionals in these matters. If you break the city or other local laws, we will not be held liable for any damages you incur.
