
During bear markets, every bit of negative news, whether directly connected or not, tends to scare away investors. The protests in China against Covid restrictions are the latest to spook the crypto markets. The sentiment soured further when crypto firm BlockFi filed for Chapter 11 bankruptcy protection, the latest calamity of the FTX collapse.
Many fear that FTX’s downfall could impact the whole crypto ecosystem adversely. While that may be true in the short term, Chainalysis research lead Eric Jardine, said in a Twitter thread on November 24 that “Mt. Gox was a bigger industry player than FTX at the time of its collapse. That’s good news since Mt. Gox’s collapse didn’t destroy crypto.” He expects the crypto industry to bounce back from this crisis, “stronger than ever.”
According to the website 99bitcoins, there have been 466 times when people “with a notable following or a site with substantial traffic” said that Bitcoin will be worthless. The latest obituary was written by renowned author Chetan Bhagat in The Times of India in mid-November.
However, that is unlikely to happen. Mobius Capital Partners Mark Mobius said in an interview with Bloomberg that Bitcoin could plunge to $10,000 and that it was “too dangerous” to invest either his own money or his clients’ in it. But Mobius added that “crypto was here to stay” as many still believe in it.
Retail investors have been on a buying spree during the recent dip in Bitcoin. Glassnode data shows that Bitcoin addresses holding less than 1 Bitcoin, also known as Bitcoin shrimps, have added 96,200 Bitcoin since the fall of FTX. Another category of investors known as crabs, who hold between 1 to 10 Bitcoin, have bought 191,600 Bitcoin in the past 30 days.
Interestingly, the whales, holding more than 1,000 Bitcoin in their wallets, have not dumped their positions. In the past month, whales who own a combined 6.3 million Bitcoin have only sent 6,500 Bitcoin to the crypto exchanges.
The big question is whether to buy now or wait for a deeper correction. Read our analysis to find out.
BTC/USD Market Analysis
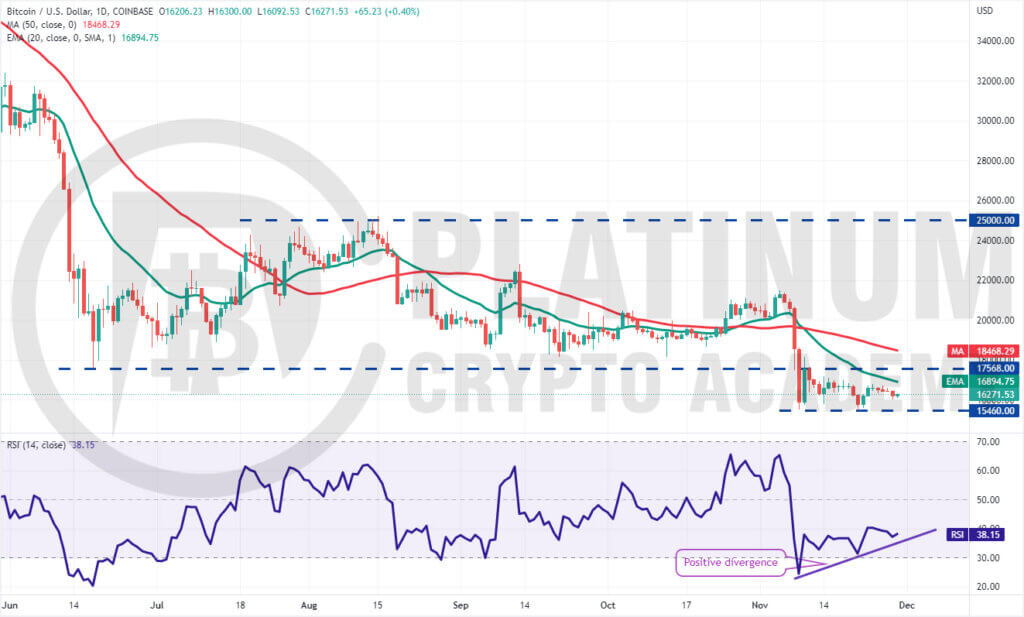
Bitcoin is consolidating between $15,460 and $17,568 for the past few days. This suggests a state of indecision between the bulls and the bears. The indicators are also giving mixed signals.
While the downsloping moving averages indicate advantage to sellers, the positive divergence on the relative strength index (RSI) suggests that the bearish momentum could be weakening.
It is difficult to predict the direction of the breakout from the range. If the price turns down from the 20-day exponential moving average (EMA) and plummets below $15,460, the next leg of the downtrend could begin. The BTC/USD pair could then drop to $13,456 and later to $12,000.
Conversely, if bulls push the price above the 20-day EMA, the pair could attempt a break above $17,568.
The zone between $17,568 and the 50-day simple moving average (SMA) may act as a major barrier but if bulls overcome it, the pair could surge toward $21,478. Such a move will suggest that the downtrend could be over.
Traders may consider long positions on a break above the 50-day SMA but until then, it is better to remain on the sidelines.
ETH/USD Market Analysis
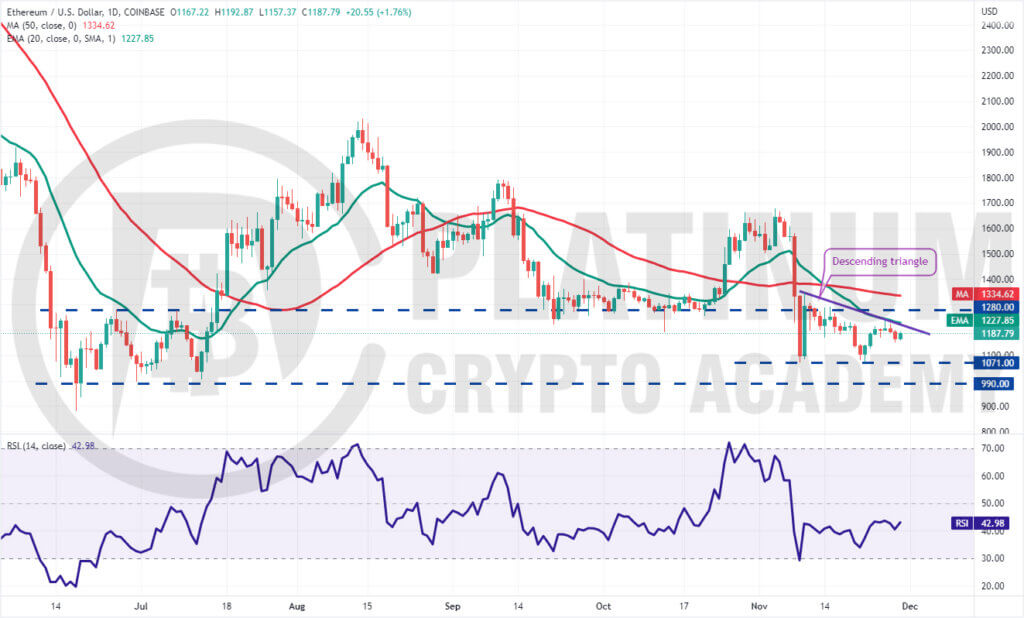
Ether bounced off the support near $1,071 but the bulls could not push the price above the 20-day EMA on November 26. This suggests that bears are active at higher levels. The sellers will try to sink the price to the strong support at $1,071.
The price action of the past few days has formed a descending triangle pattern which will complete on a break and close below $1,071. This negative setup has a target objective of $795.
Contrary to this assumption, if buyers thrust the price above the triangle, it will invalidate the bearish setup. The ETH/USD pair could then rise to $1,280 and thereafter to $1,347.
The bears may again try to stall the recovery in this zone but if bulls pierce the resistance, the up-move could pick up momentum. The pair could first rally to $1,500 and subsequently to $1,700.
BNB/USD Market Analysis
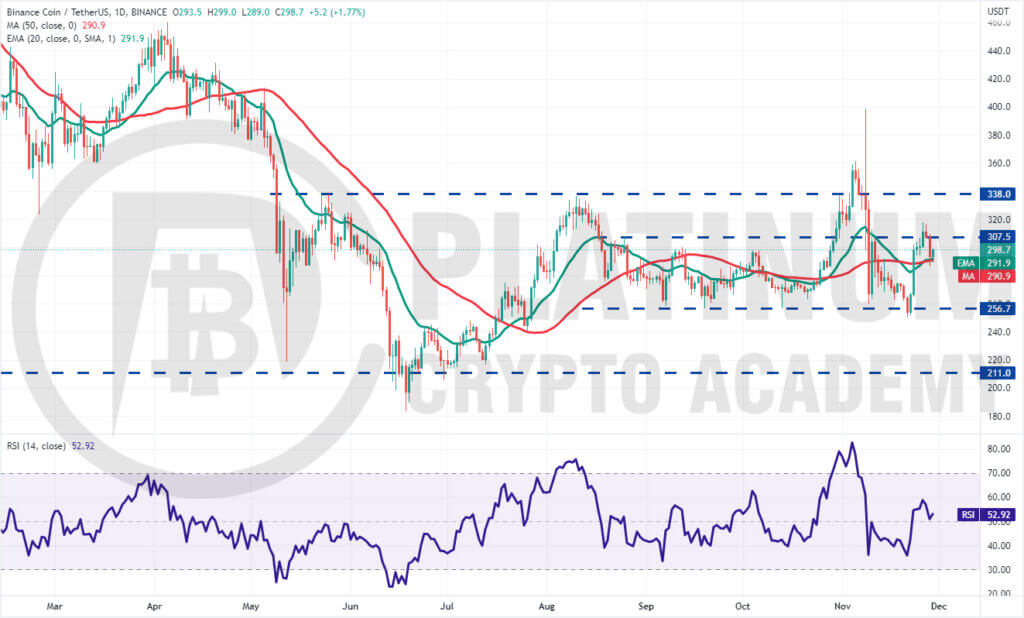
Binance Coin closed below $256.70 on November 21 but that proved to be a bear trap. The price turned up on November 22 and climbed back above $256.70. The momentum picked up on November 23 and the BNB/USD pair jumped above the moving averages.
Although buyers cleared the overhead hurdle at $307.50 on November 26, they could not build upon this strength. The bears pulled the price back below $307.50 on November 28. This suggests that the bears have not yet surrendered.
On the downside, the bulls are attempting to defend the moving averages. A strong rebound off this level will increase the likelihood of a rally to $338. Buyers will have to overcome this roadblock to signal a potential change in trend. Conversely, if the price turns down and breaks below the moving averages, it will suggest that the pair may remain stuck in the range between $256.70 and $307.50 for some more time.
XRP/USD Market Analysis
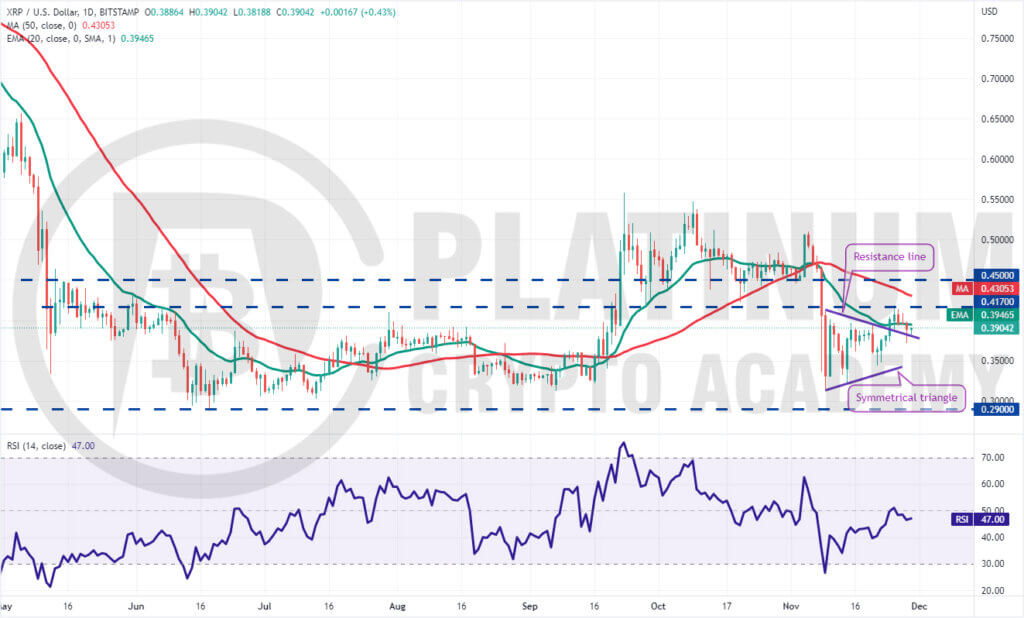
XRP turned up from $0.34 on November 21 and broke above the symmetrical triangle on November 24. This was the first indication that the uncertainty among the bulls and the bears had resolved to the upside.
However, buyers failed to sustain the momentum and drive the price above $0.41. The bears took advantage of this situation and pulled the price back below the 20-day EMA on November 28.
A minor positive is that the bulls are trying to flip the resistance line of the triangle into support. If they succeed, the possibility of a break above $0.41 increases. The pair could then rally to $0.45.
This level may again act as a resistance but if bulls kick the price above it, the XRP/USD pair could rise to $0.55.
Alternatively, if the price breaks back into the triangle, it will suggest that the pair may remain range-bound between $0.41 and $0.31 for some time. The flattish 20-day EMA and the RSI just below the midpoint also suggest a consolidation in the near term.
ADA/USD Market Analysis
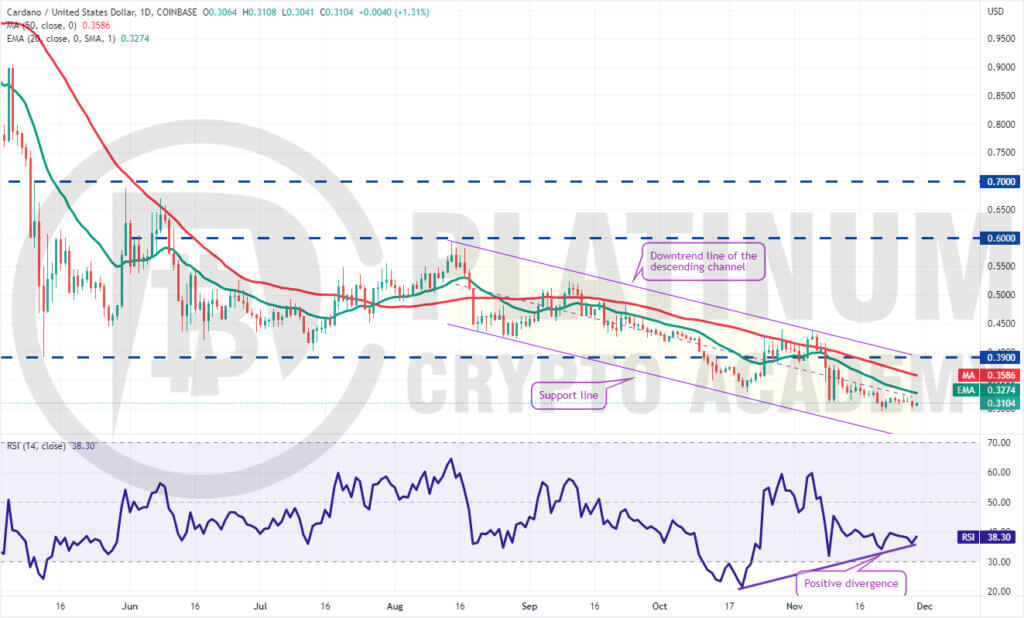
Cardano’s shallow recovery from $0.29 on November 21 shows a lack of aggressive buying by the bulls. Although the downsloping moving averages indicate advantage to the bears, the RSI has formed a positive divergence, suggesting that the selling pressure is reducing.
A break and close above the 20-day EMA will be the first sign of strength. The ADA/USD pair could then attempt a rally to the 50-day SMA and thereafter to the downtrend line of the descending channel. The bulls will have to push and sustain the price above the channel to indicate that the downtrend may have ended.
Conversely, if the price turns down from the current level or the 20-day EMA, it will suggest that bears continue to sell on minor rallies. A break below $0.29 could signal the resumption of the downtrend. The pair could then decline toward the support line of the channel.
Hopefully, you have enjoyed today’s article for further coverage please check out our crypto Blog Page. Thanks for reading! Have a fantastic day! Live from the Platinum Crypto Trading Floor.
Earnings Disclaimer: The information you’ll find in this article is for educational purpose only. We make no promise or guarantee of income or earnings. You have to do some work, use your best judgement and perform due diligence before using the information in this article. Your success is still up to you. Nothing in this article is intended to be professional, legal, financial and/or accounting advice. Always seek competent advice from professionals in these matters. If you break the city or other local laws, we will not be held liable for any damages you incur.
")