
Bitcoin roared back into life last week and skyrocketed above $21,000. The sharp 22% rally in Bitcoin improved sentiment and boosted buying in several altcoins. This pushed the total crypto market capitalization above $1 trillion on January 16, according to coinmarketcap data.
The crypto recovery soared last week after the consumer price index (CPI) data showed a 0.1% drop in December, meeting economist expectations. Although the headline CPI at 6.5% from a year ago is much higher than the Federal Reserve’s 2% target, analysts are bullish because inflation is showing signs of cooling off.
A combination of aggressive buying by the bulls and short covering by the bears resulted in the strong up-move last week. Coinalyze data shows that nearly $500 million in short positions were liquidated since January 14.
Bitcoin’s rise above $20,000 could be good news for Bitcoin miners. Glassnode data estimates the mining costs to be roughly $18,800, which suggests that miners could be turning profitable again. This could reduce the aggressive selling by the miners.
Another positive is that Glassnode estimates Bitcoin’s “realized price,” which gives the average cost basis at which all Bitcoin were purchased, to be around $19,700. The market intelligence firm added that Bitcoin’s average trading price in the past 155 days was about $18,000. That means traders who recently purchased Bitcoin are already in profit.
Although the rally has pushed Bitcoin above $20,000, Bloomberg Intelligence senior macro strategist Mike McGlone is not confident that the rally will continue. In an interview with Scott Melker, McGlone said that the Federal Reserve is still tightening and “you can’t be too excited about any markets.”
However, SkyBridge Capital founder Anthony Scaramucci believes that 2023 is a “recovery year” for Bitcoin. He expects Bitcoin to continue moving up and reach $50,000 to $100,000 in two to three years.
After the sharp rally, is it a good time to buy, or will the prices correct and give a lower entry opportunity to traders? Let’s look at the charts to find out.
BTC/USD Market Analysis
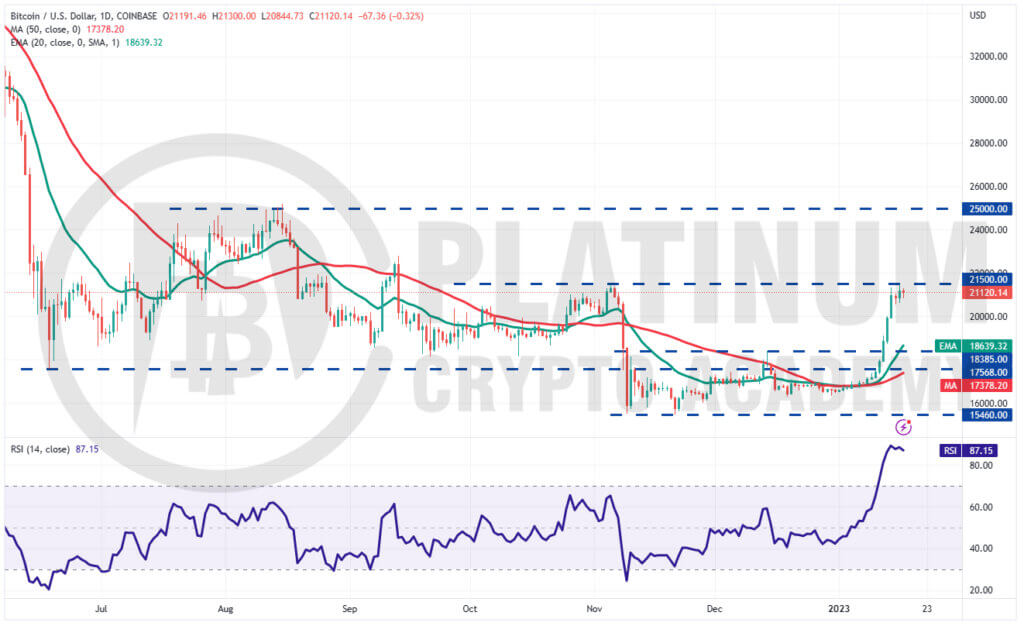
We were expecting $18,385 to act as a strong obstacle but Bitcoin blew past this resistance with ease. This shows aggressive buying by the bulls at lower levels.
The sharp rally of the past few days has pushed the relative strength index (RSI) into deeply overbought levels. Usually, this leads to a minor correction or consolidation.
On the downside, the first support zone is between $20,500 and $20,000. If Bitcoin stays above this zone, the likelihood of a rally to $22,800 and then to $25,000 increases.
A break and close above $21,500 could offer a buying opportunity but it is advisable to keep a tight stop loss because vertical rallies may be followed by sharp pullbacks.
If the price turns down and breaks below $20,000, the BTC/USD pair could drop to the 20-day exponential moving average (EMA). This level is likely to attract strong buying by the bulls. If the price rebounds off the 20-day EMA, the pair could again climb toward $21,500.
ETH/USD Market Analysis
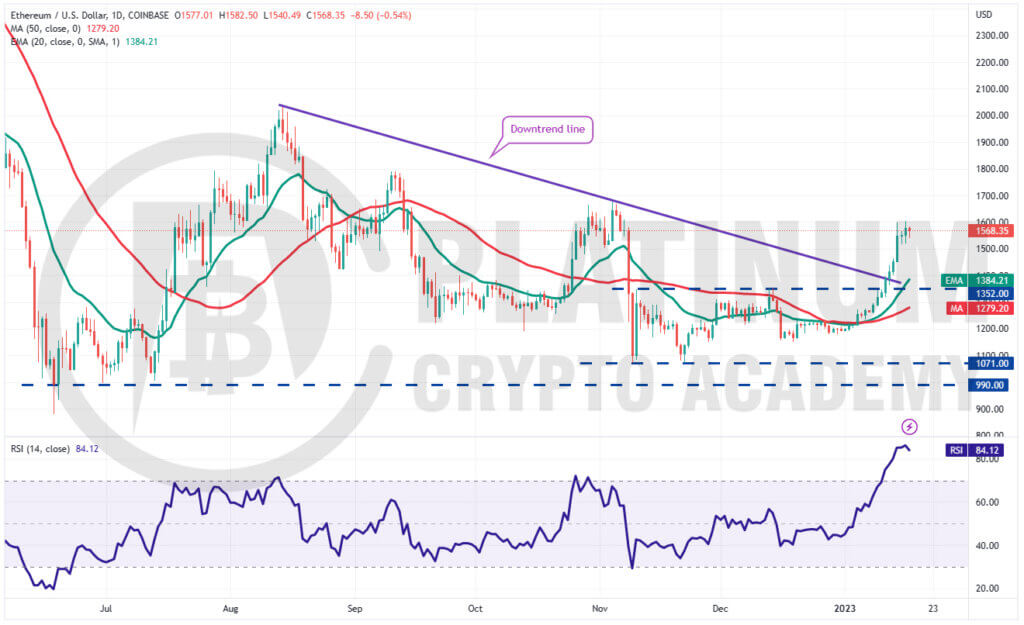
We mentioned in our previous analysis that if Ether breaks above the downtrend line, it will signal a potential trend change and could rally to $1,700.
The ETH/USD pair broke above the downtrend line on January 12 and touched $1,603.91 on January 16. The bears are trying to pose a strong challenge at this level and the overbought levels on the RSI indicate a few days of consolidation or a minor correction is possible.
If bulls do not give up much ground from the current level, the pair could resume its up-move and reach $1,700 and thereafter $1,800. This zone could act as a strong barrier but if bulls overcome it, the pair could soar to $2,000.
The bears will have to sink the price back below the 20-day EMA to gain the upper hand. Until then, the advantage remains with the bulls.
BNB/USD Market Analysis
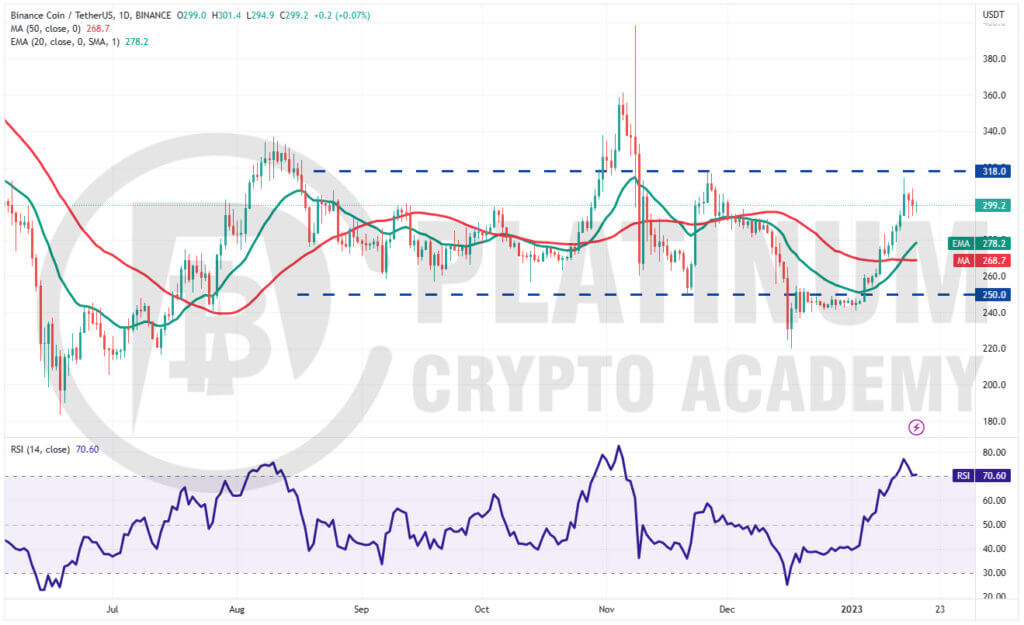
We highlighted in our previous analysis that buyers had the edge and a break above the 50-day simple moving average (SMA) could open the doors for a rally to $300 and then $318 and that is how it played out.
Binance Coin reached $318 on January 14 but the bulls could not clear this hurdle. This suggests that the bears are defending this level aggressively.
A minor positive in favor of the buyers is that they have not ceded ground to the bears. This suggests that the bulls are not rushing to the exit. This increases the likelihood of a break above $318. If that happens, the BNB/USD pair could soar to $360.
Contrary to this assumption, if the price slides below $290, the pair could touch the 20-day EMA. Such a deep pullback will suggest that the pair may extend its stay inside the $250 to $318 range for a few more days.
XRP/USD Market Analysis
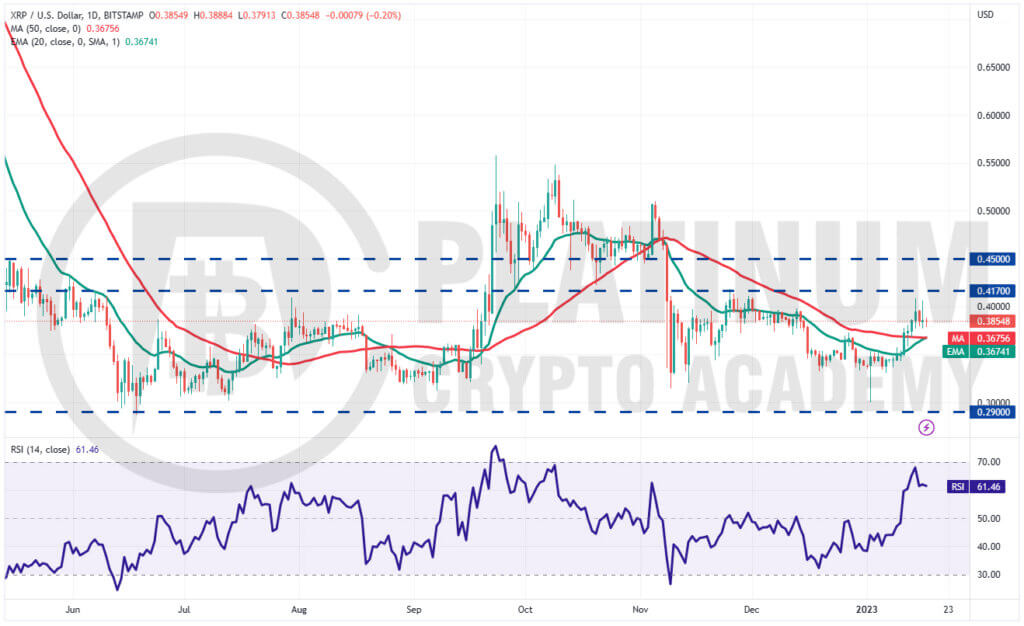
XRP broke above the moving averages on January 11 and reached the overhead resistance at $0.41 on January 14. This level is attracting selling by the bears.
Buyers again tried to propel the price above this resistance on January 16 but the long wick on the candlestick shows that the bears are not willing to relent.
A minor positive is that the moving averages are on the verge of a bullish crossover. This indicates that bulls have a slight edge.
If the price turns up from the current level, the bulls will make one more attempt to drive the XRP/USD pair above the overhead resistance. If they manage to do that, the pair could soar to $0.45.
Conversely, a break below the moving averages will signal that the pair may remain stuck between $0.29 and $0.41 for a while longer.
ADA/USD Market Analysis
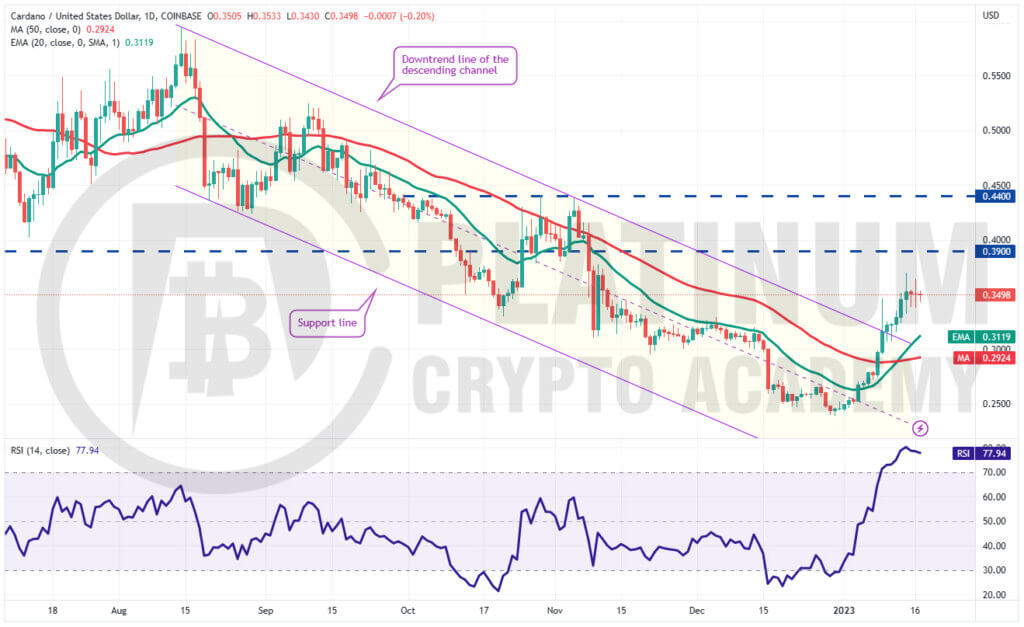
The bears tried to pull Cardano back into the channel on January 10 and 11 but the bulls successfully defended the breakout level. This started an up-move, which reached $0.37 on January 14.
The bears are trying to halt the rally but the bulls have not allowed the price to slip back to the 20-day EMA. This suggests that the bulls are holding on to their positions as they anticipate a move higher.
If bulls thrust the price above $0.37, the ADA/USD pair could challenge the overhead resistance at $0.39. If this level is scaled, the rally could touch $0.44.
This bullish view could invalidate in the near term if the price turns down and breaks back into the channel.
Hopefully, you have enjoyed today’s article for further coverage please check out our crypto Blog Page. Thanks for reading! Have a fantastic day! Live from the Platinum Crypto Trading Floor.
Earnings Disclaimer: The information you’ll find in this article is for educational purpose only. We make no promise or guarantee of income or earnings. You have to do some work, use your best judgement and perform due diligence before using the information in this article. Your success is still up to you. Nothing in this article is intended to be professional, legal, financial and/or accounting advice. Always seek competent advice from professionals in these matters. If you break the city or other local laws, we will not be held liable for any damages you incur.
")