
Fears of a recession, supply chain issues, a China lockdown, and tightening monetary conditions led investors to trim exposure to risky assets last week. The Dow Jones Industrial Average recorded its first-ever eighth-straight weekly loss since 1923. Identically, Bitcoin also made history by closing in the red for the eighth consecutive week.
Although the US equities markets made a strong comeback on May 23, Bitcoin continues to struggle above $30,000. One of the reasons could be that after the collapse of TerraUSD and LUNA, institutional investors are likely to tread cautiously as the crypto space could come under regulatory scrutiny.
Galaxy Investment Partners CEO Michael Novogratz warned his Twitter followers that in 2018, altcoins had fallen more than 95%. Currently, altcoins are down about 80%. This implies that if history repeats, altcoins could fall another 70% from here. Hence, instead of picking bottoms, Novogratz suggests investors “scale in slowly.”
Another bearish voice was that of Guggenheim Chief Investment Officer Scott Minerd. While speaking to CNBC, Minerd cautioned that if Bitcoin starts to trade below $30,000 consistently, the next major bottom was at $8,000. “I think we have a lot more room to the downside, especially with the Fed being restrictive,” Minerd added.
Among all the gloom and doom, Sheila Warren, CEO of the Crypto Council for Innovation (CCI), sounded upbeat about the future of the crypto space. In an interview with Cointelegraph, Warren said that after the recent events (collapse of Terra ecosystem) only serious people will remain in this space who realise the “opportunity and the potential this technology and innovation hold.”
Could crypto markets remain under pressure or are they ripe for a rebound? Read our analysis of the major cryptocurrencies to find out the cryptocurrency prediction as Bitcoin could plunge to $25,000 and major altcoins are struggling to sustain the recovery.
BTC/USD Market Analysis
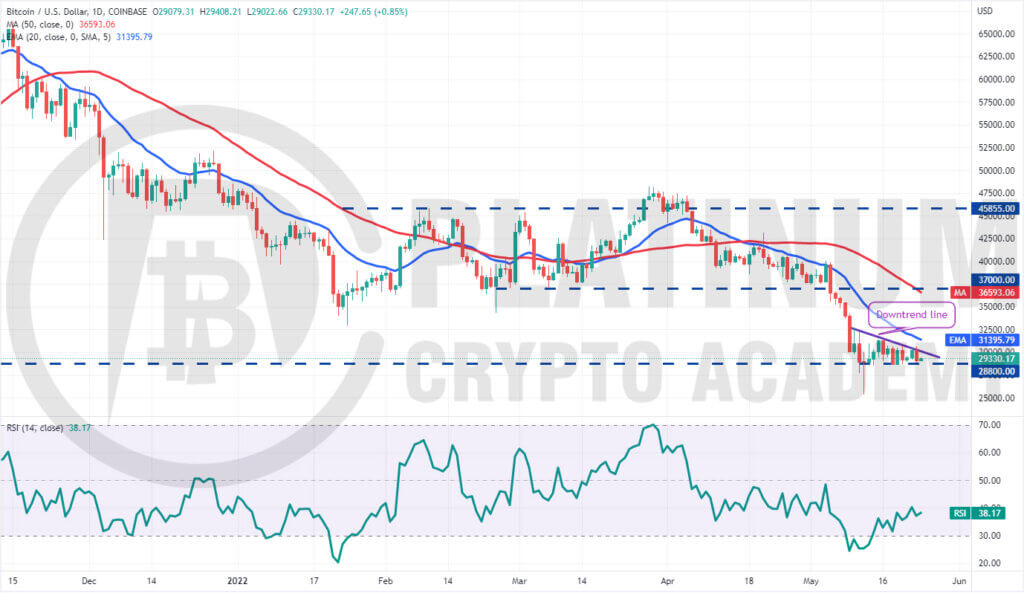
Bitcoin’s recovery attempts repeatedly turned down from the downtrend line in the past few days. This suggests that bears are defending the level with vigour.
The bears will now attempt to pull the price below the strong support at $28,800. If they manage to do that, it will open the doors for a possible drop to $25,338.53. This is an important level to keep an eye on because if it gives way, the selling could accelerate and the BTC/USD pair could drop to the psychological level of $20,000.
On the contrary, if the price rebounds off the current level, it will suggest that bulls are accumulating on dips to $28,800. The buyers will then make another attempt to push the pair above the downtrend line.
If they succeed, the pair could rise to the 20-day exponential moving average (EMA). If the price turns down from this level, it will suggest that bears continue to sell at higher levels. The bears will then again try to sink the pair below $28,800.
Alternatively, if bulls thrust the price above the 20-day EMA, it will suggest that the downtrend is weakening. The pair will then attempt a rally to the 50-day simple moving average (SMA).
ETH/USD Market Analysis
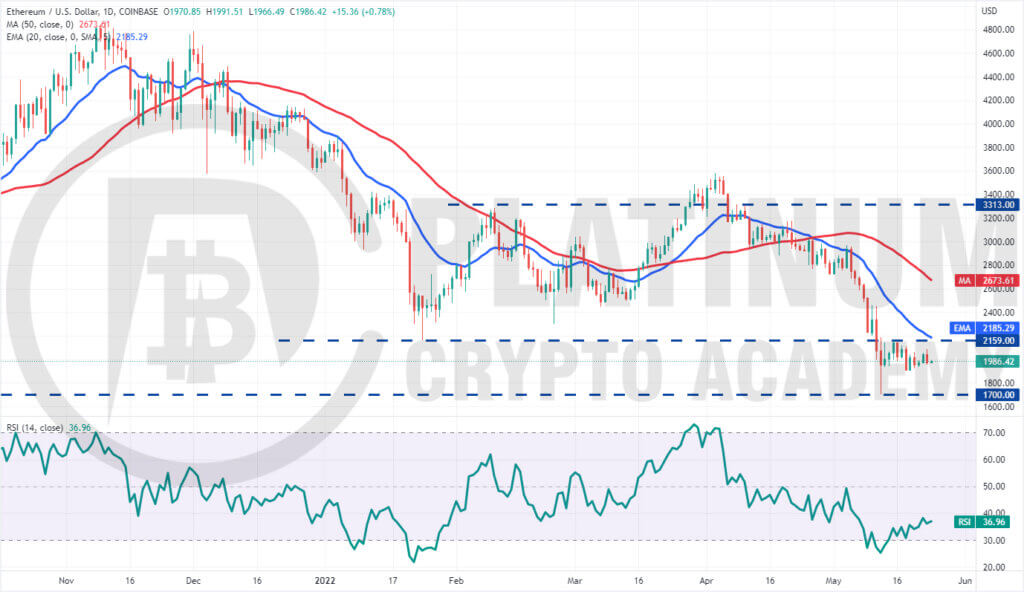
The bulls failed to push Ether above $2,159 on May 17 which attracted strong selling by the bears. The sellers pulled the price below the psychological support at $2,000 on May 18 but they could not build upon this advantage.
Strong buying at lower levels pushed the price back above $2,000 on May 19. The ETH/USD pair is stuck between $1,900 and $2,159 for the past few days. The longer the time spent in this range, the stronger will be the breakout from it.
If buyers propel the price above the 20-day EMA, it will suggest that the pair may have bottomed out. The pair could then rally to $2,500 and thereafter march toward the 50-day SMA.
On the other hand, if the price turns down and breaks below $1,900, it will suggest that supply exceeds demand. The pair could then drop to the critical support at $1,700. This is an important level for the bulls to defend because a break below it could intensify selling and signal the resumption of the downtrend.
BNB/USD Market Analysis
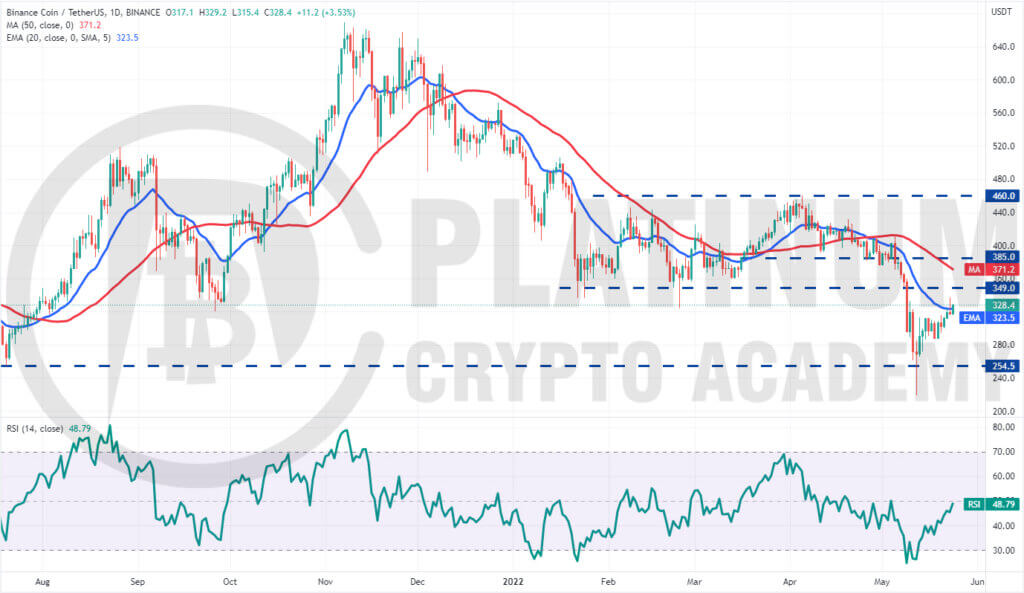
Binance Coin has been attempting to make a V-shaped recovery from the May 12 intraday low at $218.80. This suggests aggressive buying by the bulls.
The buyers pushed the price above the 20-day EMA on May 23 but the long wick on the candlestick shows that bears are selling at higher levels. However, a positive sign is that the bulls did not give up much ground.
This suggests that traders are not closing their positions in a hurry as they anticipate the recovery to continue.
The BNB/USD pair could rally to the breakdown level of $349. This level could act as a strong resistance. But if bulls arrest the subsequent decline at the 20-day EMA, it will suggest a change in sentiment from selling on rallies to buying on dips. That could increase the possibility of a break above $349.
Alternatively, if the bulls again fail to sustain the price above the 20-day EMA, it may tempt short-term traders to book profits. That could pull the pair down to $286, which is likely to act as strong support.
XRP/USD Market Analysis
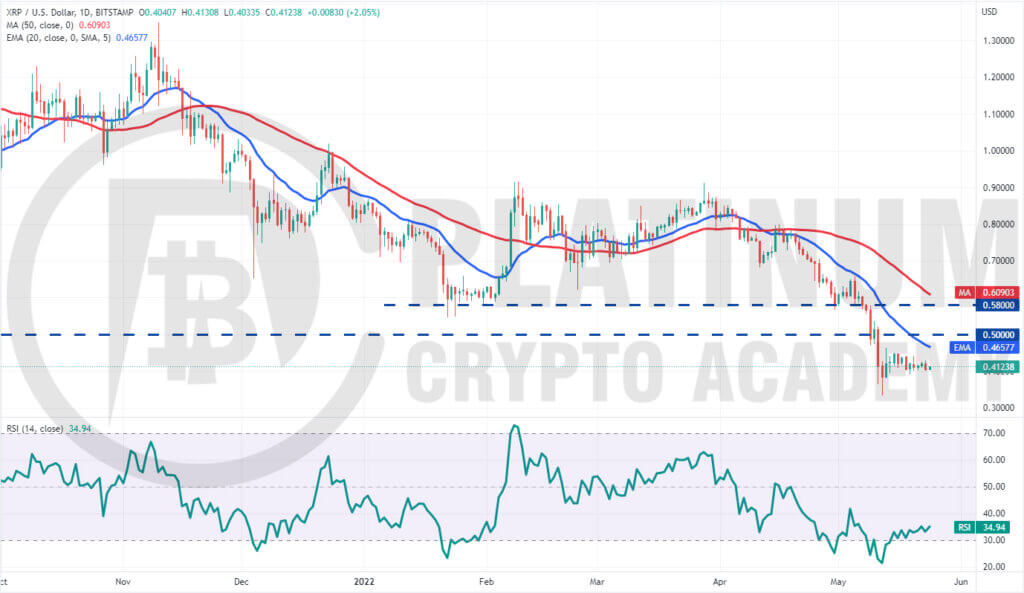
XRP has been consolidating in a downtrend. The XRP/USD pair is stuck inside a tight range between $0.45 and $0.38 for the past few days. This suggests that bulls are attempting to form a higher low at $0.38 but the bulls are not allowing the recovery to rise above $0.45.
The downsloping moving averages and the relative strength index (RSI) in the negative territory indicate advantage to sellers. If bears sink the price below $0.38, the XRP/USD pair could plunge to the crucial support of $0.33.
This is an important level for the bulls to defend because a break below it could intensify selling.
On the upside, the relief rally is likely to face strong selling near the 20-day EMA. If bulls clear this hurdle, it will suggest the start of a sustained recovery. The pair could first rise to $0.50 and thereafter rally toward the 50-day SMA.
SOL/USD Market Analysis
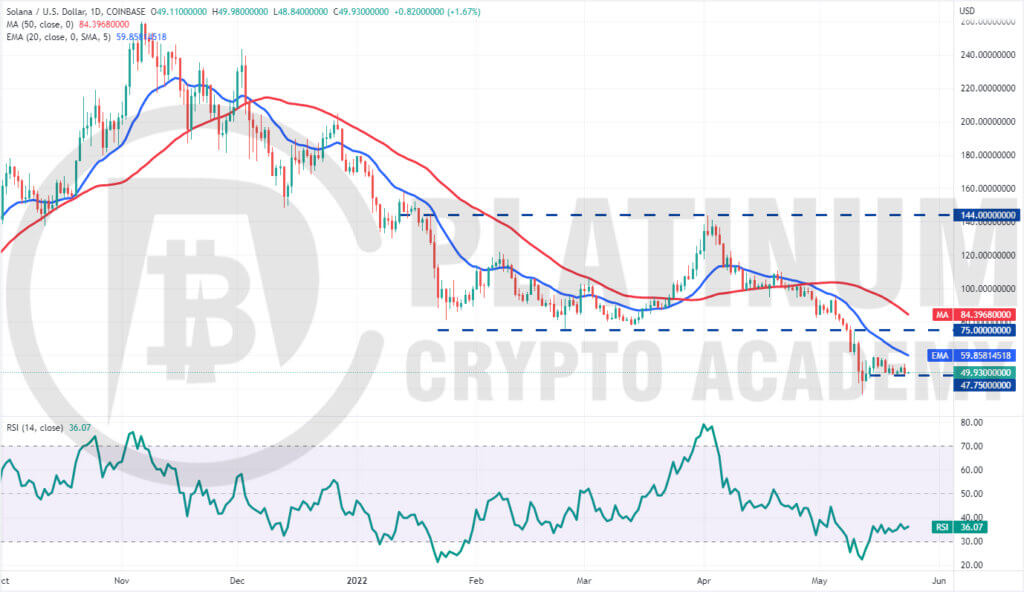
The buyers failed to push Solana above the immediate resistance at $60, indicating a lack of demand at higher levels. The failure to push the price higher could embolden the bears who will attempt to consolidate their advantage.
If sellers sink the price below the immediate support of $47.75, the SOL/USD pair could slide to $43. If this support also cracks, the decline could extend to the May 12 intraday low of $36. The bears will have to sink the price below this support to signal the resumption of the downtrend.
Contrary to this assumption, if the price rebounds off the current level, the bulls will attempt to push the pair above the 20-day EMA. If they succeed, the recovery could reach the breakdown level of $75.
This is an important level for the bears to defend because a break and close above it could signal a potential trend change.
Hopefully, you have enjoyed today’s article for further coverage please check out our crypto Blog Page. Thanks for reading! Have a fantastic day! Live from the Platinum Crypto Trading Floor.
Earnings Disclaimer: The information you’ll find in this article is for educational purpose only. We make no promise or guarantee of income or earnings. You have to do some work, use your best judgement and perform due diligence before using the information in this article. Your success is still up to you. Nothing in this article is intended to be professional, legal, financial and/or accounting advice. Always seek competent advice from professionals in these matters. If you break the city or other local laws, we will not be held liable for any damages you incur.
