Bitcoin rallied more than 9% last week and extended its recovery above $22,400 in the new week. This helped the total cryptocurrency market capitalization to climb back above the psychological mark of $1 trillion. Several events may have triggered the recovery in the cryptocurrency markets.
The United States dollar index (DXY) which has been in a strong uptrend for the past several weeks is showing signs of topping out. This bodes well for risky assets as they move in inverse correlation to the DXY. Investors seem to believe that inflation may have peaked and the Federal Reserve may slow down its aggressive pace of rate hikes after the September meeting.
Credit Suisse chief US equity strategist Jonathan Golub said while speaking to CNBC that inflation is likely to “collapse” over the next 12 to 18 months. Reduced gas prices at the gas station and a decline in food prices are showing early signs that inflation may be headed southward. If that happens, Golub expects the Fed to signal a pause with their rate hikes over the next four to six months, triggering a strong market rally.
Investors will closely watch the US consumer price index data to be released on September 13 for signs of easing inflation. If stock markets extend their recovery, it could be good news for the crypto bulls as Bitcoin has been strongly correlated with the US equities markets for most of this year.
Another important event that could impact the cryptocurrency markets is the Ethereum Merge scheduled for September 15. Ethereum’s shift from proof-of-work to proof-of-stake consensus mechanism will reduce energy consumption by about 99.95%, developers said. Successful completion of the Merge is expected to be followed by further enhancements to the Ethereum blockchain.
Crypto intelligence firm Chainalysis said in a report on September 7 that attractive staking rewards and transaction fees distributed to validators may lure institutional investors looking to earn higher yields. Ether’s yield is expected to be between 10-15% annually, much higher in comparison to US Treasury bonds at 3.5% as of September 2022.
It is always difficult to predict the reaction of the market post a critical event but the charts could provide some insight. Read our analysis of the major cryptocurrencies to find out.
BTC/USD Market Analysis
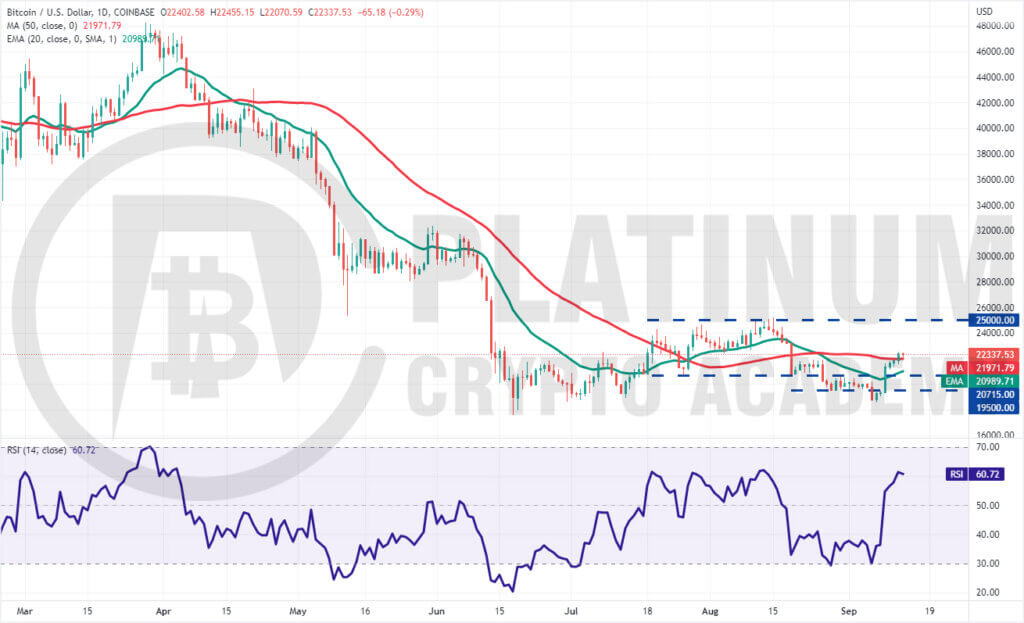
Bitcoin behaved the way we had projected in the previous analysis. It broke below $19,500 on September 6 and reached the $18,600 to $17,567.45 support zone on September 7.
This zone attracted strong buying as we had expected and the BTC/USD pair turned up from $18,527 on September 7. The bulls pushed the price above the overhead resistance of $20,715 on September 9 and propelled the pair to the 50-day simple moving average (SMA).
The 20-day exponential moving average (EMA) has started to turn up and the relative strength index (RSI) has jumped into positive territory. This suggests that bulls have the upper hand.
If buyers sustain the price above the 50-day SMA for two more days, the possibility of a rally to the overhead resistance at $25,000 increases. The bulls will have to clear this hurdle to signal the start of a new uptrend.
To invalidate this positive view, the bears will have to sink the price back below the moving averages. If they succeed, the pair could again drop to the $18,600 to $17,567.45 support zone
ETH/USD Market Analysis
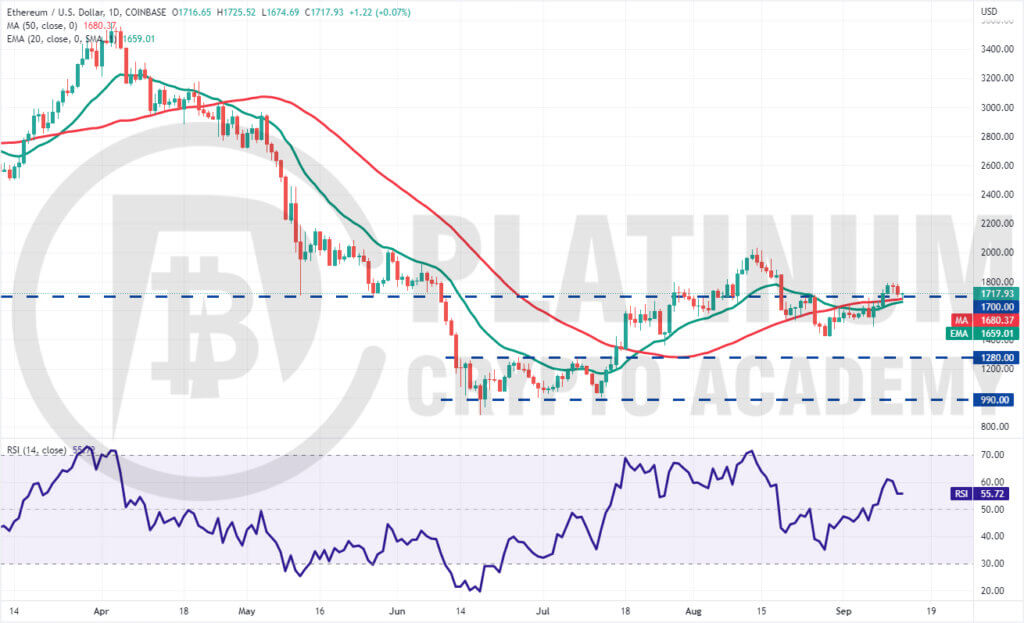
Ether climbed above the $1,700 resistance on September 9 but the bulls could not continue the up-move as bears mounted a strong defense near $1,800. The price turned down and dropped below $1,700 on September 13 which is an important level to keep an eye on.
If the price bounces off the current level, it will suggest that bulls have flipped the level into support. The gradually rising 20-day EMA and the RSI in the positive territory indicate the path of least resistance is to the upside.
If buyers drive the price above $1,800, the ETH/USD pair could reach $2,032. This level may again act as a strong resistance but if bulls propel the price above it, the pair could rally to $2,200.
This positive view could invalidate in the near term if bears sink the price below the moving averages. Such a move will suggest that bears continue to sell on rallies. The pair could then slide to $1,500.
BNB/USD Market Analysis
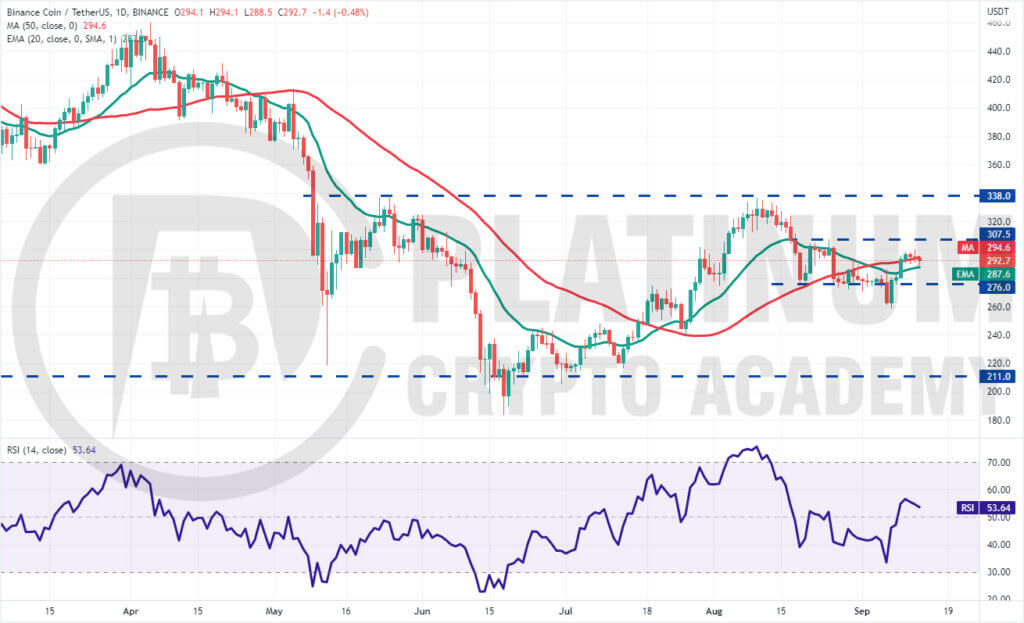
Binance Coin plummeted below the strong support of $276 on September 6 but the bears could not capitalize on this weakness. The bulls bought the dip aggressively and pushed the price back above $276 on September 7.
This indicates that the breakdown may have been a bear trap. That may have resulted in short-covering which pushed the price to $300 on September 12.
The 20-day EMA has started to turn up but the RSI is just above the midpoint, indicating a balance between supply and demand. Buyers will have to push the price above $307.50 to gain the upper hand.
If they do that, the BNB/USD pair could rally toward the stiff overhead resistance at $338. On the other hand, if bears sink the price below the 20-day EMA, the pair could slide to $276. The next break below $276 could increase the likelihood of a drop to $240.
XRP/USD Market Analysis
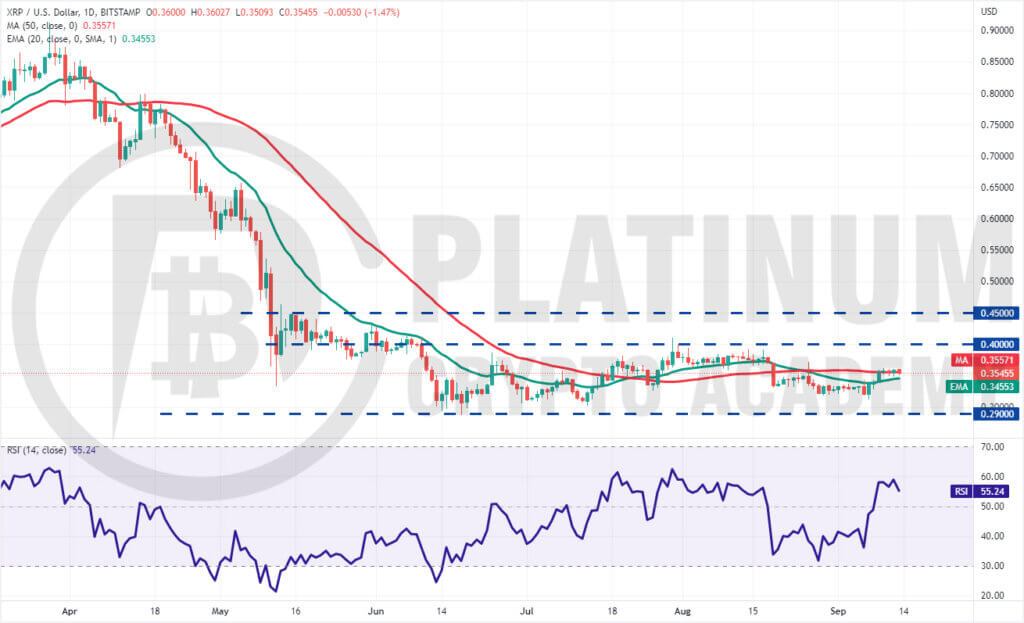
XRP has been in a bottoming formation for the past many weeks. Both moving averages have been criss-crossing each other and the RSI is just above the midpoint, indicating a balance between supply and demand.
The bulls are buying near the support at $0.29 while the bears continue to sell on rallies near $0.40. The longer the price remains inside the range, the stronger will be the eventual breakout from it.
When the price trades inside a range, it is difficult to predict the direction of the breakout with certainty. Therefore, it is best to wait for the price to escape the range before placing directional bets.
A break and close above $0.40 could signal the start of a new uptrend. The pair could then rally to $0.45 and later to the pattern target at $0.51. The bears will have to sink the price below $0.29 to start the next leg of the downtrend.
Until that happens, the pair is likely to remain volatile inside the large range between $0.29 and $0.40.
ADA/USD Market Analysis
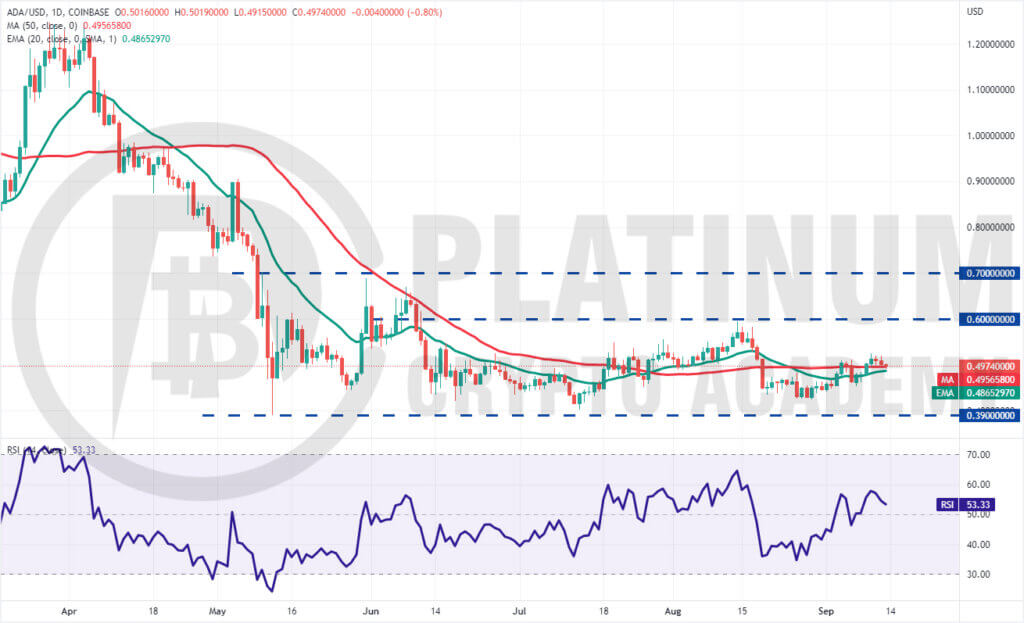
Cardano rose above the 50-day SMA on September 4 and we expected the rally to continue toward the stiff overhead resistance at $0.60 but that did not happen. The bears pulled the price back below the moving averages on September 6.
However, a positive sign is that lower levels attracted strong buying by the bulls and the ADA/USD pair climbed back above the 50-day SMA on September 9.
Although the pair has been moving up gradually, it has trenbolone acetate injection expertise not been able to pick up momentum. This suggests that higher levels continue to attract selling by the bears.
If the price rebounds off the moving averages, it will increase the possibility of a rally to $0.60. Conversely, if the price turns down below the 20-day EMA, it will suggest that the pair may drop to $0.45.
.
Hopefully, you have enjoyed today’s article for further coverage please check out our crypto Blog Page. Thanks for reading! Have a fantastic day! Live from the Platinum Crypto Trading Floor.
Earnings Disclaimer: The information you’ll find in this article is for educational purpose only. We make no promise or guarantee of income or earnings. You have to do some work, use your best judgement and perform due diligence before using the information in this article. Your success is still up to you. Nothing in this article is intended to be professional, legal, financial and/or accounting advice. Always seek competent advice from professionals in these matters. If you break the city or other local laws, we will not be held liable for any damages you incur.


