
Bitcoin Price plunged below $30,000 on May 10 for the first time since July 2021. After the latest decline, Bitcoin has fallen more than 56% from its all-time high of $69,000 made on November 10, 2021. The drop in Bitcoin and the altcoins have pulled the total crypto market capitalization to about $1.4 trillion, a sharp drop from its all-time high of about $3 trillion on November 10, 2021.
The sell-off is not only limited to cryptocurrencies. Investors are dumping equities fearing a potential recession due to surging inflation and aggressive monetary tightening by the US Federal Reserve. The S&P 500 is about 17% below its all-time high reached on January 3 of this year and the Nasdaq is down 27% from its all-time high. According to Reuters, the performance of the markets in the first four months of 2022 has been the worst since 1939.
TerraUSD (UST) the algorithmic stablecoin of the Terra blockchain lost its peg to the US dollar and dropped to a low of $0.67 on May 10. Terra’s LUNA token, which is used to back UST has also been in a tailspin plunging more than 52% on May 9. Analysts fear that if the Luna Foundation Guard, tasked to defend the peg of the UST to USD, is forced to liquidate its Bitcoin buying opportunities and holdings, that could create more panic and result in further liquidations.
On-chain market intelligence firm Glassnode highlighted in a recent report that Bitcoin had declined between 77.2% to 85.5% from the all-time high during the bear markets of 2015, 2018 and 2020. Network profitability has also declined to the pre-capitulation levels seen during 2018, late 2019 bear and March 2020. Glassnode warned that “further downside remains a risk, and would be within the realm of historical cycle performance.”
Although crypto prices have become attractive, traders should be patient and wait for the decline to end before jumping in to buy. What are the levels that could possibly act as crucial supports? Read our analysis of the major cryptocurrencies to find out Bitcoin buying opportunities in the crisis.
BTC/USD Market Analysis
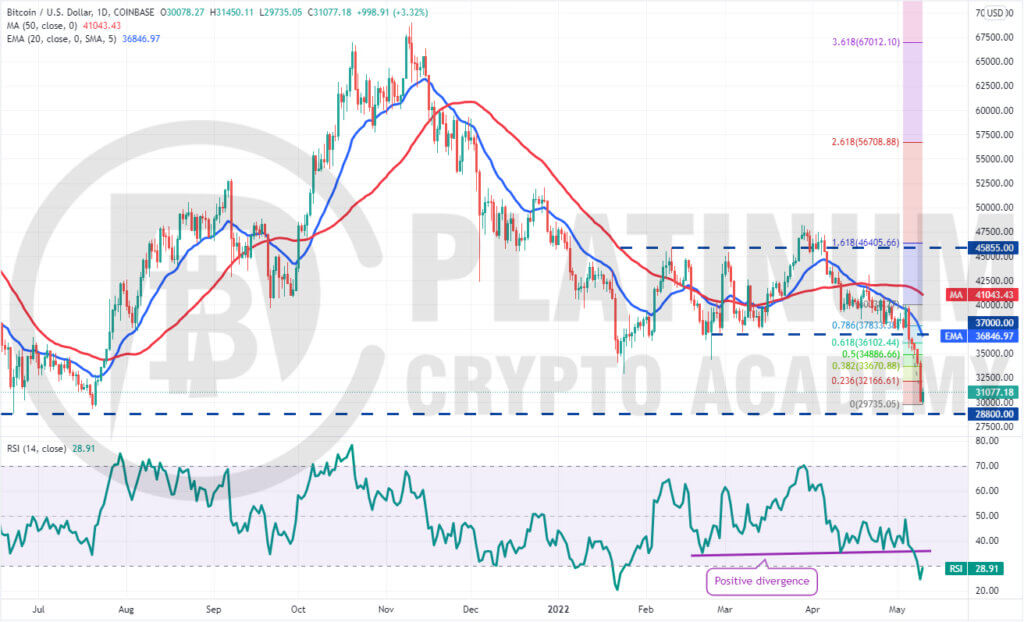
Bitcoin turned down from the 20-day exponential moving average (EMA) on May 5 and plunged below the $37,000 support. This aggravated selling and the BTC/USD pair plummeted to $32,933 as we had projected in our previous analysis.
The sharp fall of the past few days has pulled the relative strength index (RSI) into the oversold zone, indicating that the selling may have been overdone in the short term. This points to a possible consolidation or a relief rally in the near term.
The bulls are likely to defend the zone between $30,000 and $28,800 with all their might but the recovery is likely to face stiff resistance in the zone between $33,670 and $34,886.
If the price turns down from this zone aggressively, it will suggest that the sentiment remains negative and traders are selling at higher levels. That could increase the possibility of a break below $28,800.
If that happens, the pair may enter a capitulation phase and drop to $25,000 and later to $20,000.
On the upside, the 20-day EMA is the key level to keep an eye on. If the price rises and maintains above this level, it will suggest that bears may be losing their grip. The pair could then rally to $37,000.
ETH/USD Market Analysis
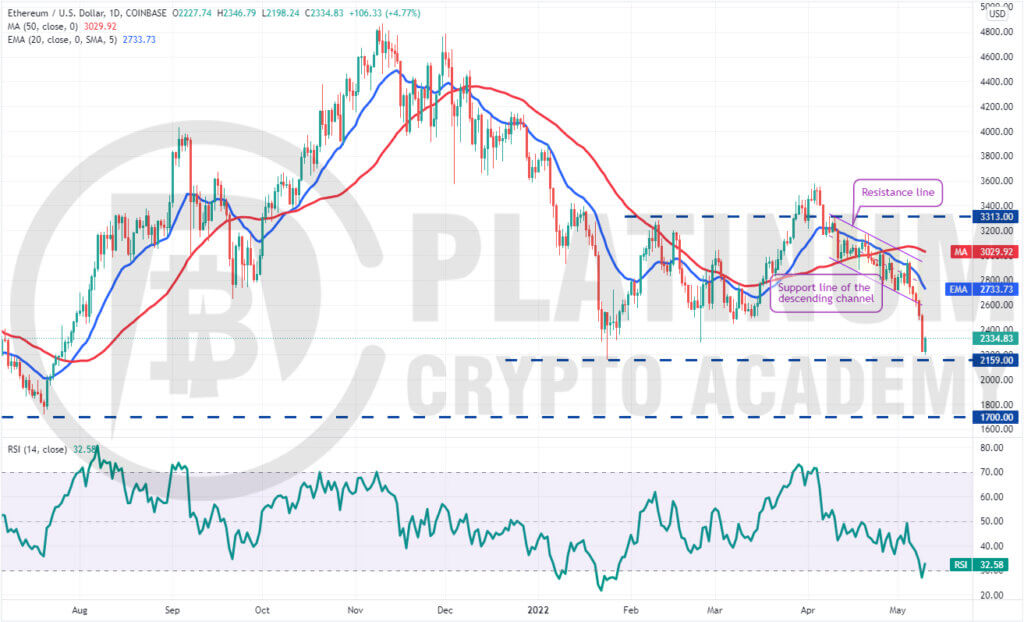
We had warned in our previous analysis that the selling momentum could pick up if Ether breaks below the support line of the descending channel and that is what happened.
Ether turned down from the 20-day EMA on May 5 and plunged below the channel on May 8. This exacerbated the selling and the ETH/USD pair sliced through several supports and dropped to $2,198.24 on May 10.
The bulls are likely to defend the $2,159 level aggressively because a break and close below it could intensify selling and pull the pair to the psychological support at $2,000 and thereafter to $1,700.
Any recovery attempt is likely to face strong selling at $2,500 and again at the 20-day EMA. If the price turns down from either resistance, it will suggest that bears continue to sell at higher levels. The bears will then again try to sink the pair below $2,159.
Alternatively, a break and close above the 20-day EMA will be the first indication that the decline could be ending.
BNB/USD Market Analysis
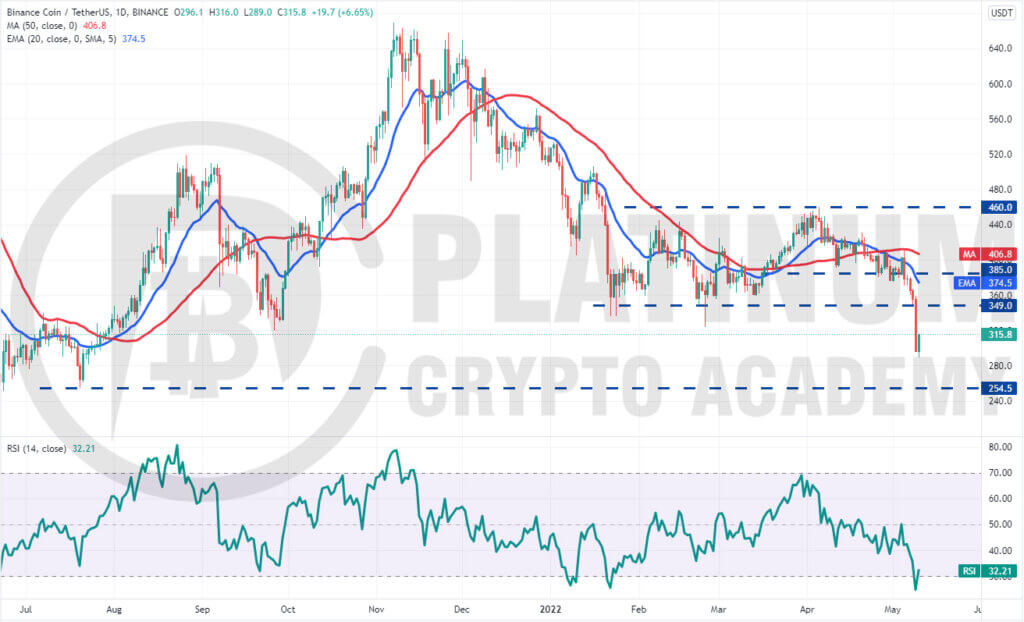
We had suggested in the previous analysis that buyers will have to push and sustain the price above the 50-day simple moving average (SMA) to indicate that the bears are losing their grip.
However, that did not happen and the BNB/USD pair turned down from the 50-day SMA on May 5. The selling picked up momentum after it broke below the critical support at $349. This signalled the resumption of the downtrend.
The sharp fall of the past few days pulled the RSI into the oversold territory, suggesting a consolidation or a recovery is possible in the short term.
The buyers will now attempt to push the pair back above the breakdown level of $349. If they succeed, it will suggest aggressive buying at lower levels.
Contrary to this assumption, if the price turns down from $349, it will indicate that bears have flipped the level into resistance. The bears will then again try to resume the downtrend. A break and close below $289 could open the doors for a potential drop to $254.50.
XRP/USD Market Analysis
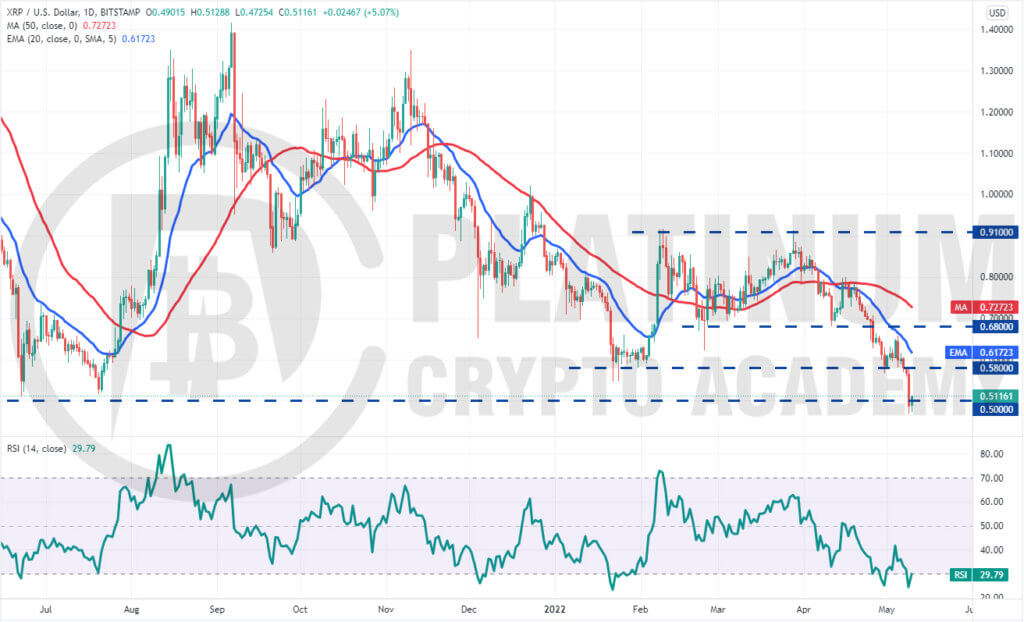
XRP turned down from the 20-day EMA on May 5 and broke below the strong support at $0.58 on May 8. This aggravated selling and the XRP/USD pair dropped to the psychological support at $0.50 as we had projected in our previous analysis.
The sharp fall of the past few days pulled the RSI into the oversold territory which historically has resulted in a relief rally.
If the price rebounds off the current level, the recovery is likely to face stiff resistance at $0.58. If the price turns down from this level, it will suggest that bearish sentiment prevails.
The sellers will then make one more attempt to sink and sustain the pair below $0.50. If they manage to do that, the pair could drop to the next support at $0.40.
On the other hand, if buyers propel the price above the 20-day EMA, it will suggest that $0.50 could act as a bottom in the near term. The pair could then rise to $0.68.
SOL/USD Market Analysis
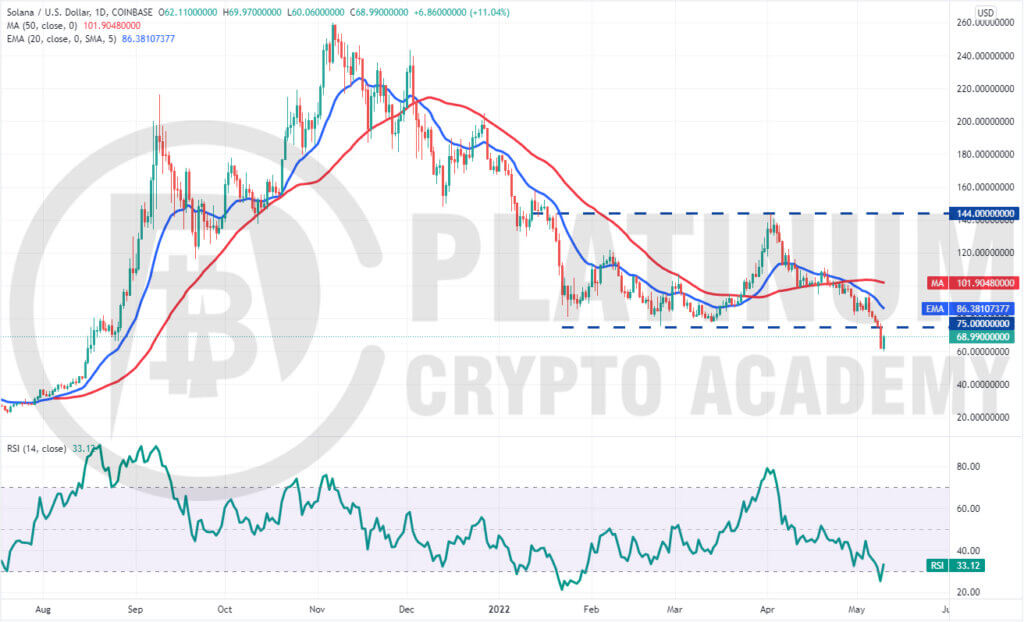
Solana had been consolidating in a large range between $75 and $144 for the past several weeks. The buyers had successfully defended the support at $75 on three previous occasions but they could not repeat the performance on May 9.
Strong selling by the bears pulled the price to $60 on May 10. The buyers are currently attempting to push the price back above the breakdown level at $75 and trap the aggressive bears.
If they manage to do that, the SOL/USD pair could rise to the 20-day EMA. The buyers will have to push and sustain the price above this resistance to suggest a change in sentiment. The pair could then rally to the 50-day SMA.
Contrary to this assumption, if the recovery falters at $75 or the 20-day EMA, it will suggest that traders are offloading positions on rallies. The bears will then attempt to resume the downtrend by pulling the pair below $60. If they manage to do that, the pair could plummet to $50 and later to $40.
Hopefully, you have enjoyed today’s article for further coverage please check out our crypto Blog Page. Thanks for reading! Have a fantastic day! Live from the Platinum Crypto Trading Floor.
Earnings Disclaimer: The information you’ll find in this article is for educational purpose only. We make no promise or guarantee of income or earnings. You have to do some work, use your best judgement and perform due diligence before using the information in this article. Your success is still up to you. Nothing in this article is intended to be professional, legal, financial and/or accounting advice. Always seek competent advice from professionals in these matters. If you break the city or other local laws, we will not be held liable for any damages you incur.
