
Bitcoin’s weekly close above $30,000 was the first such instance since May 2022. The rally in Bitcoin was boosted by lower-than-expected Consumer Price Index (CPI) print for March. Annual CPI rose 5% in March versus estimates of 5.1%, the lowest rate of increase since May 2021. Although inflation remains well above the Federal Reserve’s 2% target rate, it is showing a steady decline.
The FedWatch Tool shows an 86.7% probability of a 25 basis-point rate hike in the Fed’s May meeting. However, by the September meeting, the majority expect the Fed to start cutting rates. If that happens, assets such as stocks and cryptocurrencies are likely to benefit.
Another important event last week was Ethereum’s Shapella hard fork which happened on April 12. Market observers were divided on the impact of Shapella on Ether’s price but the bulls finally came out on top and pushed the price of the largest altcoin above $2,100. Several analysts believe that Shapella is likely to attract more institutional investors to stake on Ethereum.
ARK Invest CEO Cathie Wood said in an interview that the rally in Bitcoin and Ether during the recent banking crisis suggests that traders view the assets as a safe haven similar to gold. This “suggests much broader-based adoption and acceptance than I think most people understand,” she added.
Glassnode said in its latest analysis on April 17 that “several on-chain indicators are suggesting that bear market conditions (or at least the worst of it) may now be behind us.”
Several analysts have turned positive and are focusing their attention on Bitcoin’s halving cycle due in April 2024. This has improved sentiment, pushing the Crypto Fear & Greed Index into the greed territory. If the reading rises further into the greed zone, it will indicate that traders are chasing prices higher. Usually, that results in a sharp pullback because experienced traders sell into strength. Therefore, traders may turn cautious in the near term.
What are the important support levels that need to hold for the up-move to continue? Let’s study the charts of Bitcoin and the major cryptocurrencies to find out.
BTC/USD Market Analysis
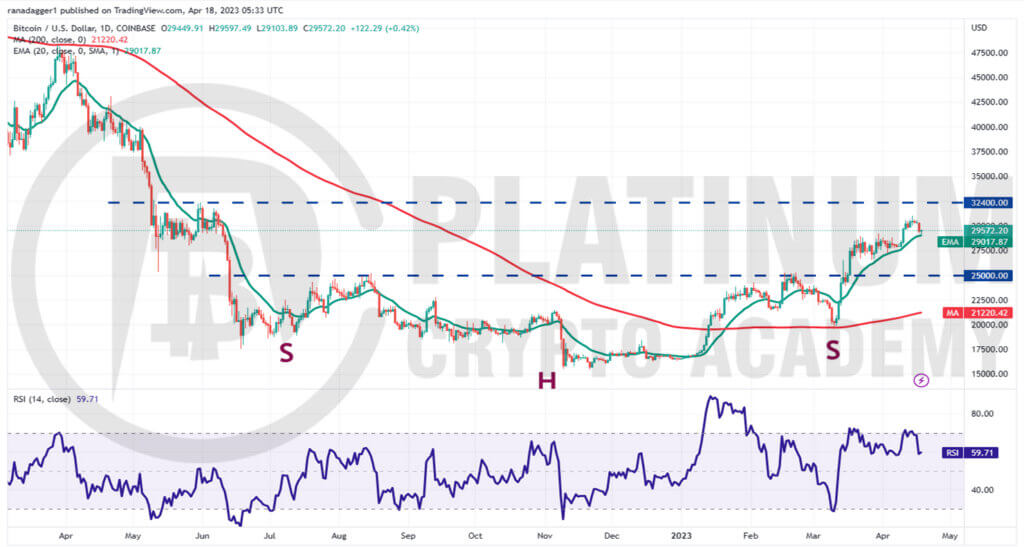
We said in our previous analysis that the $32,000 level may witness aggressive selling by the bears but the sellers entered at $31,050 on April 14.
That started a correction in the BTC/USDT pair, which reached the 20-day exponential moving average (EMA) on April 18. A strong rebound off the current level will suggest that the sentiment remains positive and traders are viewing the dips as a buying opportunity.
The bulls will then again attempt to drive the price to the overhead resistance at $32,400. This remains the key level to watch out for because if this resistance is pierced, the pair may soar toward $40,000.
The rising 20-day EMA and the relative strength index (RSI) in the positive territory indicate that bulls have the upper hand.
If bears want to halt the up-move, they will have to yank the price back below the 20-day EMA. That may trigger stops of short-term traders, resulting in a decline to $26,500 and then to the breakout level of $25,000. This level is likely to witness aggressive buying by the bulls.
ETH/USD Market Analysis
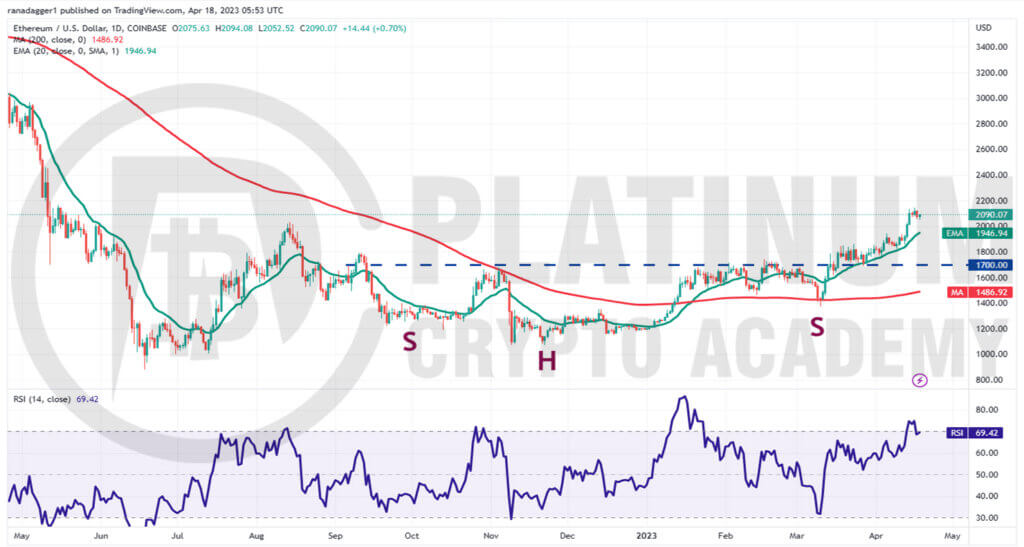
We mentioned in the previous analysis that Ether could reach $2,200 and that is what happened. The ETH/USD pair reached $2,142 on April 16.
The upsloping 20-day EMA and the RSI near the overbought zone indicate that bulls are firmly in the driver’s seat. Usually, during strong uptrends, the pullbacks do not last for more than three days.
If the price turns up from the current level and climbs above the $2,200 resistance, it may create FOMO among traders, leading to a buying stampede. The pair may then soar toward $3,000 as there is no major resistance in between,
The first sign of weakness will be a break and close below the 20-day EMA. Such a move will suggest that the bulls may be rushing to the exit. The pair may first plummet to $1,800 and thereafter to the breakout level of $1,700.
BNB/USD Market Analysis
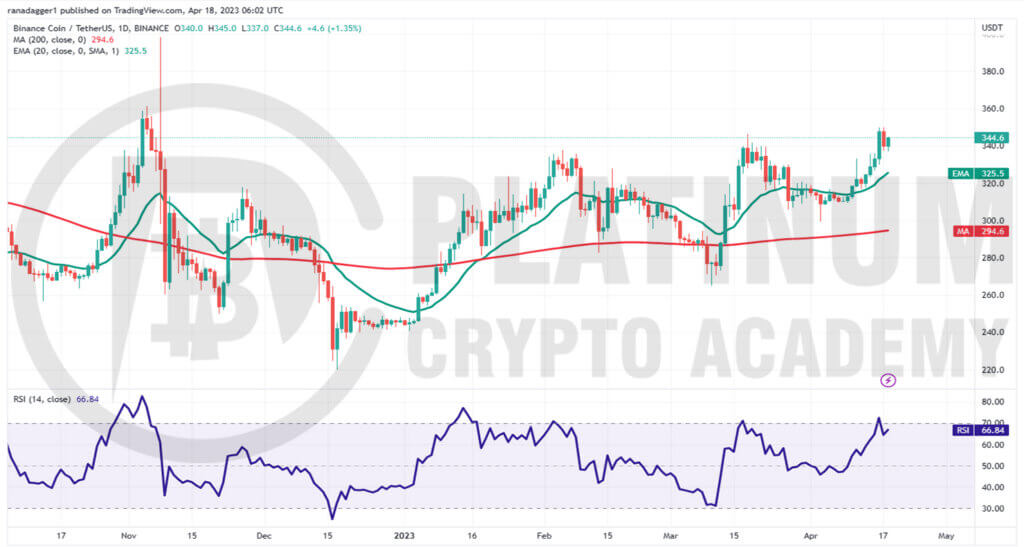
We projected in the previous analysis that Binance Coin could reach $346 if bulls clear and sustain the overhead hurdle at $318 and that is how it played out.
The BNB/USD pair witnessed profit-booking near $350 but the bears could not sustain the price below $338. This suggests that the bulls are trying to flip the $338 level into support.
If the price turns up from the current level and breaks above $350, the pair may pick up momentum. There is a minor resistance at $360 but it is likely to be crossed. The pair may then soar toward $400.
This positive view will invalidate in the near term if the price turns down sharply and plummets below the 20-day EMA. Such a move will indicate that the rally above $338 may have been a bull trap.
XRP/USD Market Analysis
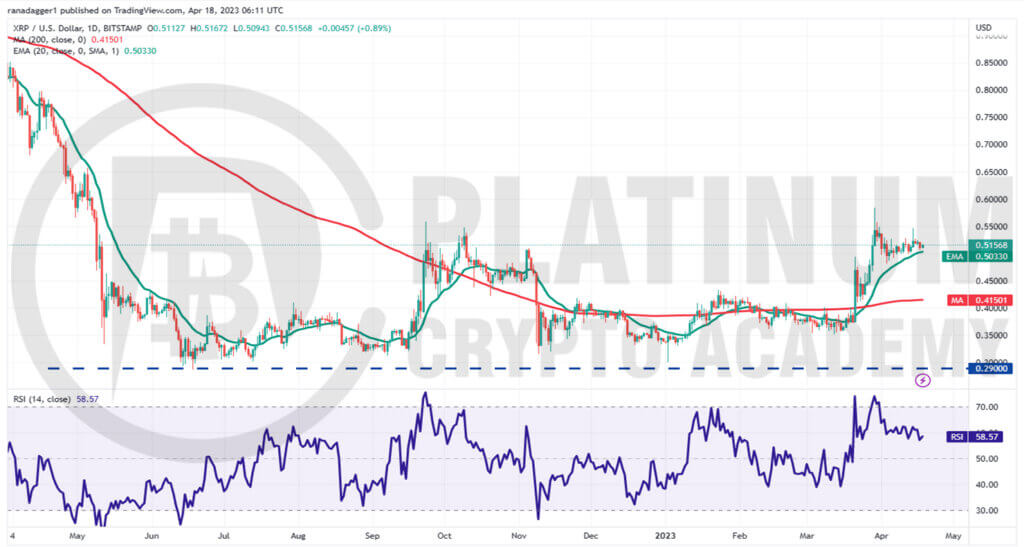
The bulls tried to thrust XRP above the overhead resistance zone of $0.56 to $0.58 on April 14 but the bears held their ground. This suggests that sellers are active at higher levels.
However, a minor positive in favor of the bulls is that the bears have not been able to sink the price below the 20-day EMA. This indicates buying at lower levels.
The 20-day EMA is flattening out and the RSI is gradually dropping toward the center, indicating that the bullish momentum is weakening. That may keep the XRP/USD pair stuck inside a range for a few days.
Buyers will have to overcome the barrier at $0.58 to start the next leg of the uptrend toward $0.65 and then $0.80. Contrarily, if the price slips below $0.48, the pair may tumble to $0.43.
ADA/USD Market Analysis
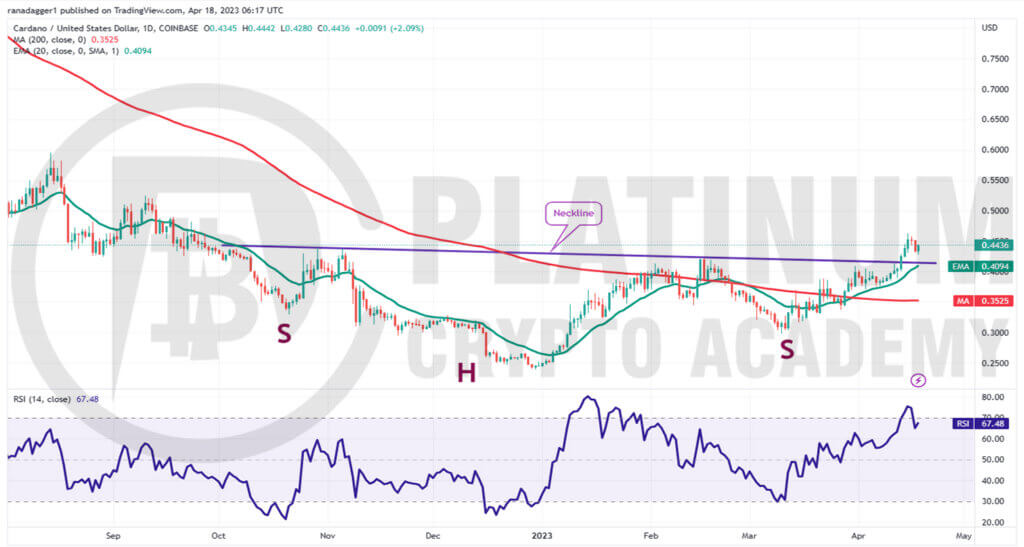
We highlighted that Cardano may rally above the neckline of the inverse head and shoulders pattern and it did just that on April 13.
Generally, after a breakout from a pattern, the price turns down and retests the breakout level. In this case, the price may turn down and fall to the neckline.
If the price rebounds off the neckline with strength, it will suggest that the bulls have flipped the level into support. That may increase the likelihood of the resumption of the up-move. The ADA/USD pair may then rise to $0.52 and thereafter to the pattern target of $0.60.
Conversely, if the price turns down and plunges below the neckline, it will suggest that the breakout was a fake one. That may tug the price down to the 200-day SMA.
Hopefully, you have enjoyed today’s article for further coverage please check out our crypto Blog Page. Thanks for reading! Have a fantastic day! Live from the Platinum Crypto Trading Floor.
Earnings Disclaimer: The information you’ll find in this article is for educational purpose only. We make no promise or guarantee of income or earnings. You have to do some work, use your best judgement and perform due diligence before using the information in this article. Your success is still up to you. Nothing in this article is intended to be professional, legal, financial and/or accounting advice. Always seek competent advice from professionals in these matters. If you break the city or other local laws, we will not be held liable for any damages you incur.
