
Bitcoin is on track to finish March with gains of more than 16%. The banking crisis in the United States and Europe was largely responsible for the sharp rally in March. However, even as the crisis subsides, Bitcoin bulls have not hurried to book profits, indicating that they expect the rally to continue.
Following the collapse of the Silicon Valley Bank, American venture capital investor and entrepreneur Tim Draper suggested founders “consider a more diversified cash management approach” for uncertain times. He recommended founders keep “ at least 6 months of short-term cash in each of two banks, one local bank and one global bank, and at least two payrolls worth of cash in Bitcoin or other crypto currencies.” He said that Bitcoin was expected to act as a hedge against bank runs and the “poor over-controlling governance.”
The institutional investors have not jumped into the crypto space in a big way but that has not deterred MicroStrategy’s Michael Saylor from adding more Bitcoin to his portfolio. In its March 24 filing to the SEC, MicroStrategy said it had purchased 6,455 Bitcoin at an average price of roughly $23,238 per Bitcoin. After the latest purchase, MicroStrategy’s holding has ballooned to 138,955 Bitcoin bought at an average price of about $29,817.
After the strong performance in the past few days, Bitcoin’s rally may face headwinds in the near term. Bitcoin slipped below $27,000 on March 27 on reports that the Commodity Futures and Trading Commission filed a complaint against crypto exchange Binance, its co-founder, Changpeng Zhao, and its former chief compliance officer, Samuel Lim, alleging trading violations. Some analysts believe the case could be the beginning of the regulatory crackdown on Binance.
The extent of the fall in Bitcoin and the major altcoins will determine whether the current rally was a bull trap or the start of a new uptrend. If bulls manage to keep the prices above the crucial support levels, it may be an indication that the worst may be over.
Let’s study the charts of the major cryptocurrencies to spot the important support and resistance levels.
BTC/USD Market Analysis
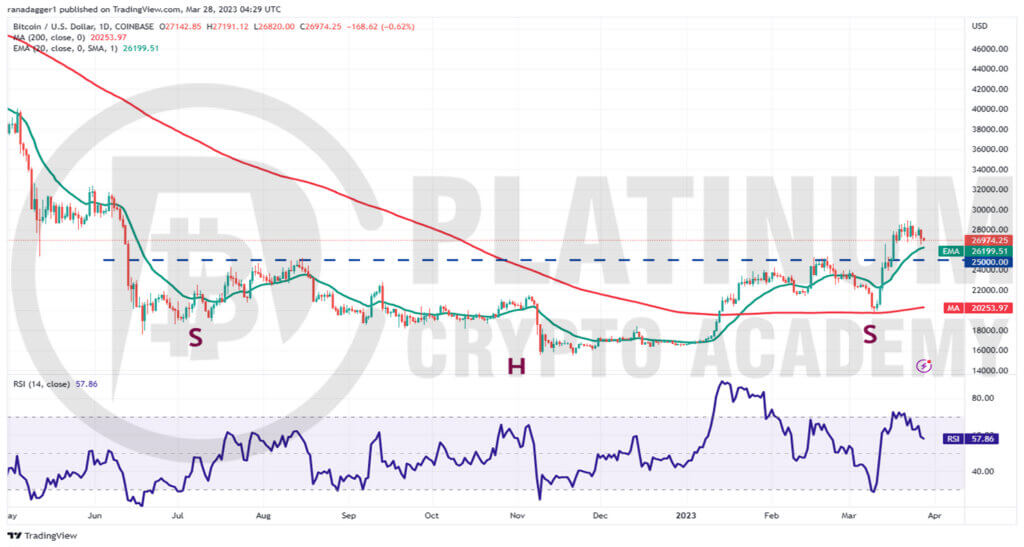
We warned investors that the bears will fiercely defend the $30,000 to $32,000 resistance zone and that is how it has been. Bitcoin climbed near $29,000 on March 22 but the bulls could not sustain the momentum.
The failure to break above the $30,000 resistance may tempt short-term bulls to book profits. The selling may intensify if the price slips below the 20-day exponential moving average (EMA). The next support to watch on the downside is $25,000.
A break and close below $25,000 will be the first indication that the bulls may be losing their grip. That could open the doors for a potential drop to the 200-day simple moving average (SMA).
Contrary to this assumption, if the price turns up from the 20-day EMA or $25,000, it will suggest that the sentiment remains positive.
The bulls will then again try to push the BTC/USD pair to the stiff overhead resistance zone between $30,000 and $32,000. If this zone is scaled, the pair could soar to $40,000.
ETH/USD Market Analysis
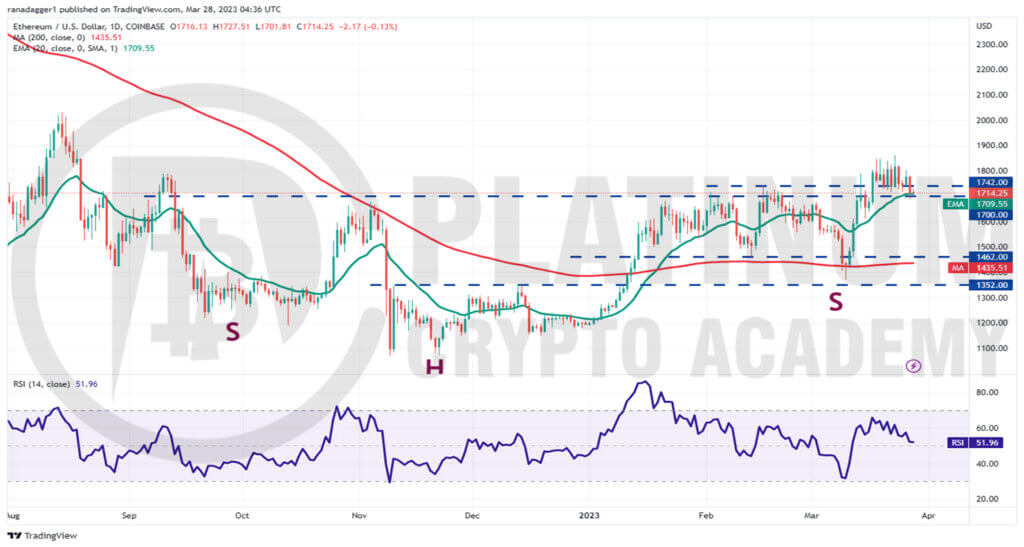
The bulls managed to defend the $1,700 to $1,742 support zone in the past few days but they could not sustain the price above $1,850. This suggests that bears are active at higher levels.
The 20-day EMA is flattening out and the RSI has dropped near the midpoint, indicating a balance between supply and demand.
This balance could tilt in favor of the bears if they sink and sustain the price below $1,700. There is a minor support at $1,600 but if this level cracks, the selling could accelerate and the pair may plummet to $1,462.
Contrarily, if the price sharply turns up from the current level or $1,600, it will suggest solid buying at lower levels. That will increase the likelihood of a break above the overhead resistance near $1,850.
If that happens, the ETH/USD pair could pick up momentum and soar to $2,000 and thereafter to $2,200.
BNB/USD Market Analysis
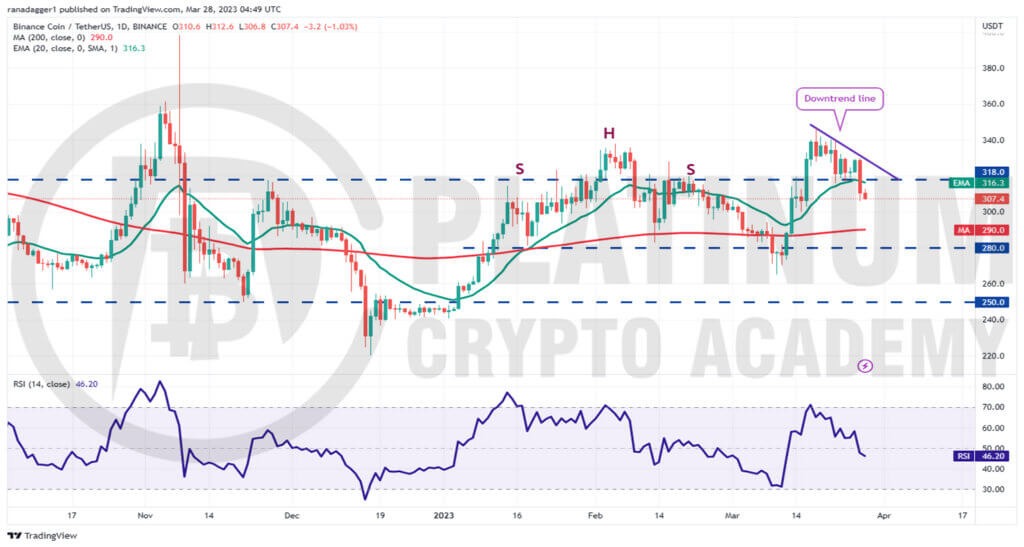
We had cautioned traders that if the $338 level breaks down, Binance Coin could fall to $318 and that is what happened on March 22.
The bulls defended the level for a few days but the aggressive selling on March 27 pulled the price below $318.
The first support on the downside is $300 and if this level crumbles, the BNB/USD pair could tumble to the 200-day SMA.
Buyers are expected to defend this level with all their might because if they fail to do that, the selling could pick up and the pair may plunge to $265.
The first sign of strength will be a break and close above the downtrend line. Such a move will open the gates for a possible retest of the overhead resistance at $346. The bulls will have to overcome this barrier to enhance the prospects of a rally to $400.
XRP/USD Market Analysis
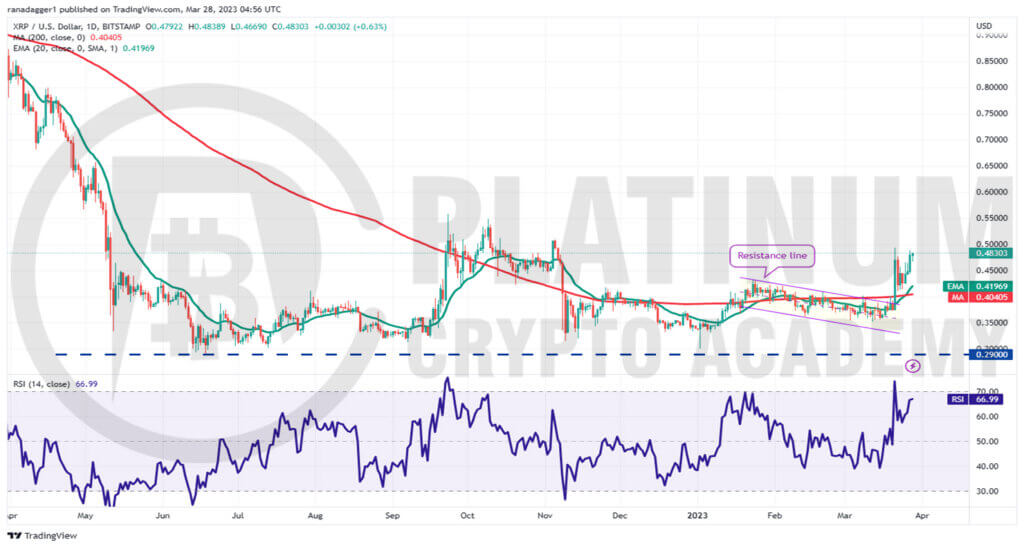
We highlighted in our previous analysis that a tight consolidation near an overhead resistance usually resolves to the upside and that is what happened on March 21.
We had also projected that the breakout could carry the price to $0.43 and thereafter to $0.51 and the pair came close to achieving the second target on March 21 and 27.
The upsloping 20-day EMA and the RSI in the positive territory indicate that bulls are in command.
If buyers thrust the price above $0.51, the pair could rise to $0.56. This is an important level for the bears to protect because a break above it could drive the price to $0.65 and subsequently to $0.80.
Conversely, if the price turns down and breaks below the 20-day EMA, it will suggest that the bulls may be rushing to the exit. That could sink the price to the 200-day SMA.
ADA/USD Market Analysis
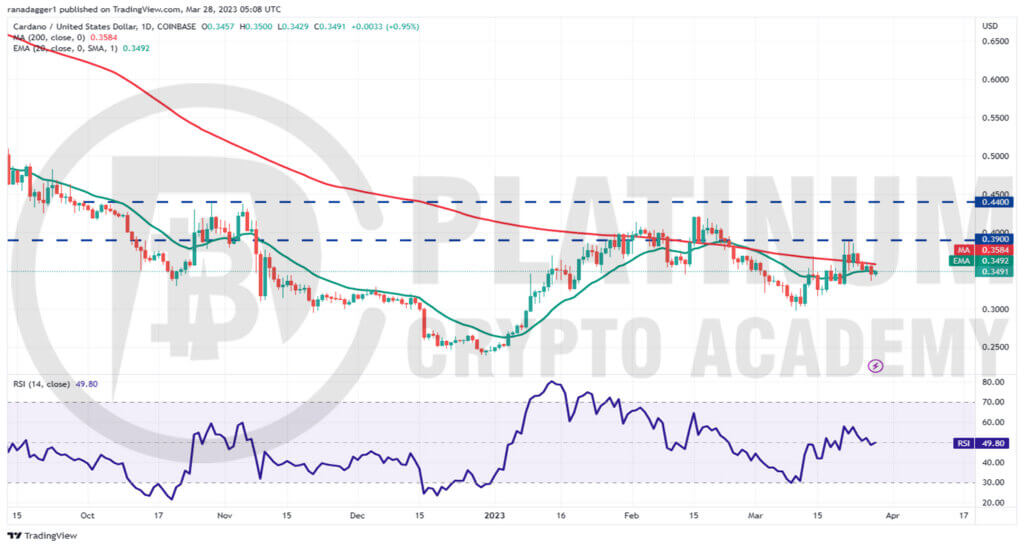
Buyers pushed Cardano above the 200-day SMA on March 21 but they could not clear the hurdle at $0.39. The failure to rise above the overhead resistance may have tempted short-term traders to book profits. That pulled the price below the 200-day SMA on March 25.
The 20-day EMA has flattened out and the RSI is near the midpoint, indicating a range-bound action in the near term.
The upper boundary of the range is $0.39. If bulls overcome this obstacle, the ADA/USD pair could soar to the $0.42 to $0.44 resistance zone. This is an important zone to keep an eye on because a break above $0.44 will complete a bullish inverse head and shoulders pattern.
On the downside, there is a minor support at $0.33 and then again at $0.32. The vital support remains at $0.30. If this level is violated, the pair may plummet toward $0.24.
Hopefully, you have enjoyed today’s article for further coverage please check out our crypto Blog Page. Thanks for reading! Have a fantastic day! Live from the Platinum Crypto Trading Floor.
Earnings Disclaimer: The information you’ll find in this article is for educational purpose only. We make no promise or guarantee of income or earnings. You have to do some work, use your best judgement and perform due diligence before using the information in this article. Your success is still up to you. Nothing in this article is intended to be professional, legal, financial and/or accounting advice. Always seek competent advice from professionals in these matters. If you break the city or other local laws, we will not be held liable for any damages you incur.
")