
Bitcoin investors weighed a sigh of relief after the European Union shot down a proposed rule that could have limited the cryptocurrencies that use proof-of-work. The focus will now shift to the United States Federal Reserve policy meeting on March 16, which could result in increased volatility.
Without a major trigger, Bitcoin prices have been range-bound in 2022. While long-term investors seem to be accumulating on dips, the short-term traders who have purchased at higher levels may be liquidating their positions on rallies near $47,000 to “get their initial investment back,” said Brett Munster at Blockforce Capital.
A positive sign of accumulation by long-term investors can be seen in the Bitcoin balances on major crypto exchanges, which have been reducing. Data from on-chain analytics firm CryptoQuant shows that combined Bitcoin balances across 21 major exchanges have dropped to their lowest level since August 2018.
During this period of uncertainty and high inflation, Tesla CEO Elon Musk advised his followers to “own physical things like a home or stock in companies you think make good products, than dollars when inflation is high.” Musk added that he owns Bitcoin, Ethereum and Dogecoin and does not plan to sell his crypto holdings.
Although a Bitcoin rally to $100,000 seems like a distant dream at current levels, several investors remain bullish for the long term. Apple co-founder Steve Wozniak while speaking on the podcast “Steve-O’s Wild Ride,” said he expects Bitcoin to reach $100,000 due to the high interest in crypto.
CoinShares’ latest Digital Asset Fund Flows Weekly Report showed an outflow of $110 million after seven consecutive weeks of inflows. This shows that some investors may be reducing their crypto exposure due to its lacklustre performance compared to gold.
Could Bitcoin break below the support levels or will bulls be able to defend it? What do the charts project? Read the analysis of the major cryptocurrencies to find out.
BTC/USD Market Analysis
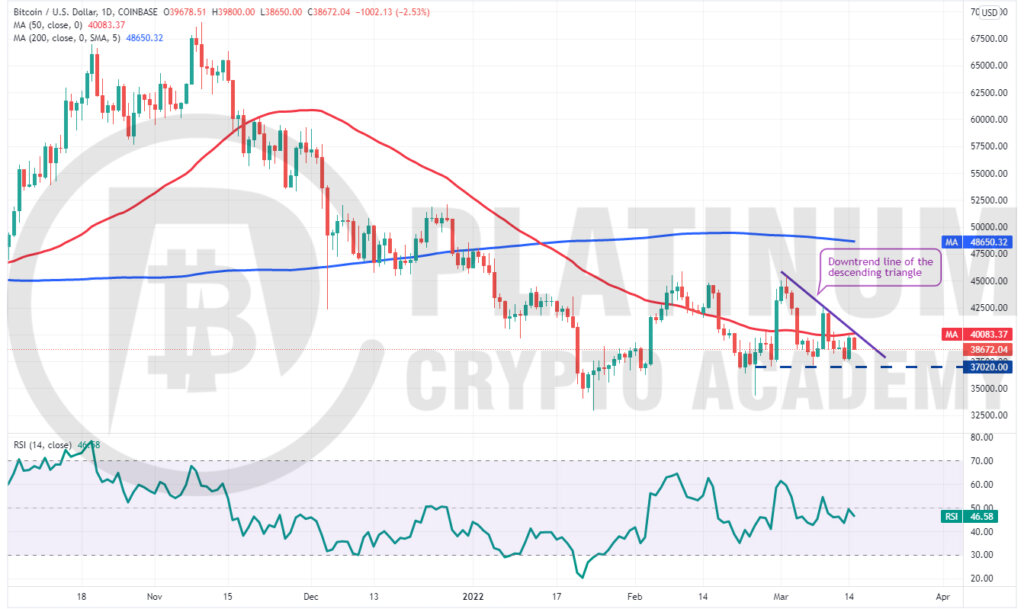
Bitcoin has formed a descending triangle pattern which will complete on a break and close below $37,020. The BTC/USD pair could then decline to the strong support zone of $34,322 and $32,933.
Contrary to this assumption, if the price rebounds off $37,020, it will suggest that bulls are accumulating near this support. The buyers will then attempt to push and sustain the price above the downtrend line and the 50-day simple moving average (SMA).
Such a move will invalidate the bearish setup, which could attract buyers. The pair could then start its northward march toward the overhead resistance at $45,500 where the bears are expected to mount a strong defence.
The flat moving averages and the relative strength index (RSI) near 47 point to a possible range-bound action in the short term.
Traders may wait for the price to break and close above the 50-day SMA before turning positive. Bottom fishing may be avoided if the price sustains below $37,000.
ETH/USD Market Analysis
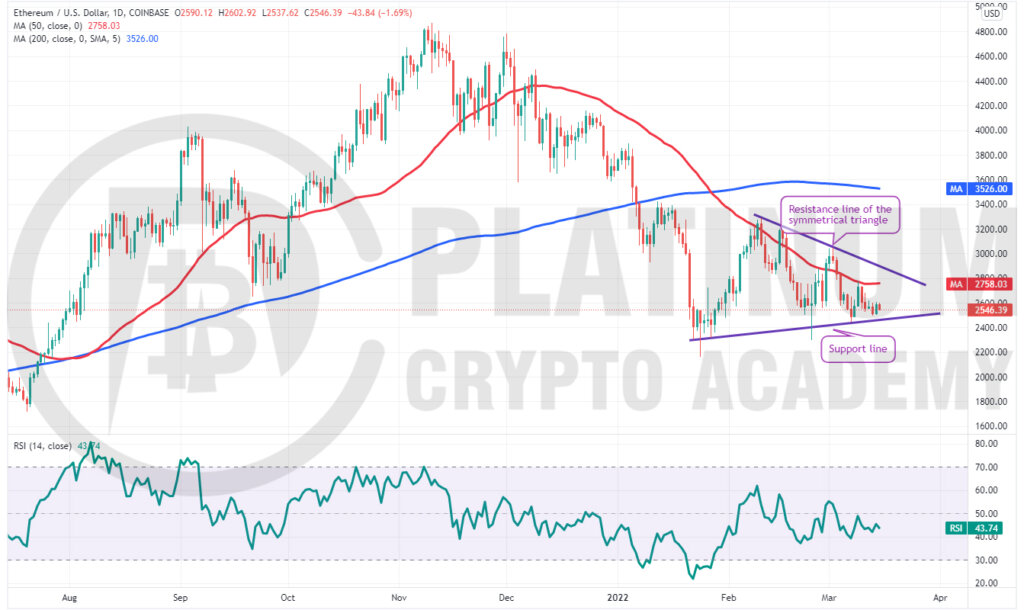
Ether’s rebound off the support line of the symmetrical triangle fizzled out at the 50-day SMA on March 9. This indicates that bears are selling at every resistance level.
If the price breaks and sustains below the support line of the triangle, it will suggest that the bears have overpowered the bulls. That could indicate the resumption of the downtrend.
The ETH/USD pair could drop to $2,159 where the bulls may attempt to stall the decline. Any rebound is likely to face stiff resistance at the breakdown level from the triangle. A break and close below $2,159 could open the doors for a possible decline to $2,000.
Alternatively, if the price bounces off the support line, the bulls will make one more attempt to push the pair above the 50-day SMA and the resistance line of the triangle. Traders could turn positive in the short term after the price closes above the triangle.
BNB/USD Market Analysis
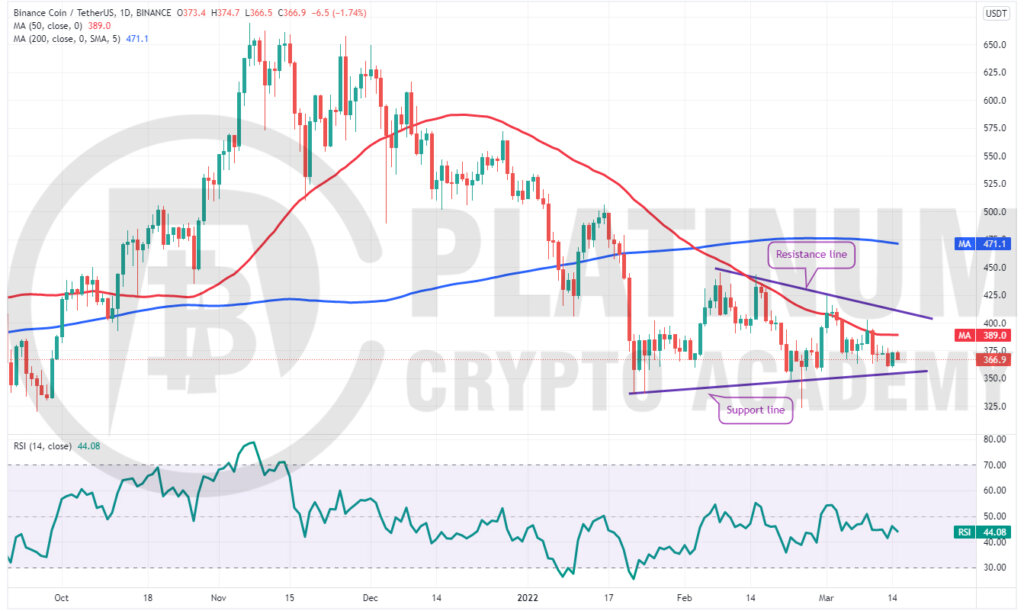
Binance Coin has formed a symmetrical triangle pattern, indicating indecision among the bulls and the bears. While the bulls are buying on dips to the support line, the bears are selling on rallies to the resistance line. The price action inside a triangle is usually random and volatile.
The price rebounded off the support line on March 14 but the bulls are struggling to sustain the higher levels. If bears succeed in sinking the price below the support line, the downtrend could resume.
The pair could first drop to $300 and then to the pattern target of the setup at $246. The RSI in the negative territory indicates the path of least resistance is to the downside.
This negative view will invalidate in the short term if the price rebounds off the support line and breaks above the 50-day SMA. Such a move will indicate accumulation on dips.
A possible trend change will be signalled after the price breaks and sustains above the triangle.
XRP/USD Market Analysis
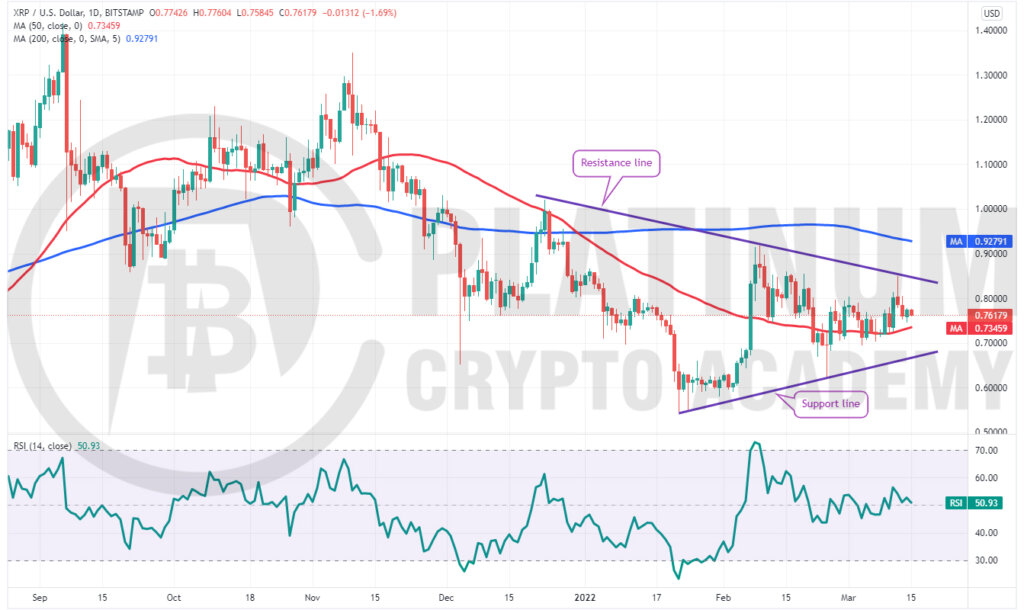
The buyers attempted to push the price above the resistance line of the triangle on March 12 but the bears were in no mood to let go of their advantage. The price turned down from the resistance line but a minor positive is that the bulls are attempting to defend the 50-day SMA.
If the price rebounds off the 50-day SMA, the buyers will again try to drive and sustain the pair above the resistance line. If they succeed, the XRP/USD pair could turn positive in the short term and rally toward the psychological level at $1.
On the other hand, if the price breaks below the 50-day SMA, the bears will fancy their chances and try to sink the pair below the support line.
This is an important level to keep an eye on because if it cracks, the pair could plummet to $0.62 and later drop to the critical support at $0.54.
ADA/USD Market Analysis
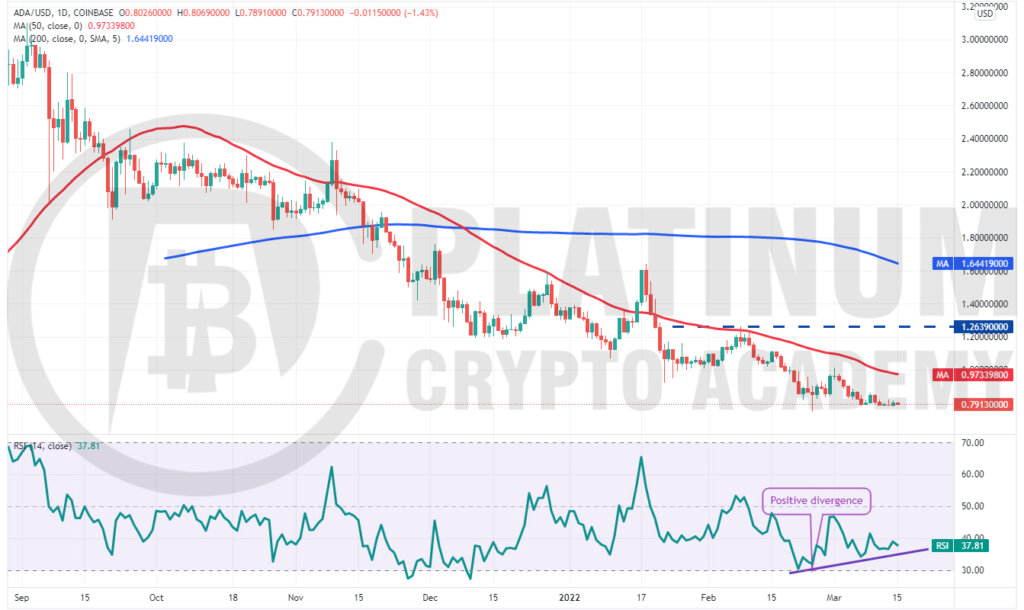
The bulls have been attempting to defend the $0.78 level for the past few days but the failure to achieve a strong rebound off it indicates a lack of demand at higher levels.
If the bulls fail to push and sustain the price above $0.87 within the next few days, the possibility of a break below $0.78 increases. If that happens, the ADA/USD pair could drop to the critical support at $0.74. A break and close below this level could signal the resumption of the downtrend. The pair could then slide to $0.60.
Alternatively, if the price rises from the current level and breaks above $0.87, the bulls will attempt to push the pair to the 50-day SMA. The positive divergence on the RSI indicates that the bearish momentum may be reducing.
A break and close above the 50-day SMA could provide an opportunity to short-term traders with a target objective of $1.26.
Hopefully, you have enjoyed today’s article for further coverage please check out our crypto Blog Page. Thanks for reading! Have a fantastic day! Live from the Platinum Crypto Trading Floor.
Earnings Disclaimer: The information you’ll find in this article is for educational purpose only. We make no promise or guarantee of income or earnings. You have to do some work, use your best judgement and perform due diligence before using the information in this article. Your success is still up to you. Nothing in this article is intended to be professional, legal, financial and/or accounting advice. Always seek competent advice from professionals in these matters. If you break the city or other local laws, we will not be held liable for any damages you incur.
