
Bitcoin is up 38.1% in January, its best start to the year since 2013 when it rose 44.05%. Another encouraging sign for investors is that February has historically been a strong month for Bitcoin. According to Coinglass data, since 2013, Bitcoin has ended the month of February in the red only in 2014 and 2018.
Along with the crypto space, the United States stock markets have also made a solid start in 2023. The S&P 500 has risen 4.64% this month, on track for its best January since 2019. Carson Group’s Ryan Detrick highlighted in a tweet that after a negative year, there have been five instances where the S&P has risen more than 5% in January and that has produced a 30% average return for the year.
This indicates a positive outlook for risky assets in 2023. All eyes will be on the US Federal Reserve, which concludes its two-day meeting on February 1. Although investors anticipate a 25 basis points hike, the focus will be on how high rates could climb in the next few months.
CFRA, the independent research firm, believes that the Fed’s rate hike on February 1 will be its last. If that assumption turns out to be true, then investors may expect a rate cut by the end of 2023 or early 2024. Historically, a new rate-easing cycle starts nine months after the last rate hike, said Sam Stovall, CFRA’s chief investment strategist, in a recent note.
A rate cut by the Fed is likely to encourage investors to take on more risk in their portfolios. CoinShares data showed that digital asset investment products saw $117 million of inflows last week, with Bitcoin attracting Lion’s share at $116 million. Interestingly, $4.4 million of the flows went into short-Bitcoin products, a sign that some investors continue to be skeptical of the current rally.
However, we believe that Bitcoin may have bottomed out and future corrections could be viewed as a buying opportunity. What are the important support and resistance levels to watch out for in the near term? Let’s look at the charts of Bitcoin and the major altcoins to find out.
BTC/USD Market Analysis
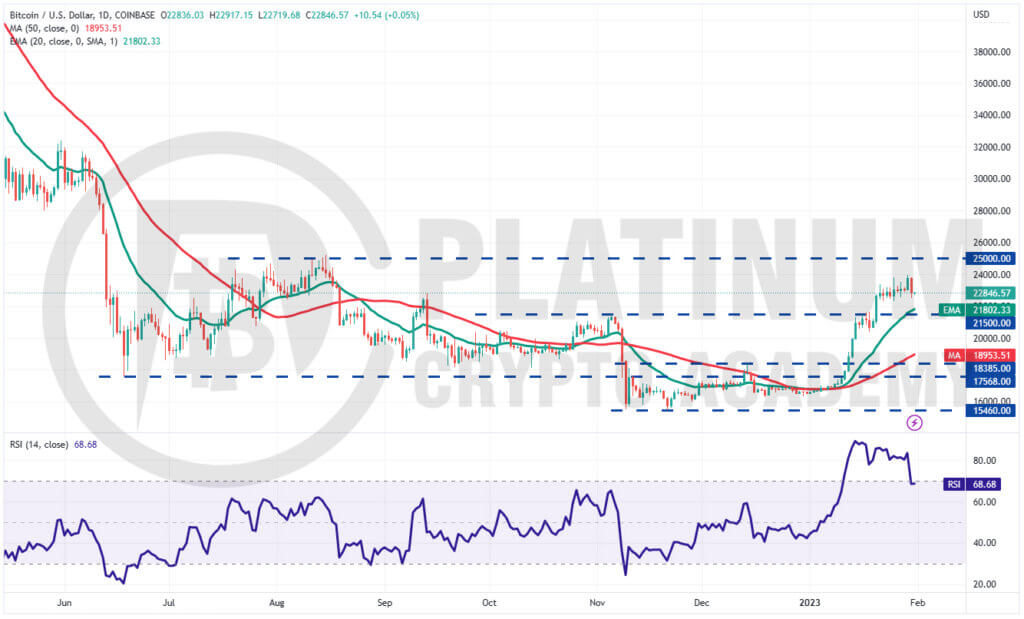
After consolidating for a few days, the bulls attempted to resume the up-move on January 29 but the higher levels attracted aggressive profit-booking on January 30.
We had warned in the previous analysis that the relative strength index was in the deeply overbought territory and a pullback was possible and that is what happened.
The bears will try to pull the price to the 20-day exponential moving average (EMA). This is an important level to keep an eye on because the bulls are likely to defend it aggressively.
A strong rebound off the 20-day EMA could increase the likelihood of a rally to $25,000 where the bears may mount a strong defense. If the bulls pierce this resistance, the BTC/USD pair could soar above $30,000 but we give it a low probability of occurring.
On the downside, a break below $21,500 could suggest that the bulls may be losing their grip. The pair could then slump to the psychologically important level of $20,000.
ETH/USD Market Analysis
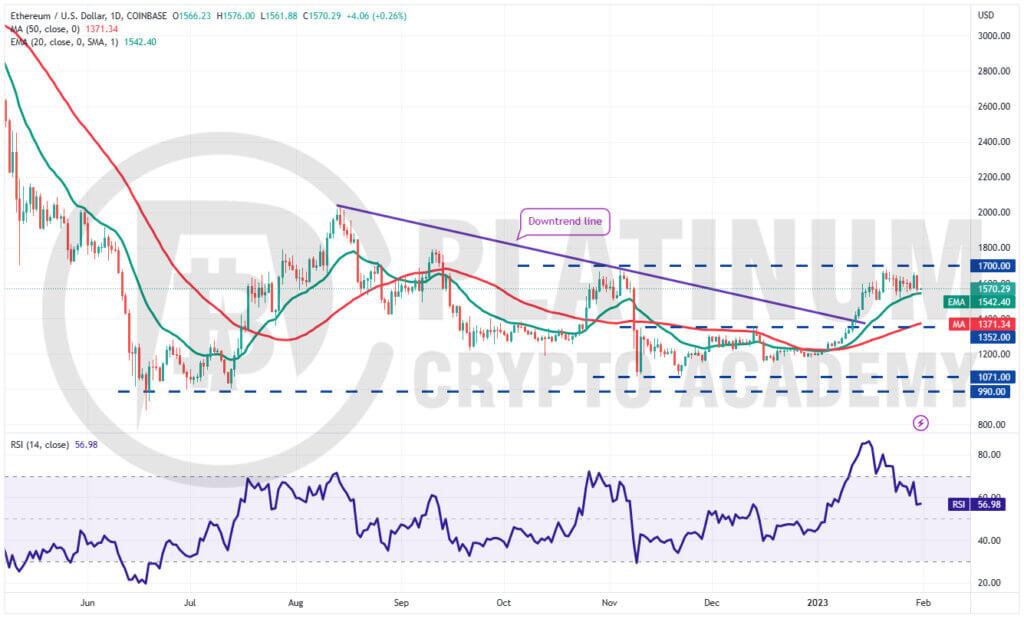
Ether remains stuck between the 20-day EMA and the overhead resistance at $1,700. This suggests indecision among the bulls and the bears about the next directional move.
The bulls are buying the dips to the 20-day EMA but the bears have not allowed the price to rise above $1,700. This tight-range trading is unlikely to continue for long.
If bears sink the price below the 20-day EMA and the $1,500 support, the ETH/USD pair could drop to the 50-day simple moving average (SMA). Such a move could keep the pair range-bound for a few days.
On the contrary, if the price turns up from the current level and breaks above $1,700, it will suggest that bulls have absorbed the supply from the bears.
The pair could then pick up momentum and start its northward journey to $2,000. The $1,800 level may act as a barrier but it is likely to be crossed.
BNB/USD Market Analysis
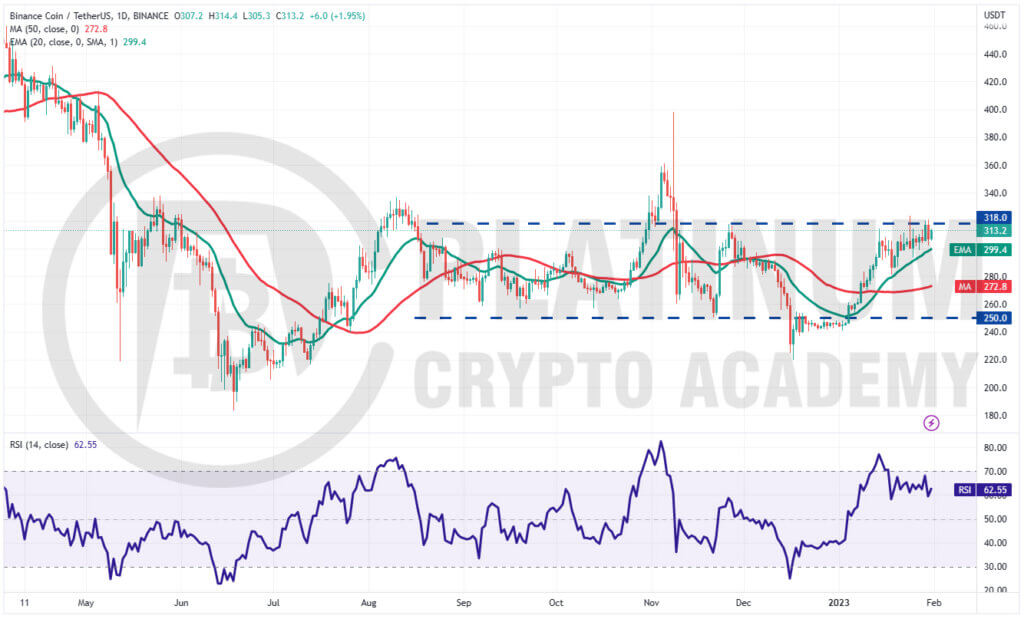
Binance Coin rose above the $318 resistance on January 24 but the bulls could not sustain the higher levels. The BTC/USD pair turned down and dropped to the 20-day EMA on January 25, as we had indicated in the previous analysis.
A positive sign is that the bulls did not allow the price to dip below the 20-day EMA. This indicates that the sentiment remains positive and traders are buying on dips.
That increases the likelihood of a break and close above $318. If that happens, the pair could pick up momentum and soar to $360.
This positive view could invalidate in the near term if the price turns down and plummets below the 20-day EMA. That could attract profit-booking by the short-term traders and pull the pair to $280. The pair could then remain stuck inside the $250 to $318 range for some more time.
XRP/USD Market Analysis
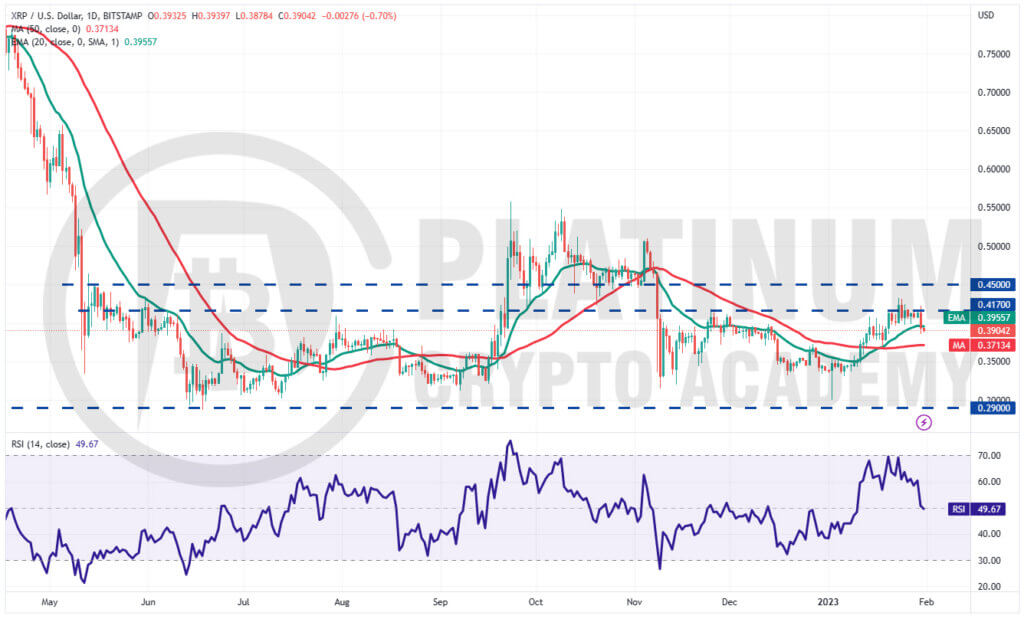
XRP traded near the overhead resistance of $0.41 for a large part of the last week but the bulls failed to drive and sustain the price above it. This may have attracted profit-booking by short-term traders.
The XRP/USD pair turned down on January 30 and plunged below the 20-day EMA. The bears will now try to sink the pair to the 50-day SMA where buying may emerge.
The 20-day EMA is flattening out and the RSI is near the midpoint, indicating a range-bound action in the near term.
If bulls want to gain back control, they will have to quickly push the price back above the 20-day EMA and challenge the resistance near $0.41. A break above this level could open the doors for a possible rally to $0.45.
ADA/USD Market Analysis
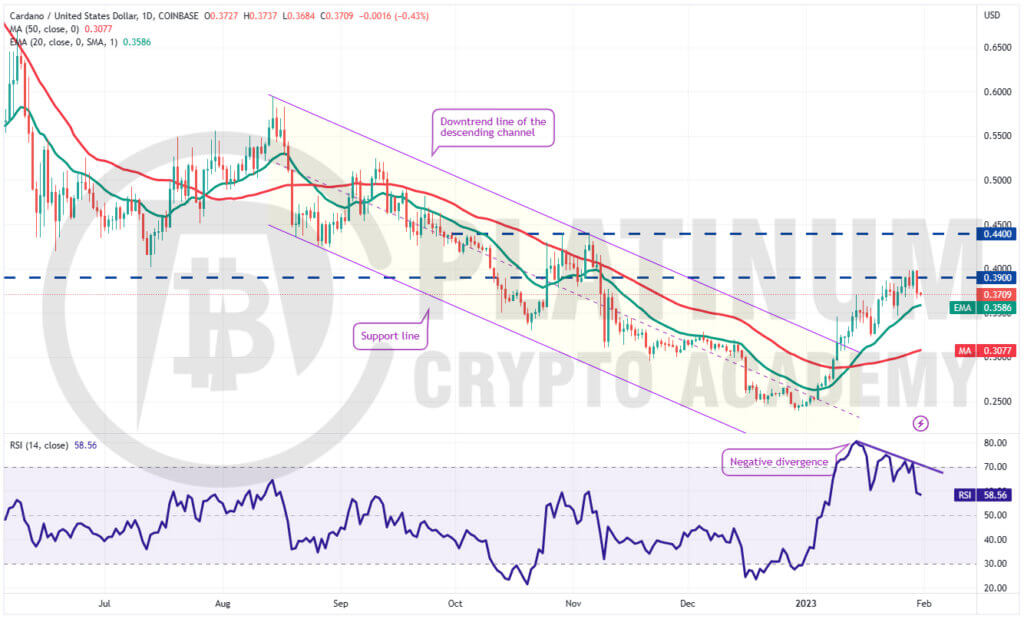
The bulls propelled the price above $0.39 on January 29 but they could not build upon this strength. The bears sold aggressively on January 30 and yanked the price back below $0.39.
Although the upsloping 20-day EMA indicates advantage to buyers, the negative divergence on the RSI suggests that the positive momentum may be weakening.
If the price breaks below the 20-day EMA, the short-term traders may be tempted to book profits. That could drag the price to $0.32 which could act as a strong support.
Conversely, if the price turns up from the current level or the 20-day EMA, it will signal strong demand at lower levels. The bulls will then again try to catapult the price above $0.40. If they succeed, the ADA/USD pair could surge to $0.44.
Hopefully, you have enjoyed today’s article for further coverage please check out our crypto Blog Page. Thanks for reading! Have a fantastic day! Live from the Platinum Crypto Trading Floor.
Earnings Disclaimer: The information you’ll find in this article is for educational purpose only. We make no promise or guarantee of income or earnings. You have to do some work, use your best judgement and perform due diligence before using the information in this article. Your success is still up to you. Nothing in this article is intended to be professional, legal, financial and/or accounting advice. Always seek competent advice from professionals in these matters. If you break the city or other local laws, we will not be held liable for any damages you incur.
")