The ongoing cryptocurrency bear market deepened further with the collapse of the crypto exchange FTX and its affiliated companies. After failing to reach a deal to be acquired by Binance, FTX filed for Chapter 11 bankruptcy protection in the United States on November 11.
Just after filing for Chapter 11 bankruptcy in the US, an admin in FTX’s Telegram channel announced that the exchange had been hacked and $477 million was suspected to be stolen.
This entire saga hurt the already fragile sentiment in the crypto space. That brought down the entire crypto market capitalization to under $800 billion on November 10, according to coinmarketcap. Several crypto hedge funds and market makers are likely to take a big hit with the collapse of FTX and this has increased fears of contagion.
The loss of confidence in crypto exchanges has led to investors withdrawing Bitcoin to self-custody wallets at a record rate of 106,000 Bitcoin per month. Such large outflows have happened only thrice in Bitcoin’s history, in April 2020, November 2020, and June-July 2022, according to analytics provider Glassnode.
DragonFly Capital Haseeb Quershi said to Yahoo Finance that the bankruptcy proceedings are expected to be messy and will bring bad publicity to the crypto industry.
On similar lines, ARK Invest Director of Research Frank Downing and analyst Yassine Elmandjra said in a newsletter that the collapse of FTX “is one of the most damaging events in crypto history.” They believe this event could “delay institutional crypto adoption by years and perhaps give regulators license to take draconian measures.”
Amidst the gloom and doom, Elon Musk gave hope to crypto investors when he said in a tweet on November 14 that “Bitcoin will make it, but might be a long winter.” Another positive sign was that digital asset investment products saw an inflow of $42 million in the week ending November 13, the largest inflow in 14 weeks, according to CoinShares Digital Asset Fund Flows Weekly Report. This suggests that select institutional investors may be buying the dips.
Has the decline ended? Is it a good time to start buying? Read our analysis of the major cryptocurrencies to find out.
BTC/USD Market Analysis
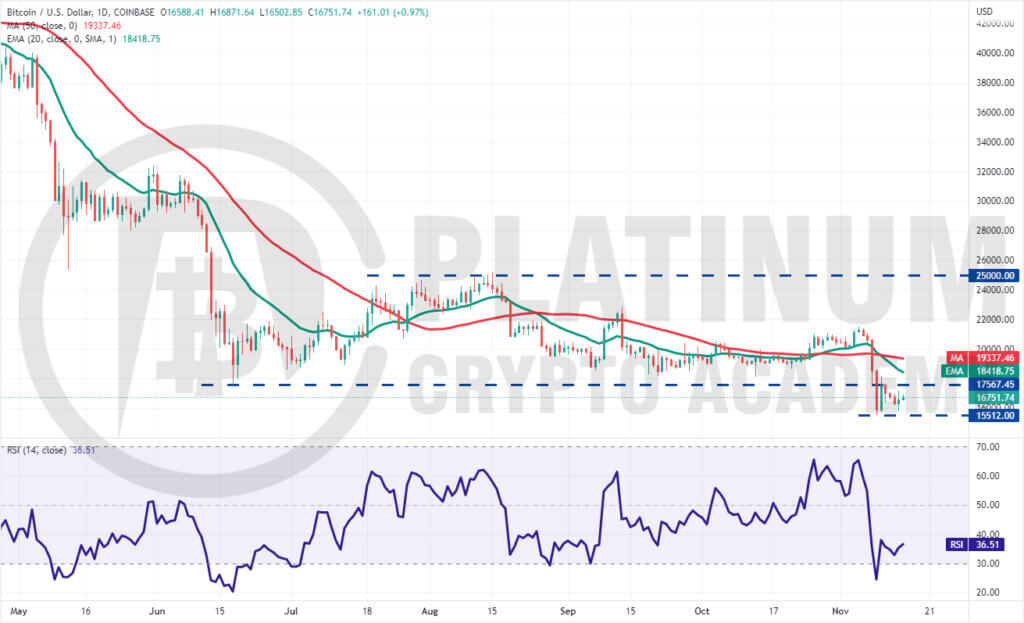
Bitcoin plunged and closed below the crucial support of $17,567.45 on November 9. This pulled the relative strength index (RSI) to oversold levels, indicating that a consolidation or relief rally was possible.
Buyers attempted to push the price back above the breakdown level of $17,567.45 on November 10 but the bears held their ground. The BTC/USD pair is currently stuck between $17,567.45 and $15,512.
The first sign of strength will be a break above the resistance zone between $17,567.45 and the 20-day exponential moving average (EMA). If that happens, the pair could then challenge the psychological level at $20,000 and later $21,500.
On the other hand, if the price turns down from the overhead resistance zone, it will suggest that the sentiment remains negative and traders are selling on every minor rally. The pair could then again drop to the support at $15,512.
If this level cracks, the selling could intensify further and the pair could drop to $12,000.
ETH/USD Market Analysis
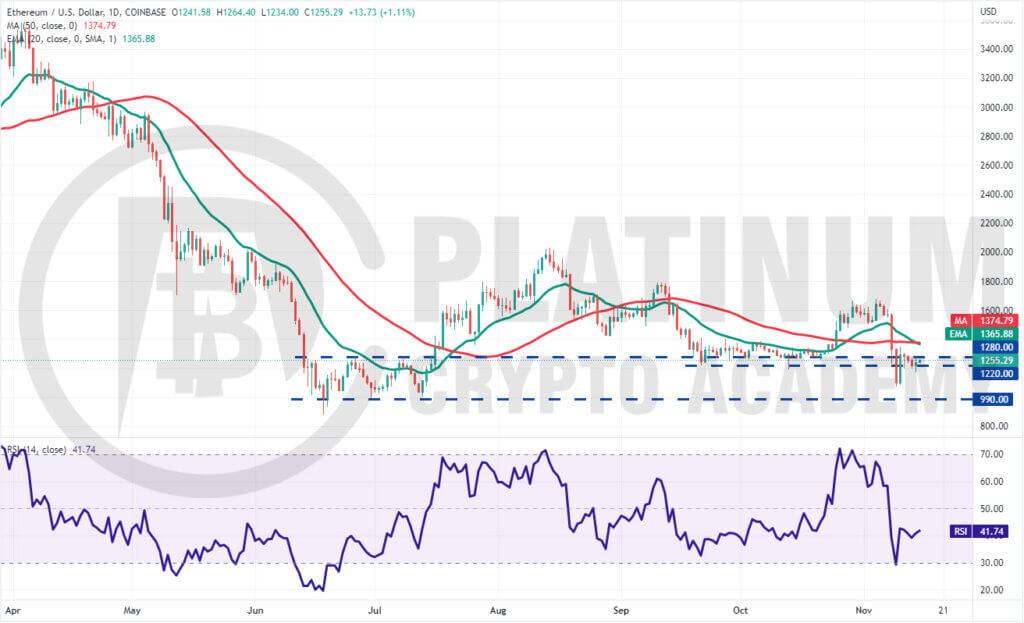
Ether has been relatively strong because it is trading well above its critical support zone of $990 to $879.80. Although the bears pulled the price below the $1,220 support on November 9, the ETH/USD pair rebounded off $1,099.90.
However, the recovery stalled just below the 50-day simple moving average (SMA) on November 10, indicating that bears are active at higher levels.
The relief rally is likely to face stiff resistance at the moving averages but if bulls clear this obstacle, the momentum could pick up and the pair could soar to $1,677.
Contrary to this assumption, if the recovery falters near the moving averages, the bears may make one more attempt to extend the decline below $1,099.90. If they succeed, the next stop could be $990.
The downtrend could resume if bears sink the price below $879.80 but we believe it has a low probability of occurring, barring a black swan event.
BNB/USD Market Analysis
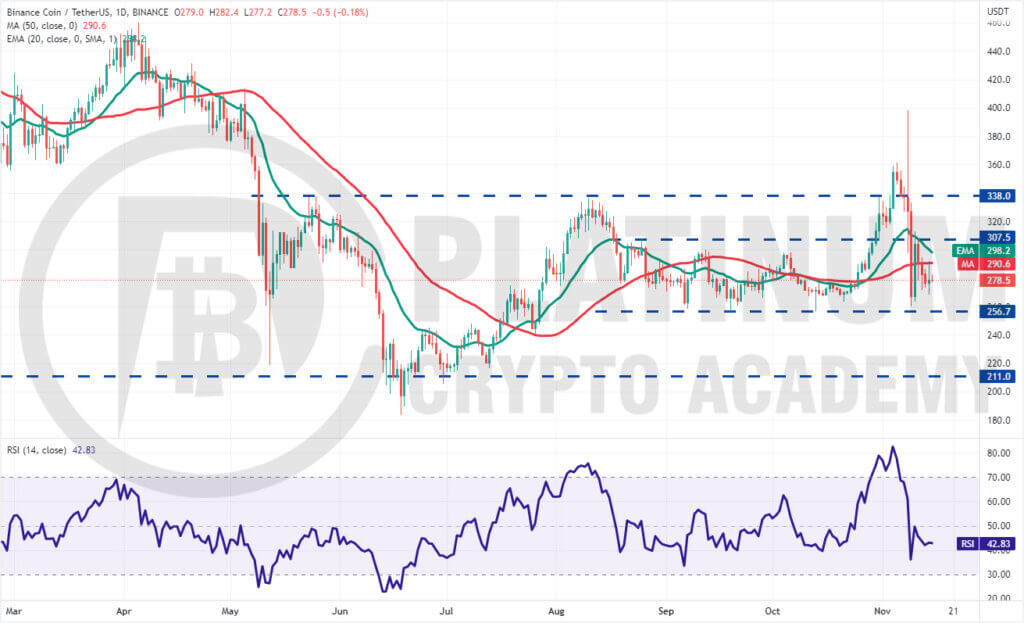
Binance Coin has been hugely volatile in the past week. It soared to $398.30 on November 8 but then quickly gave back all the gains and plummeted to $260.20 on November 9.
Buyers bought the dip and attempted to start a recovery on November 10 but they could not overcome the barrier at the 20-day EMA. This suggests that the sentiment has weakened and traders are selling on rallies.
The critical support to watch on the downside is $256.70. If this support gives way, the selling could pick up and the BNB/USD pair may drop to $239 and thereafter to $220.
Alternatively, if the support at $256.70 holds, the pair is likely to witness a tight range-bound action for a few days. If buyers want to gain the upper hand, they will have to push the price above the overhead resistance zone between the 20-day EMA and $307.50. That could open the doors for a rally to $338.
XRP/USD Market Analysis
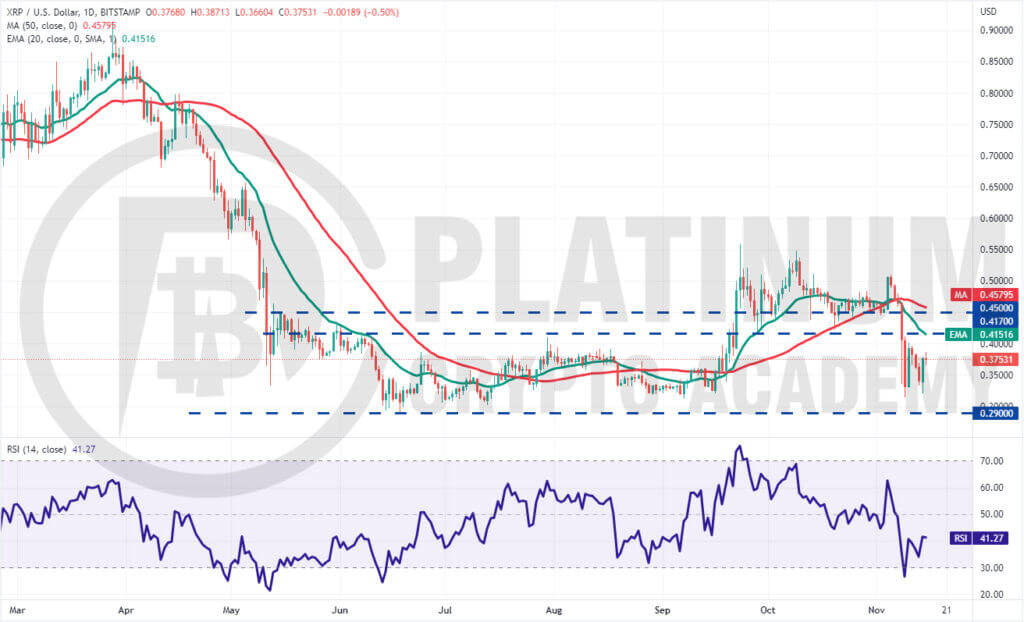
XRP broke below the strong support at $0.41 on November 8 and the selling continued on November 9, pulling the price to $0.31. The bulls purchased this dip but are facing selling near $0.41, indicating that bears have flipped this level into resistance.
The bears tried to extend the decline and challenge the vital support at $0.29 on November 14 but the bulls halted the drop near $0.32. This suggests strong demand in the zone between $0.29 and $0.32.
If this zone collapses, the XRP/USD pair could start the next leg of the downtrend. The pair could then drop to $0.25. Any recovery attempt is likely to face stiff resistance in the zone between $0.41 and $0.45. Buyers will have to scale this zone to indicate that the corrective phase may be over
ADA/USD Market Analysis
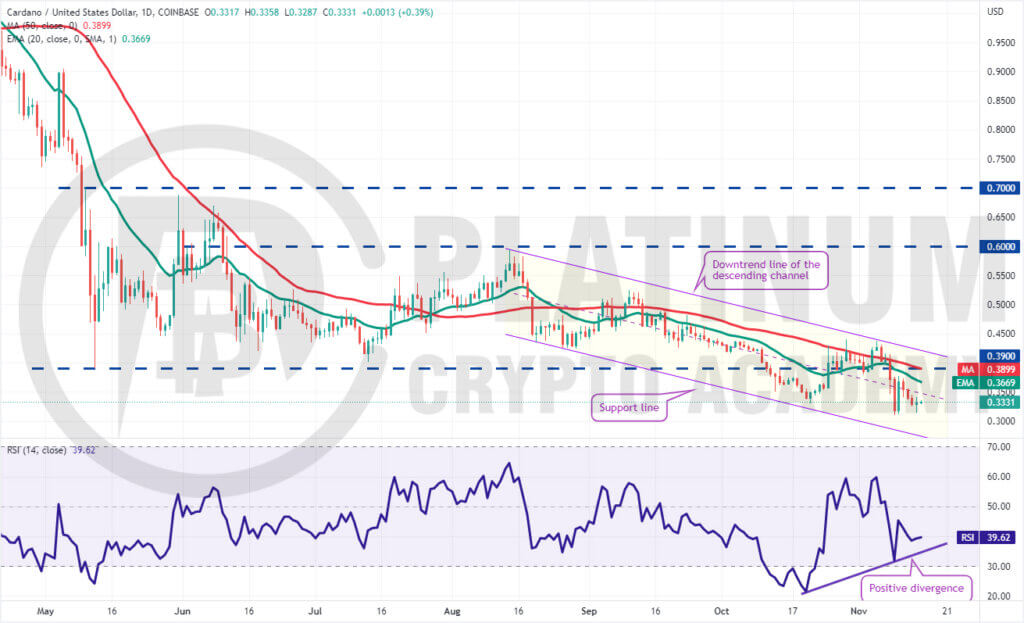
XRP broke below the strong support at $0.41 on November 8 and the selling continued on November 9, pulling the price to $0.31. The bulls purchased this dip but are facing selling near $0.41, indicating that bears have flipped this level into resistance.
The bears tried to extend the decline and challenge the vital support at $0.29 on November 14 but the bulls halted the drop near $0.32. This suggests strong demand in the zone between $0.29 and $0.32.
If this zone collapses, the XRP/USD pair could start the next leg of the downtrend. The pair could then drop to $0.25. Any recovery attempt is likely to face stiff resistance in the zone between $0.41 and $0.45. Buyers will have to scale this zone to indicate that the corrective phase may be over
Hopefully, you have enjoyed today’s article for further coverage please check out our crypto Blog Page. Thanks for reading! Have a fantastic day! Live from the Platinum Crypto Trading Floor.
Earnings Disclaimer: The information you’ll find in this article is for educational purpose only. We make no promise or guarantee of income or earnings. You have to do some work, use your best judgement and perform due diligence before using the information in this article. Your success is still up to you. Nothing in this article is intended to be professional, legal, financial and/or accounting advice. Always seek competent advice from professionals in these matters. If you break the city or other local laws, we will not be held liable for any damages you incur.
")