
The yield on the benchmark US 10-year Treasury note slipped below 4% last week, triggering a sharp recovery in the US equities markets. The 10-year Treasury is closely watched by Market observers because it influences mortgages and car loans. And a soaring yield could create problems for the economy.
The strength in the US stock markets failed to ignite buying in Bitcoin, which dropped about 4.77% last week. The weakness in the cryptocurrency sector was due to the crisis at Silvergate. The crypto bank announced a delay in filing its annual report and said that it was shutting its popular instant settlement service SEN on March 3. It also warned that it was uncertain if the bank could continue to operate for the next twelve months.
Following the news, Coinbase, Circle, Crypto.com, Galaxy Digital, Gemini, and several other crypto firms cut ties with Silvergate. This soured sentiment as crypto investors brace for any possible fallout of the Silvergate saga.
Over the next few days, macroeconomic events may influence the price of Bitcoin and altcoins. Federal Reserve Chairman Jerome Powell’s testimony at the Congress on March 7 and 8 will provide insights on the future pace of rate hikes. That will be followed by the February jobs report on March 10, which will be another short-term trigger that could boost volatility.
Meanwhile, the sentiment among institutional investors remains subdued. CoinShares said in its weekly report that digital investment products witnessed a fourth consecutive week of negative sentiment with outflows totaling $17 million last week. Short-bitcoin products had an inflow of $1.8 million, indicating “continued investor concerns over regulatory uncertainty for the asset class,” the report added.
While institutional investors are cautious, retail traders seem to have capitalized on the weakness in Bitcoin. Glassnode data shows that the number of wallets holding at least one Bitcoin, also known as wholecoiners, is nearing the one million mark.
Could Bitcoin and major altcoins stage a strong recovery in the next few days? Let’s study the charts to find out.
BTC/USD Market Analysis
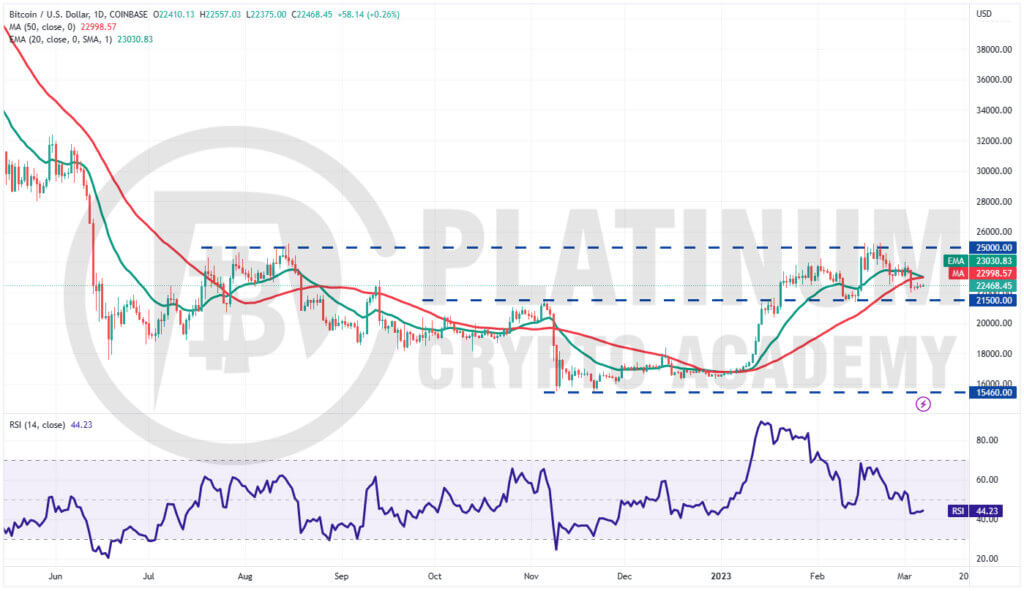
We said in the previous analysis that Bitcoin’s price may remain volatile between $21,500 and $25,000 and that is how it has been.
The moving averages are about to complete a bearish crossover and the relative strength index (RSI) has dipped into the negative territory, indicating advantage to the bears.
Any recovery attempt is likely to face strong resistance at the 20-day exponential moving average (EMA). The bears will then try to sink the price below the strong support of $21,500 but the bulls are expected to defend the level with all their might.
If the price bounces off $21,500, the BTC/USD pair may extend its consolidation for a few more days.
Conversely, if the price breaks below $21,500, it will suggest that the bulls have given up. That may start a deeper correction toward the psychologically vital support at $20,000.
On the upside, a break and close above the 20-day EMA will signal that the bulls are attempting a comeback. The pair could then rise to $24,000 and thereafter to $25,000.
ETH/USD Market Analysis
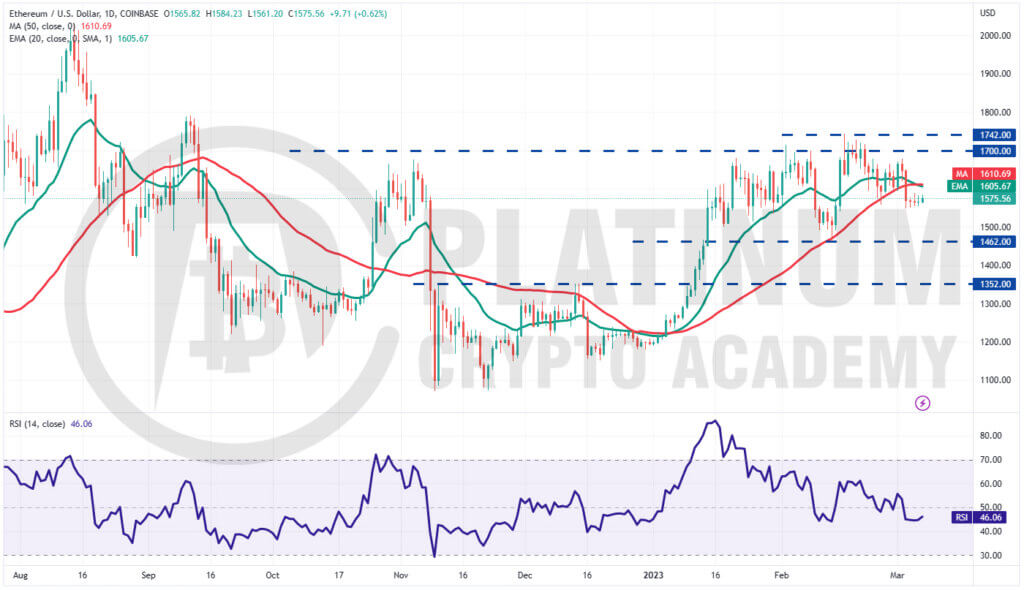
The tight consolidation in Ether resolved to the downside with a break and close below the 50-day simple moving average (SMA) on March 3.
Since then, the price has been trading inside a tight range, indicating indecision among the bulls and the bears.
The 20-day EMA has started to turn down and the RSI is near 46, suggesting that bears have a slight edge. The sellers will try to sell the relief rallies to the moving averages.
A break and close below $1,547 could open the doors for a possible decline to $1,462. This level is likely to attract strong buying by the bulls.
If bulls want to gain the upper hand, they will have to push and sustain the price above the moving averages. That could open the doors for a possible rise to the overhead zone of $1,700 to $1,742.
BNB/USD Market Analysis
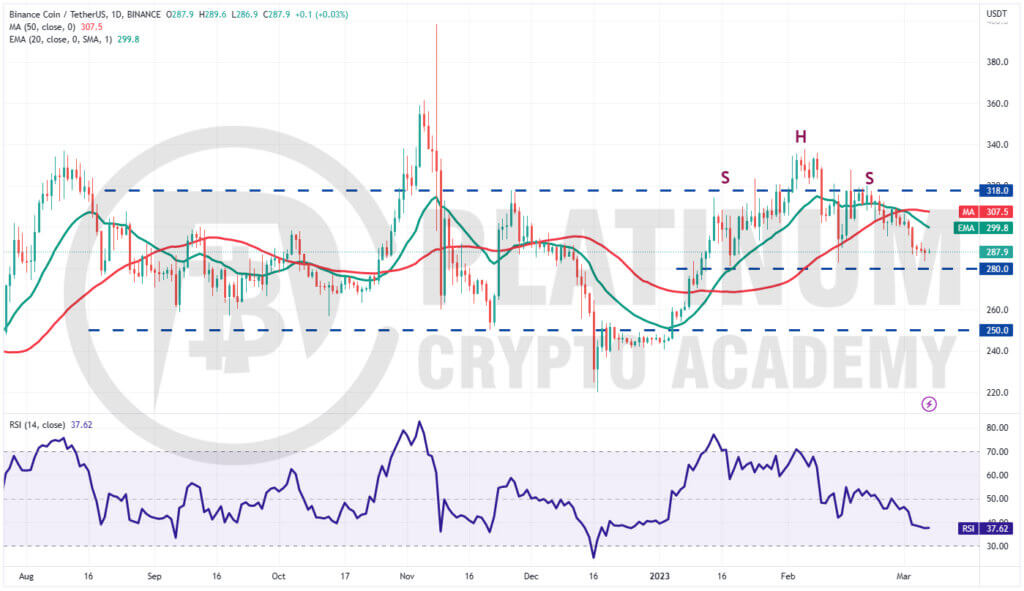
We cautioned traders in the previous analysis that the moving averages were on the verge of a bearish crossover and that indicates advantage to the bears. We also said that if the $295 support cracks, Binance Coin could plummet to $280 and that is how it has played out.
Buyers are expected to fiercely defend the $280 support but the recovery is likely to face selling near the 20-day EMA. If the price turns down from the 20-day EMA, the bears will again try to sink the BNB/USD pair below $280.
If they manage to do that, the pair will complete a bearish head and shoulders pattern, which has a target objective of $220.
This negative view could invalidate in the near term if buyers drive and sustain the price above the 20-day EMA. Such a move will indicate that the pair may remain stuck between $280 and $318 for some more time.
XRP/USD Market Analysis
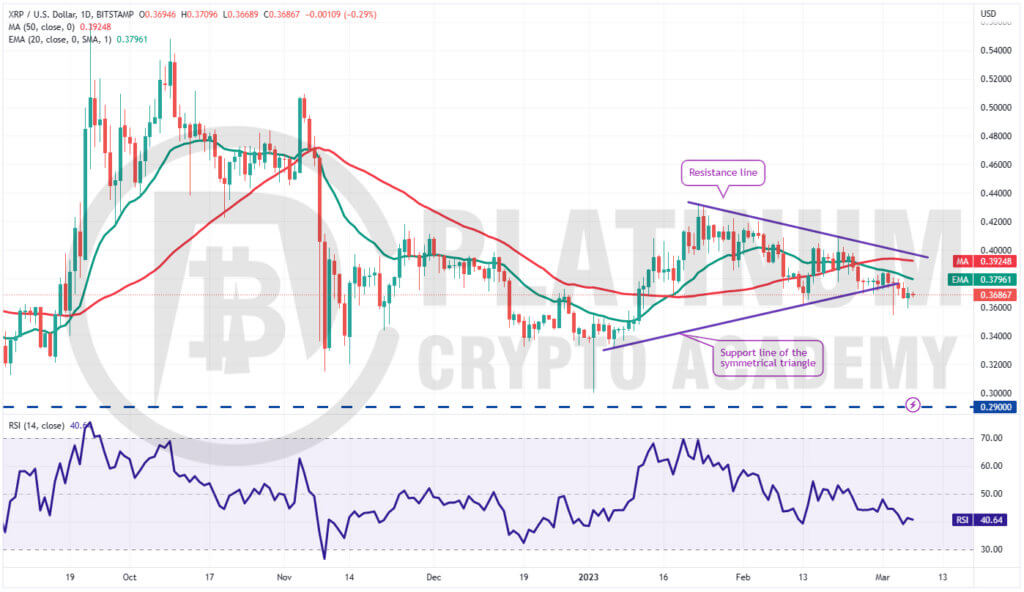
We said in our previous analysis that the path of least resistance was to the downside and that is how XRP behaved.
The bears pulled the XRP/USD pair below the support line of the triangle on March 3 but the long tail on the candlestick shows strong buying at lower levels.
However, the bears sold the attempt to push the price back into the triangle, flipping the breakdown level into resistance.
The downsloping 20-day EMA and the RSI in the negative zone indicate that bears have the upper hand. If the $0.35 support gives way, the pair may dive to $0.33 and then to $0.29.
If bulls want to prevent the downside, they will have to quickly thrust the pair above the resistance line of the triangle. If they do that, the pair could pick up momentum and soar toward $0.43.
ADA/USD Market Analysis
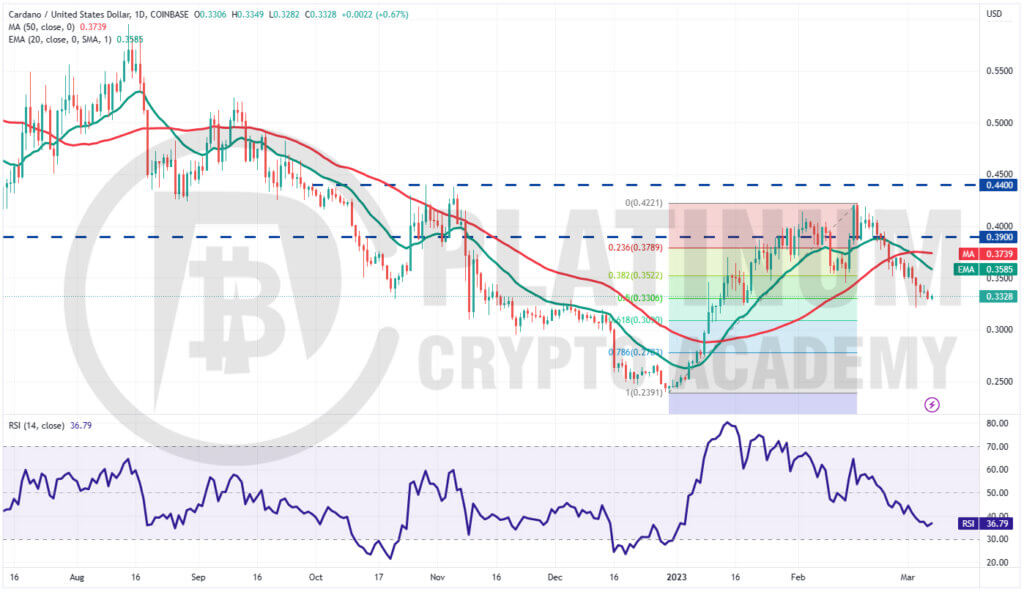
We mentioned in the previous analysis that Cardano could drop to $0.32 and that happened on March 3.
The 20-day EMA is sloping down and the RSI is in the negative region, indicating that bears are in control.
If the $0.32 support breaks down, the ADA/USD pair may extend its drop to the 61.8% Fibonacci retracement level of $0.30.
This is an important level for the bulls to defend because if it collapses, the pair may complete a 100% retracement and dive to $0.24.
The first sign of strength will be a break and close above the 20-day EMA. That will indicate that the bears may be losing their grip. The pair could then rise to the 50-day SMA and thereafter attempt a rally to $0.42.
Hopefully, you have enjoyed today’s article for further coverage please check out our crypto Blog Page. Thanks for reading! Have a fantastic day! Live from the Platinum Crypto Trading Floor.
Earnings Disclaimer: The information you’ll find in this article is for educational purpose only. We make no promise or guarantee of income or earnings. You have to do some work, use your best judgement and perform due diligence before using the information in this article. Your success is still up to you. Nothing in this article is intended to be professional, legal, financial and/or accounting advice. Always seek competent advice from professionals in these matters. If you break the city or other local laws, we will not be held liable for any damages you incur.
")