
Bitcoin’s strength has rubbed off to select altcoins, which may rally in the short term. Now the question arise which altcoin will be the next Bitcoin? The total crypto market capitalisation is back above $2 trillion buoyed by a string of bullish news. The crypto markets received a boost on March 24 on reports that Russian Federation’s energy chief Pavel Zavalny during a press conference said that friendly countries such as China and Turkey could pay for their oil and gas purchase in Russian Rubles, Chinese Yuan, Turkish Lira or even Bitcoin.
According to Reuters, Russia received $119 billion in revenue for its oil and gas trade in 2021. The addition of Bitcoin as one of the payment options for select nations widens the digital currency’s use case.
Bitcoin’s resilience during the current period of geopolitical turmoil and high inflationary environment is attracting greater institutional interest. In his letter to shareholders, BlackRock Chairman Larry Fink said: “BlackRock is studying digital currencies, stablecoins and the underlying technologies to understand how they can help us serve our clients.”
Although Bitcoin has held its ground, it remains highly correlated to the S&P 500. A report by Arcane Research seen by Decrypt states that “Bitcoin’s correlation to the S&P 500 has only been higher for five days in BTC’s history, showing that the current correlation regime is unprecedented in BTC’s history.”
This suggests that Bitcoin is not acting as an inflation hedge but has been moving higher due to the sharp recovery in the US equity markets. However, a strengthening Bitcoin has improved the sentiment in the crypto sector with several altcoins turning bullish.
Let’s study the charts of the five cryptocurrencies that are showing a positive chart structure.
FTT/USD Market Analysis

FTX Token is attempting to form a bullish reversal pattern near the bottom. The price action of the past few days has formed an ascending triangle, which completed on a break and close above $48.50 on March 24.
Along with it, the FTT/USD pair has also cleared the 200-day simple moving average (SMA), signalling a possible change in trend. The RSI is near the overbought zone, which suggests that the momentum favors the buyers.
If the price rises and sustains above the psychological level at $50, the pair could start a new uptrend. There is a minor resistance at $53.50 and then at $57.50 but if these levels are scaled, the pair could rally toward its pattern target of $65.50.
Contrary to this assumption, if the price turns down and slides back into the triangle, it will suggest that the current breakout from the triangle may have been a bull trap. The bears will then attempt to pull the price below the 50-day SMA.
ETC/USD Market Analysis
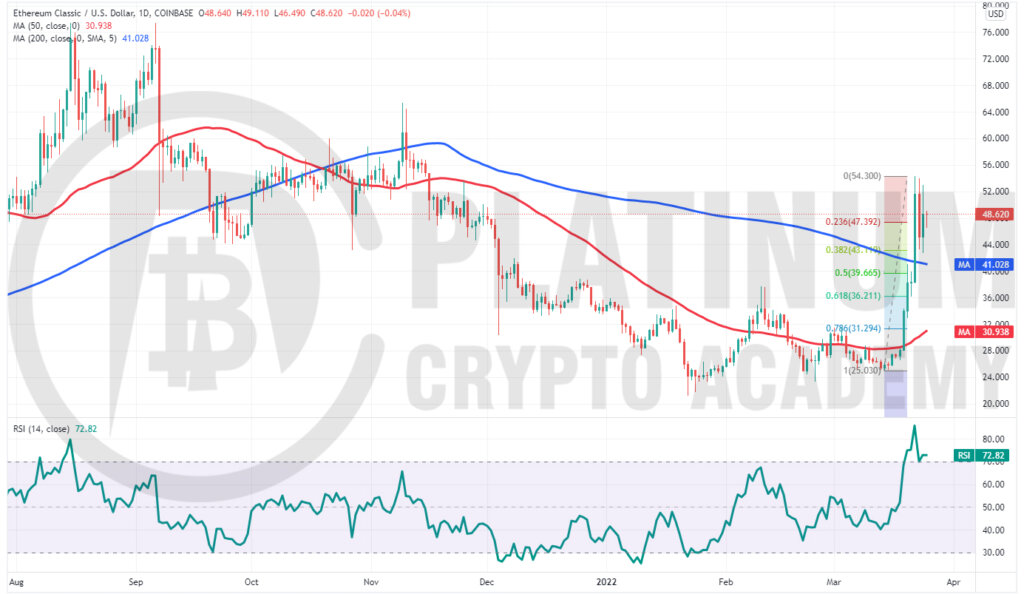
Ethereum Classic has run up strongly in the past few days. The ETC/USD pair picked up momentum after it broke above the 50-day SMA on March 19. The buying continued and the bulls cleared the overhead hurdle at the 200-day SMA on March 22.
The bears are offering a strong resistance at $54.30 but a positive sign is that the buyers have not allowed the price to break back below the 200-day SMA. This indicates that bulls are buying on minor dips.
The rising 50-day SMA and the RSI in the overbought zone indicate that bulls remain in the driver’s seat. The buyers will now attempt to drive and sustain the price above $54.30.
If they manage to do that, the upward move could continue. The pair could then rally to $65 and later make a move to $71.92.
However, if the price turns down from $54.30, the bears will try to pull the pair below the 200-day SMA. If they succeed, it will suggest that the bullish momentum has weakened. The pair could then decline to the 61.8% Fibonacci retracement level at $36.21.
AXS/USD Market Analysis
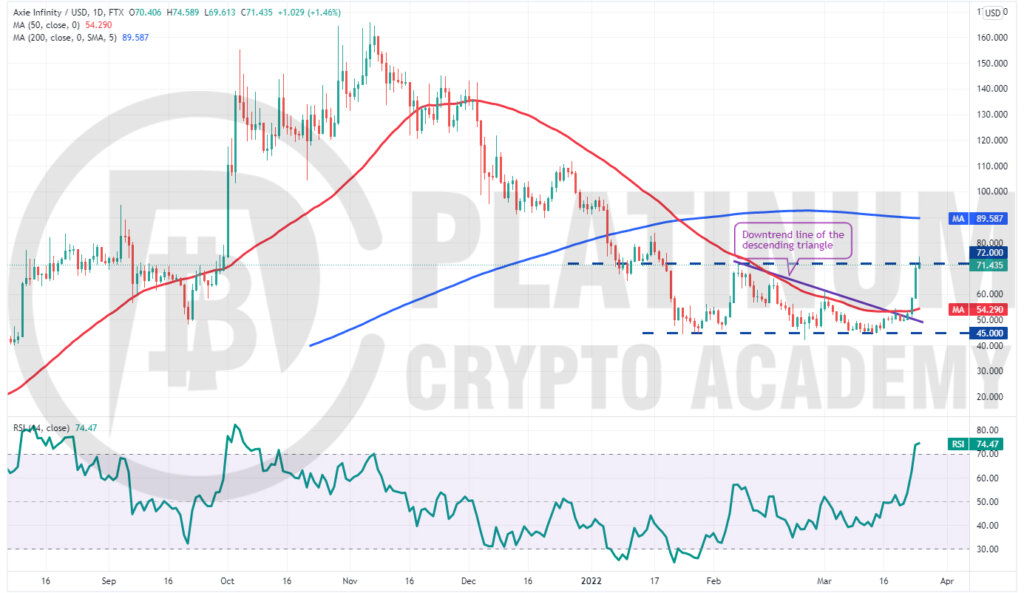
Axie Infinity had formed a bearish descending triangle pattern but the bears could not pull and close the price below the critical support at $45.
The AXS/USD pair picked up momentum after the bulls pushed the price above the downtrend line of the triangle. This move invalidated the negative set up and may have trapped the aggressive bears.
The resulting short squeeze has pushed the price to the strong overhead resistance at $72. The bears are expected to defend this level aggressively.
If the price turns down from $72 but bulls do not give up much ground, it will suggest that traders expect the upward move to continue. That will improve the prospects of a break and close above $72.
If that happens, the pair could rally to the 200-day SMA which could again act as a strong resistance. If bulls overcome this barrier, the pair may rally to the psychological level at $100.
Conversely, if the price turns down sharply from the current level and breaks below $60, the pair may extend its stay inside the $72 to $45 range for a few more days.
ZEC/USD Market Analysis
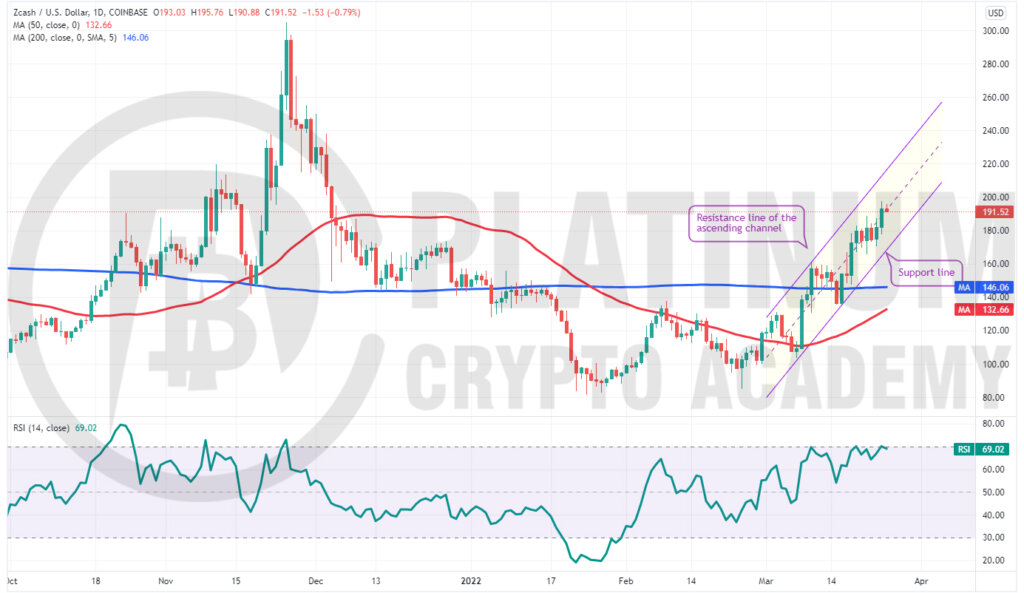
Zcash has been rising inside an ascending channel for the past few days. The 50-day SMA has turned up and the RSI is near the overbought zone, indicating that the path of least resistance is to the upside.
However, the bears are unlikely to give up easily. They will try to stall the rally at the psychological level at $200. If that happens, the ZEC/USD pair could correct to the support line of the channel, which is likely to attract buyers.
A sharp bounce off the support line will indicate that sentiment remains positive and traders are accumulating on dips. The buyers will then try to push the price above the overhead resistance and resume the uptrend.
The pair could then rally to the resistance line of the channel. A break and close above the channel could result in a pick-up in momentum.
Conversely, if the price breaks and sustains below the support line, it will suggest that the bulls are losing their grip. That could pull the price down to the 200-day SMA.
RUNE/USD Market Analysis
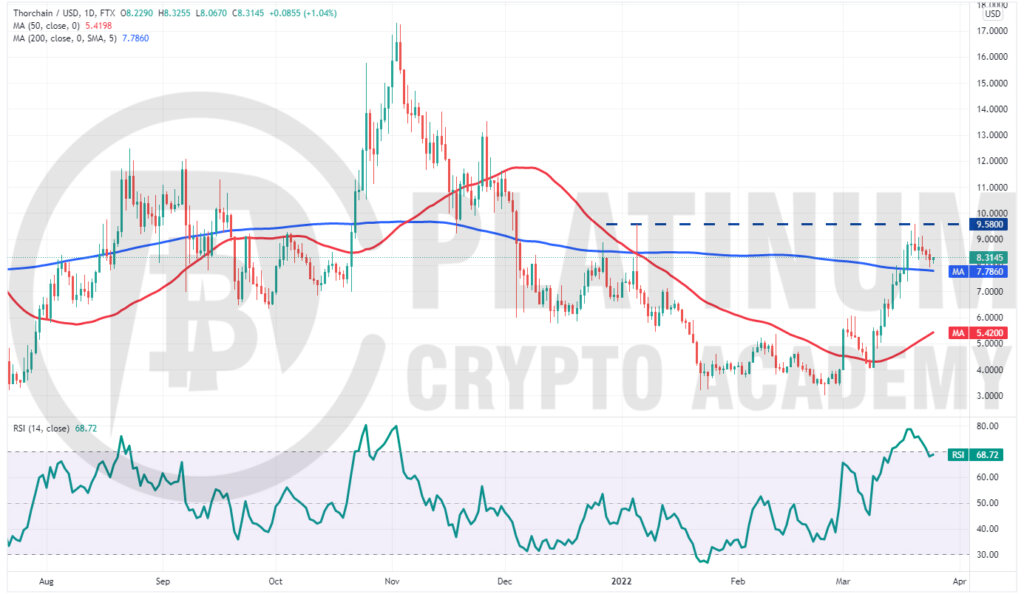
Thorchain has been in a sharp upward move since bouncing off the 50-day SMA on March 9. The buyers pushed the price above the 200-day SMA on March 17, signalling a possible change in trend.
The bears are defending the overhead resistance at $9.58 but the bulls have not allowed the price to dip below the 200-day SMA. This indicates that bulls are attempting to flip this level into support.
If they do that, the buyers will try to push the price above the overhead resistance. If they succeed, the RUNE/USD pair could rally to $14.
Conversely, if bears pull and sustain the price below the 200-day SMA, it will suggest that the bullish momentum may be weakening. The pair could then slide to $7 and later to $6.
Hopefully, you have enjoyed today’s article for further coverage please check out our crypto Blog Page. Thanks for reading! Have a fantastic day! Live from the Platinum Crypto Trading Floor.
Earnings Disclaimer: The information you’ll find in this article is for educational purpose only. We make no promise or guarantee of income or earnings. You have to do some work, use your best judgement and perform due diligence before using the information in this article. Your success is still up to you. Nothing in this article is intended to be professional, legal, financial and/or accounting advice. Always seek competent advice from professionals in these matters. If you break the city or other local laws, we will not be held liable for any damages you incur.
")