
After days of indecisive price action, Bitcoin broke above the psychologically important level of $30,000 on April 11. Even though Bitcoin has rallied above 80% year-to-date, some analysts remain in denial mode.
Bloomberg Intelligence senior macro strategist Mike McGlone highlighted that “risk assets typically rise and fall on the back of liquidity.” The central banks have been withdrawing liquidity to control surging inflation, which has resulted in a fall in money supply and commercial bank deposits. Therefore Bloomberg Intelligence believes it is “illogical” to expect the stock market, crude oil and cryptocurrencies to sustain recent bounces.
Usually, rallies from bear market lows continue until the last bearish trader throws in the towel and turns bullish. Until that happens, the rally in Bitcoin may continue to frustrate traders who expect the price to turn down once again.
SkyBridge Capital founder Anthony Scaramucci said in an interview with Yahoo Finance that Bitcoin may be through its bear market but added that it was a guess. He however highlighted that investors who buy and hold Bitcoin for a period of four years outperform every other asset class.
While several retail investors are waiting for a dip to buy, American business intelligence firm MicroStrategy continued its Bitcoin buying. The firm’s executive chairman Michael Saylor tweeted on April 5 that the company purchased an additional 1,045 Bitcoin to take its total treasury holding to 140,000 Bitcoin, acquired at an average price of $29,803 per Bitcoin.
Although Bitcoin is the engine that drives other cryptocurrencies, this week, the focus will also be on the largest altcoin Ether, which will undergo the Shanghai upgrade on April 12. That will conclude its transition to proof-of-stake. Analysts are uncertain about the short-term impact on Ether’s price but most expect it to be bullish in the long term.
What are the likely resistance and support levels to keep an eye on over the next few days? Let’s study the charts of Bitcoin and the major cryptocurrencies to find out.
BTC/USD Market Analysis
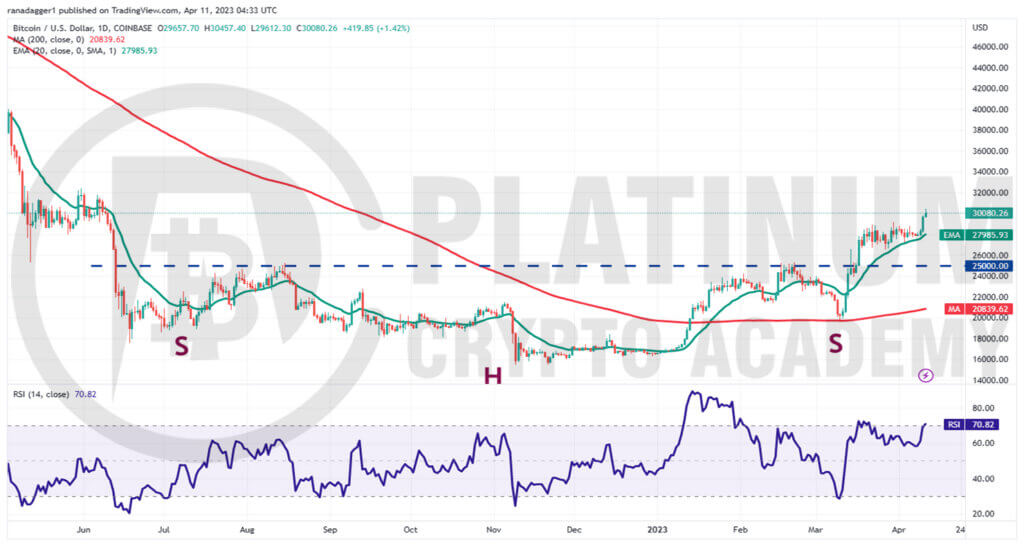
We said in our previous analysis that the tight-range trading may not continue for long and the indicators showed that bulls were in command. We also mentioned that if $29,190 is broken out, Bitcoin may scale above $30,000 and that is exactly how it has been.
The BTC/USD pair rebounded off the 20-day exponential moving average (EMA) on April 9 and surged above $30,000 on April 11. This sharp up-move pushed the relative strength index (RSI) into the overbought zone.
Buyers will try to sustain the momentum and push the price to the overhead resistance at $32,000. This level is likely to witness aggressive selling by the bears because if $32,000 gets taken out, the rally may reach $40,000.
On the downside, the 20-day EMA remains the key support to watch for. In an uptrend, traders generally buy the dip to this level. The bears will have to sink the price below the 20-day EMA to indicate that the bulls may be losing their grip.
The pair may then retest the neckline of the inverse head and shoulders (H&S) pattern. This remains the make-or-break level for the bulls because if this level crumbles, the advantage will tilt in favor of the bears.
ETH/USD Market Analysis
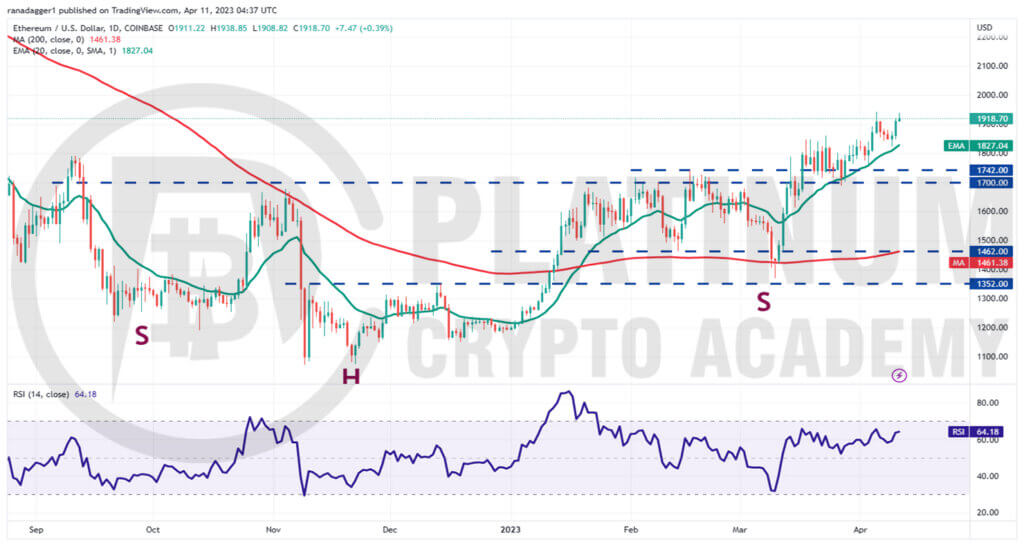
We highlighted in the previous analysis that the $2,000 level will act as a strong barrier and that is what happened. Ether turned down from $1,943 on April 5. However, on the downside, the bulls again successfully defended the 20-day EMA, indicating solid demand at lower levels.
The rising 20-day EMA and the RSI above 64 suggest that the bulls remain in control. If buyers thrust the price above $1,943, the likelihood of a break above $2,000 increases.
That could open the doors for an extension of the rally to $2,200. The bears will again try to stall the up-move at this level but if they fail in their endeavor, the ETH/USD pair may soar toward $3,000.
If bears want to stall the up-move, they will have to yank the price below the 20-day EMA. That is likely to trigger stops of several short-term traders, resulting in a decline to the strong support at $1,700.
BNB/USD Market Analysis
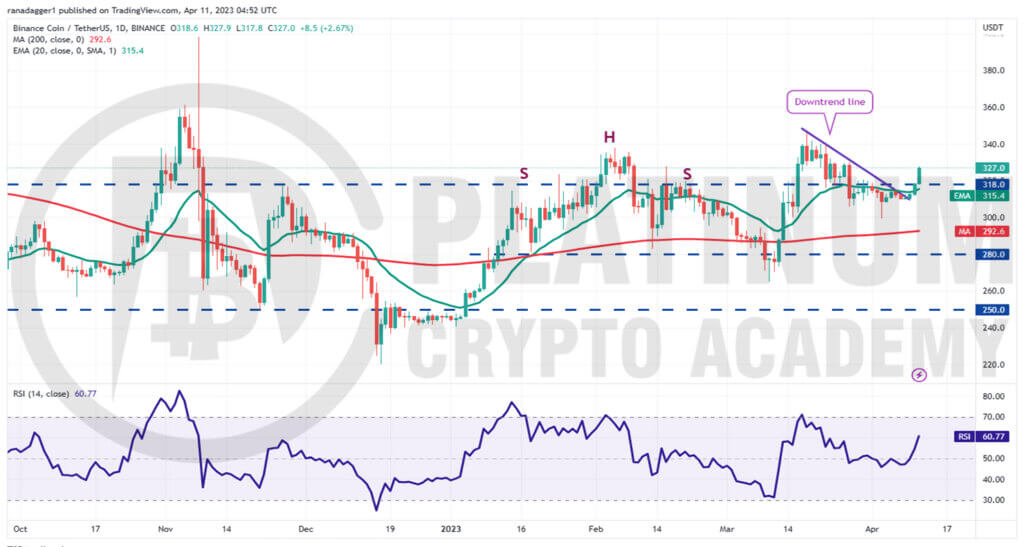
The bears kept BNB pinned below the downtrend line till April 8 but they could not build upon the advantage and sink the price below $300. This indicates a lack of selling pressure at lower levels.
That may have encouraged buying from the bulls. The BNB/USD pair picked up momentum after rising above the overhead resistance at $318. If bulls sustain the breakout, the pair may soar to $346. Sellers will again try to protect this level with vigor.
The important support to watch on the downside is $318. If this level cracks, it will suggest that the bears continue to sell on minor rallies. That could pull the price to the strong support at $300.
The bears will have to sink and sustain the price below the 200-day simple moving average (SMA) to seize control.
XRP/USD Market Analysis
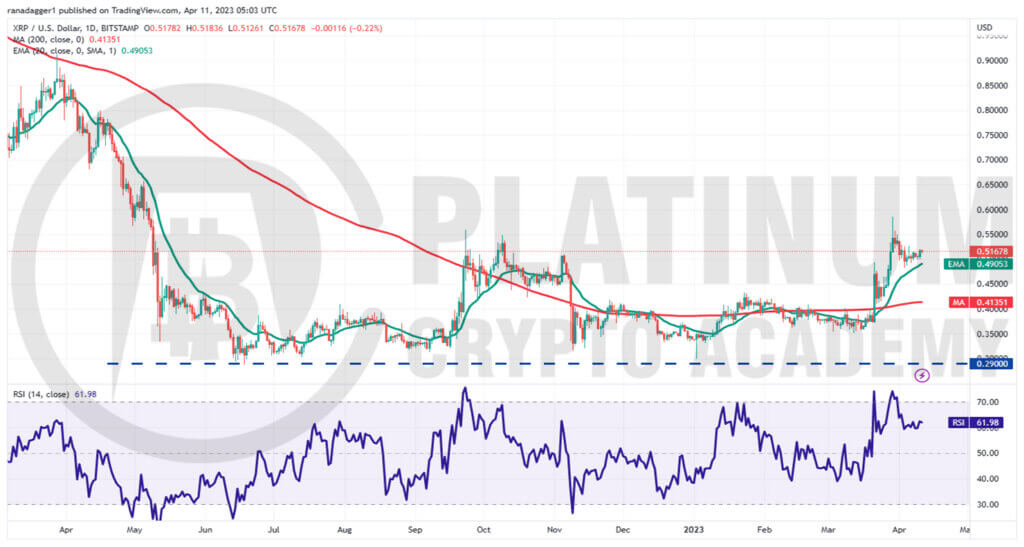
The bulls have sustained XRP above the 20-day EMA during the most recent corrective phase, indicating that the sentiment remains positive and traders are viewing the dips as a buying opportunity.
The rising 20-day EMA and the RSI in the positive territory indicate that the path of least resistance is to the upside.
Buyers will try to push the price to the overhead resistance zone of $0.56 to $0.58. This is a key zone for the bears to defend because if bulls kick the price above it, the pair may accelerate toward the next target objective at $0.80.
This bullish view will invalidate in the near term if the price turns down and plummets below the 20-day EMA. Such a move will suggest that the traders may be booking profits. That could open the doors for a possible retest of the 200-day SMA.
ADA/USD Market Analysis
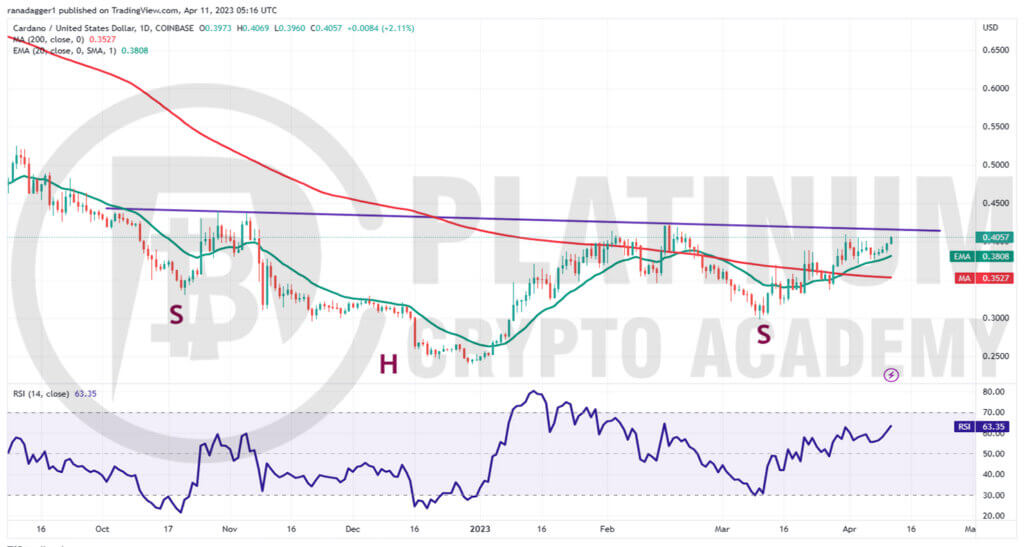
Cardano bounced off the 20-day EMA on April 7, indicating that lower levels continue to attract buyers. The price has resumed its northward march and is nearing the neckline of the inverse H&S pattern.
The upsloping 20-day EMA and the RSI in the positive territory indicate that the bulls are in command. That enhances the prospects of a rally above the neckline. If that happens, it will complete the reversal setup.
The ADA/USD pair may then start a new uptrend. The pair could first rally to $0.52 and thereafter dash to the pattern target of $0.60.
Contrarily, if the price turns down from the neckline, it will signal that bears are active at higher levels. The pair could then again retest the strong support at the 20-day EMA. If this level gives way, it will suggest that bears are back in the driver’s seat. The pair may then plunge to the 200-day SMA.
Hopefully, you have enjoyed today’s article for further coverage please check out our crypto Blog Page. Thanks for reading! Have a fantastic day! Live from the Platinum Crypto Trading Floor.
Earnings Disclaimer: The information you’ll find in this article is for educational purpose only. We make no promise or guarantee of income or earnings. You have to do some work, use your best judgement and perform due diligence before using the information in this article. Your success is still up to you. Nothing in this article is intended to be professional, legal, financial and/or accounting advice. Always seek competent advice from professionals in these matters. If you break the city or other local laws, we will not be held liable for any damages you incur.
