
Bitcoin rallied about 72% in the first quarter of the year, making it the best-performing asset class. The Nasdaq 100 with a gain of 20.5% was far behind. In commodities, gold was up roughly 9% and sugar turned out to be the best performer with a 23% rally.
Bitcoin’s rise in the first quarter becomes even more impressive because it came during the time when the globe witnessed a banking crisis. This suggests that the failures in the legacy banking system boosted interest in cryptocurrencies.
After a strong first quarter of the year, what can investors expect in April? Will Bitcoin continue its northward march or will bears come back with a bang?
Coinglass data shows that Bitcoin bulls have been on top of their game in April. Bitcoin has witnessed a double-digit drop in April only during the 2022 crypto winter. Barring that, in 2021, 2015, and 2014, the years when Bitcoin closed April in the red, the drop has been less than 4%. Bitcoin’s best performance in April was the 50.01% rally in 2013 and the weakest rise was the 7.27% gain in 2016. History suggests that Bitcoin’s rally may continue in April.
The risk to the continuation of the crypto rally is the increased regulatory action on cryptocurrency firms. Bitcoin and Binance Coin turned down on April 3 on rumors that a Red Notice was issued by The International Criminal Police Organization to locate and arrest Binance’s chief executive officer Changpeng “CZ” Zhao. However, Binance denied the rumors and said it was not true, reported The Block.
Another risk to the crypto rally is the Federal Reserve’s tightening policy to curb inflation. The OPEC+ announced on April 2 that it plans to cut oil production by more than 1.15 million barrels per day. That is likely to reduce supply and increase prices. If that happens, inflation may remain elevated, keeping the Fed in hawkish mode.
Let’s study the charts of the major cryptocurrencies to spot the important support and resistance levels.
BTC/USD Market Analysis
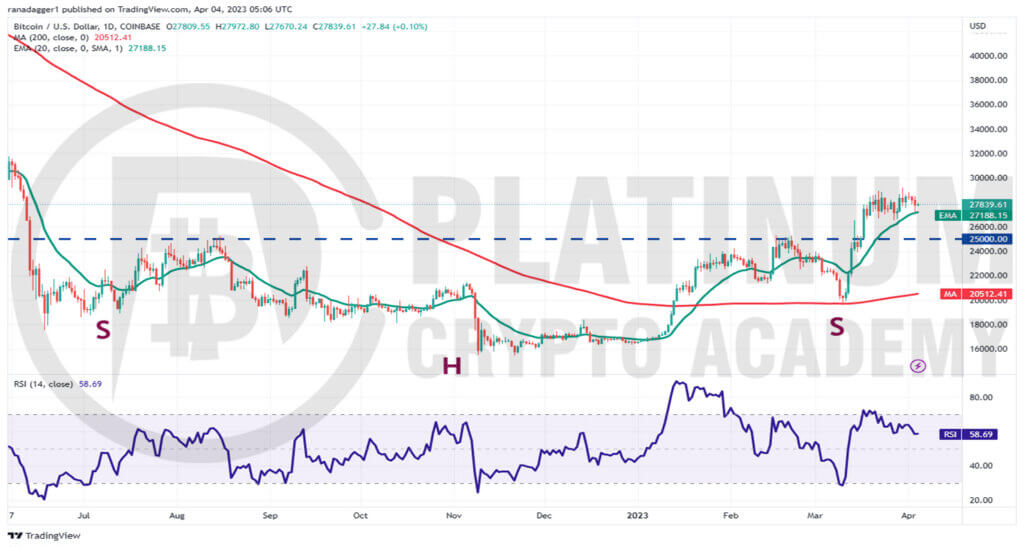
Bitcoin is trading in a tight range between $29,190 and the 20-day exponential moving average (EMA) for the past few days. This suggests that the bulls are buying on dips while the bears are selling on rallies.
This tight-range trading is unlikely to continue for long. The rising 20-day EMA and the relative strength index (RSI) in the positive zone suggest that bulls are in command.
If buyers thrust the price above $29,200, the BTC/USD pair will pick up momentum and rise to $30,000. This level may act as a strong resistance but it is likely to be crossed. The pair may then soar to $32,000.
Contrarily, if the price turns down and plummets below the 20-day EMA, it will tilt the short-term advantage in favor of the bears. The pair could then plummet to the breakout level of $25,000.
Buyers are expected to defend the $25,000 level with vigor because if this level breaks, the selling may intensify and the pair could plunge toward the 200-day simple moving average (SMA).
ETH/USD Market Analysis
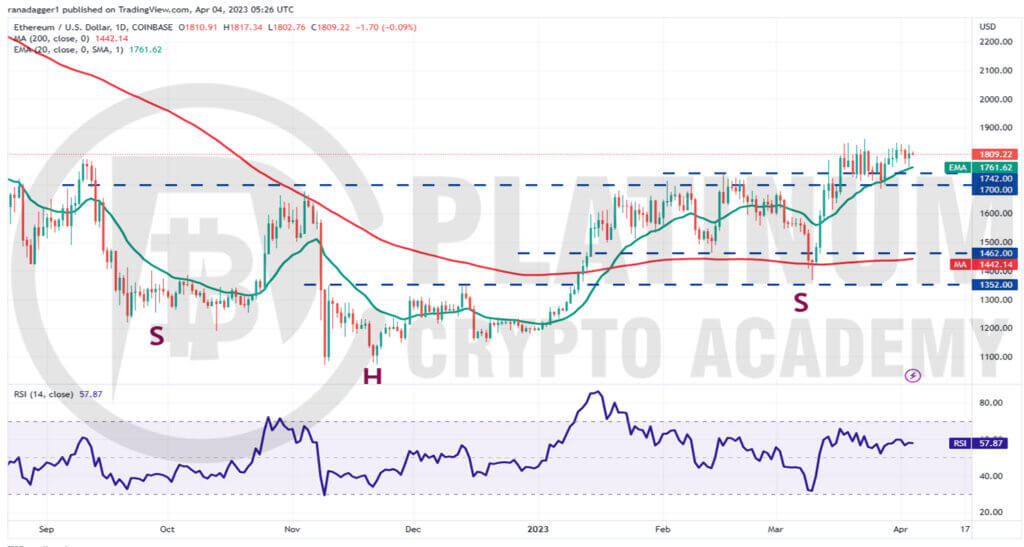
Ether bounced off the 20-day EMA on March 28 and again on April 3. This suggests strong demand at lower levels.
The rising 20-day EMA and the RSI in the positive territory indicate the path of least resistance is to the upside. If bulls propel the price above $1,862, the ETH/USD pair could soar toward the psychologically important level of $2,000.
This level may act as a strong barrier but on the way down, if the index finds support at $1,850, the likelihood of a rally to $2,200 increases.
This positive view will invalidate in the near term if the price turns down and breaks below the crucial support at $1,700. The pair could then plummet to $1,600 and thereafter descend to $1,462.
BNB/USD Market Analysis
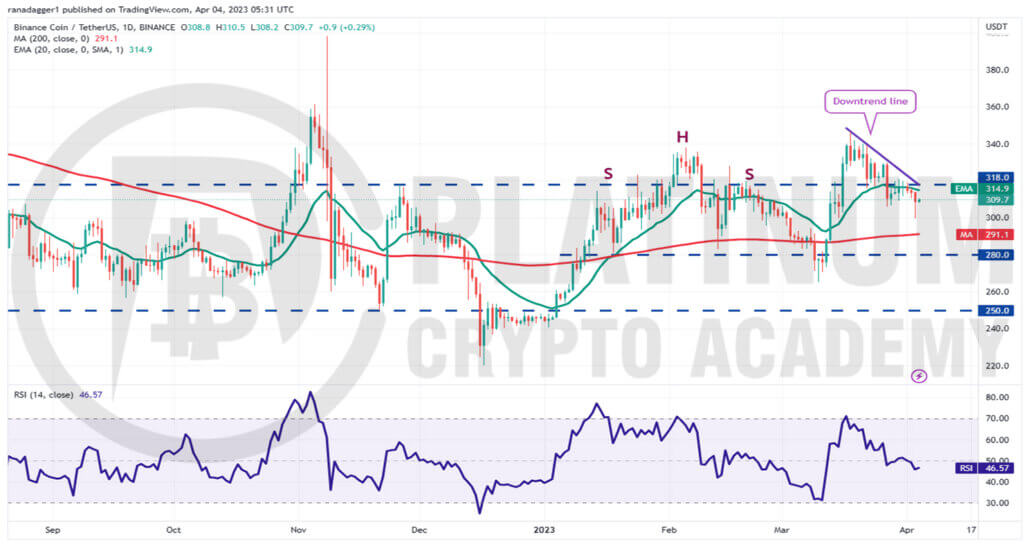
The bulls tried to propel Binance Coin above the downtrend line but the bears held their ground. This suggests that the sellers are active at higher levels.
The failure to clear the overhead hurdle may have attracted selling by the bears. The BNB/USD pair turned down on April 3 and plunged below the immediate support of $306. That opened the doors for a possible drop to the 200-day SMA.
A minor respite for the bulls is that the $300 level is attracting buyers as seen from the long tail on the April 3 candlestick. Buyers will have to thrust the price above the downtrend line to suggest that the selling pressure may be reducing.
If the price sustains above the downtrend line, the pair may attempt a rally to $346. A break and close above this level could catapult the price to $400.
XRP/USD Market Analysis
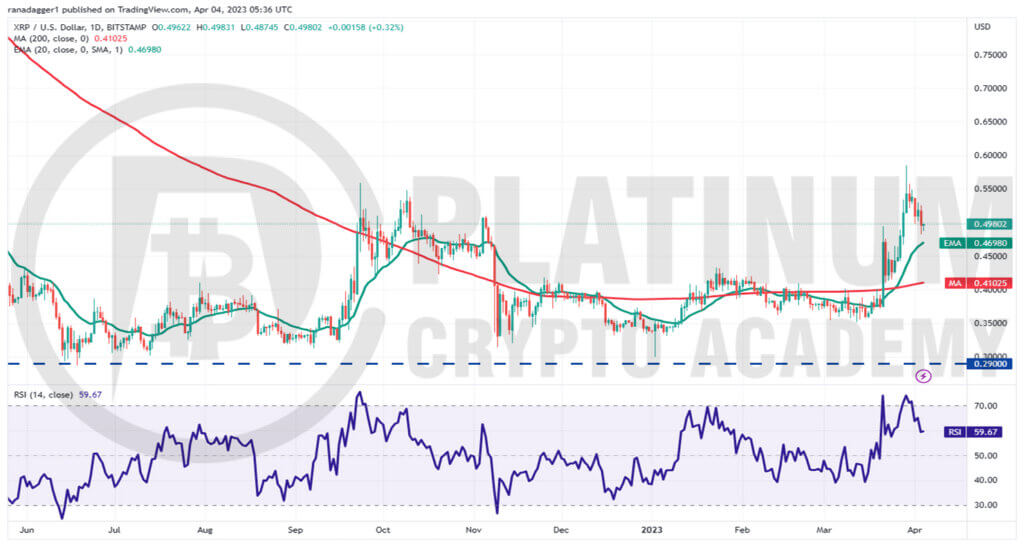
We suggested in our previous analysis that the bulls were in command. We said that a break above $0.51 could propel the price to $0.56 and the target was achieved on March 29 when XRP touched $0.58.
However, the bulls could not sustain the price above $0.56. That may have tempted short-term traders to book profits, which pulled the price down toward the 20-day EMA.
In an uptrend, the bulls try to defend the 20-day EMA. If the price rebounds off this level, it will suggest that the sentiment remains positive and traders are buying on dips. The XRP/USD pair could then rally to $0.58.
Conversely, if the price turns down and breaks below the 20-day EMA, it will suggest that the bears are trying to seize control. The pair may then nosedive to the 200-day SMA.
ADA/USD Market Analysis
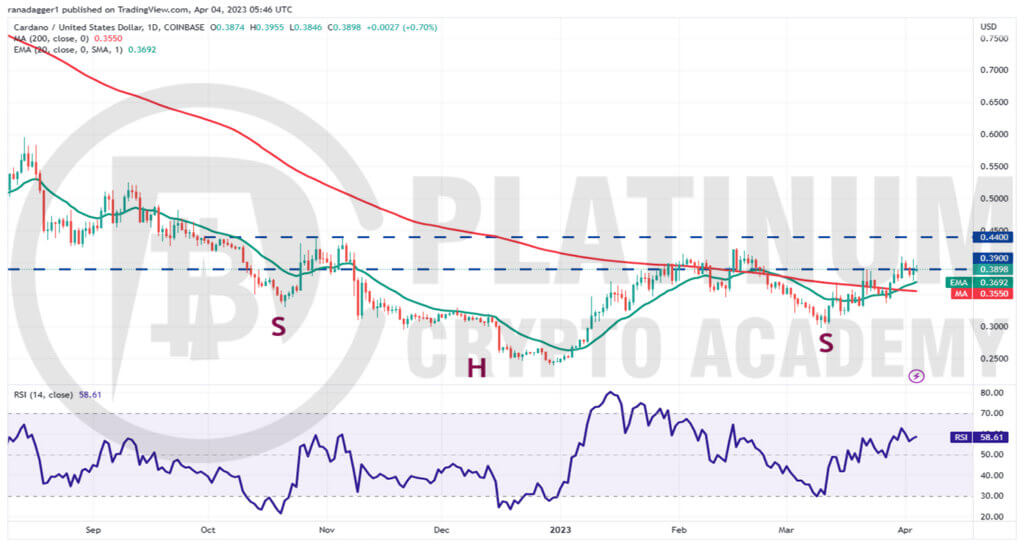
Buyers successfully defended the 20-day EMA on March 27 and 28, indicating solid buying on dips. The bulls pushed Cardano above the 200-day SMA on March 28, which is the first sign that the bears may be losing their grip.
The ADA/USD pair rose above the overhead resistance of $0.39 on March 31 but the bulls could not sustain the positive momentum. However, a positive sign for the bulls is that the bulls continue to defend the 20-day EMA as seen from the rebound on April 3.
The repeated retest of a resistance level tends to weaken it. This suggests that the pair may attempt a rally to the overhead zone between $0.42 to $0.44.
The bears are likely to defend this zone with all their might because a break above it will complete a bullish inverse head and shoulders pattern. This reversal setup has a target objective of $0.64.
This positive view will be negated if the price turns down and tumbles below the 200-day SMA. The pair may then fall to $0.30.
Hopefully, you have enjoyed today’s article for further coverage please check out our crypto Blog Page. Thanks for reading! Have a fantastic day! Live from the Platinum Crypto Trading Floor.
Earnings Disclaimer: The information you’ll find in this article is for educational purpose only. We make no promise or guarantee of income or earnings. You have to do some work, use your best judgement and perform due diligence before using the information in this article. Your success is still up to you. Nothing in this article is intended to be professional, legal, financial and/or accounting advice. Always seek competent advice from professionals in these matters. If you break the city or other local laws, we will not be held liable for any damages you incur.
")