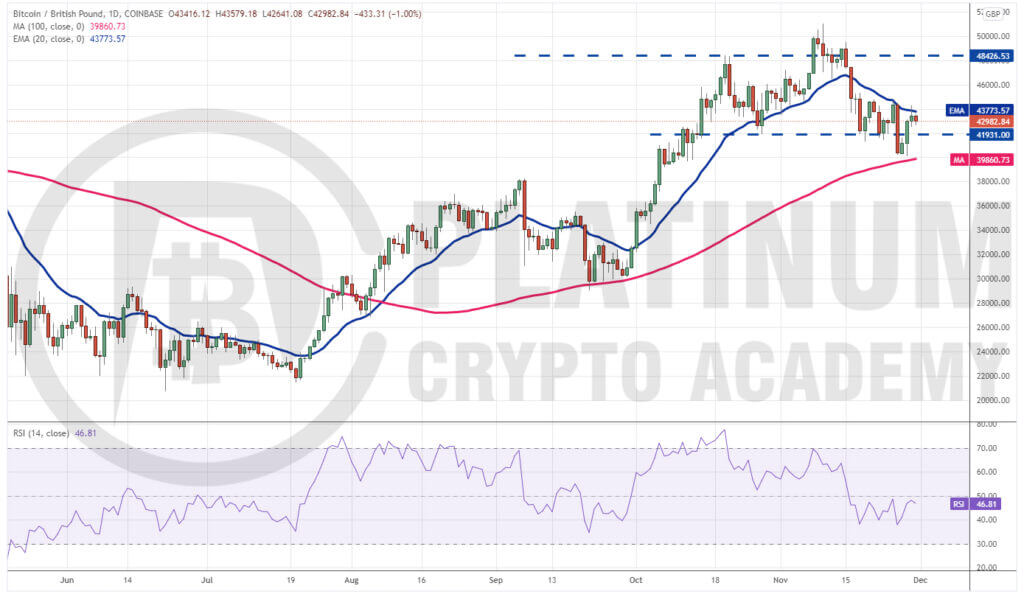
We had mentioned in our previous analysis that Bitcoin’s failure to rebound off the 200-day simple moving average (SMA) was a bearish sign and could lead to further downside and that is what happened.
BITCOIN TO GBP
Enter Amount
Base Currency
Convert To
1 bitcoin
=
GBP
JANUARY BLOG
BTC TO GBP – HOW TO TRADE BTC/GBP 11TH JANUARY 2022 – UPDATED CONTENT
The BTC/GBP pair plunged below the strong support at £34,031.76 on January 4. This intensified the selling and pulled the pair to the strong support at £29,000. The long tail on the day’s candlestick shows that bulls are attempting to defend the level aggressively.
If buyers push the pair above £32,353.68, the pair could pick up momentum and rally to the breakdown level at £34,031.76 which is likely to act as a strong resistance.
The moving averages are on the verge of forming a death cross and the relative strength index (RSI) is near the oversold zone, indicating that bears are in command.
If the price turns down from the overhead resistance, the pair could consolidate between £29,000 and £34,031.76 for a few more days. The next leg of the downtrend could begin on a break and close below £29,000.
If that happens, the pair could plummet to £26,845 and then to £21,462.10. This negative view will invalidate if the price breaks and sustains above the moving averages.
BTC TO GBP – HOW TO TRADE BTC/GBP 4TH JANUARY 2022
Bitcoin turned down from the overhead resistance at £39,299 and plunged below the 200-day simple moving average on December 29.
The bulls have managed to defend the £34,031.76 support for the past few days but their failure to sustain the rebound above the 200-day SMA indicates selling by the bears at higher levels.
The downsloping 50-day SMA and the relative strength index (RSI) in the negative territory suggest that the path of least resistance is to the downside.
If bears pull the price below £34,031.76, the BTC/GBP pair could resume its down-move. The first support on the downside is £30,000 but if this level gives way, the decline could extend to £26,845.
The first sign of strength will be a break and close above £36,000. Such a move will suggest that bulls accumulated on dips to £34,031.76. The pair could then rise to £39,299 where the bears may again mount a strong resistance. A break and close above this level will indicate that the downtrend could be over.
DECEMBER BLOG
BTC TO GBP – HOW TO TRADE BTC/GBP 28TH DECEMBER 2021
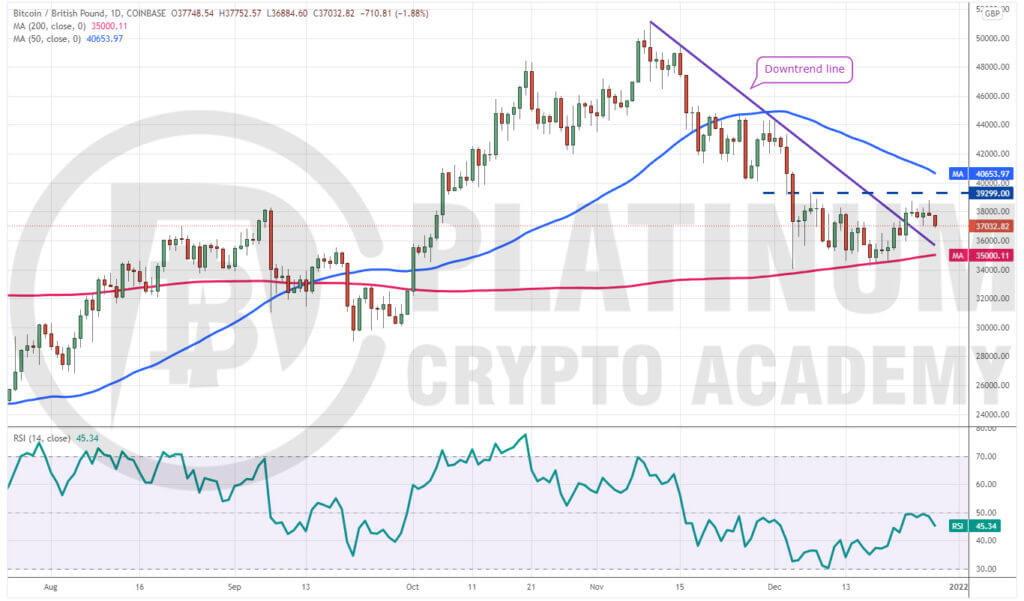
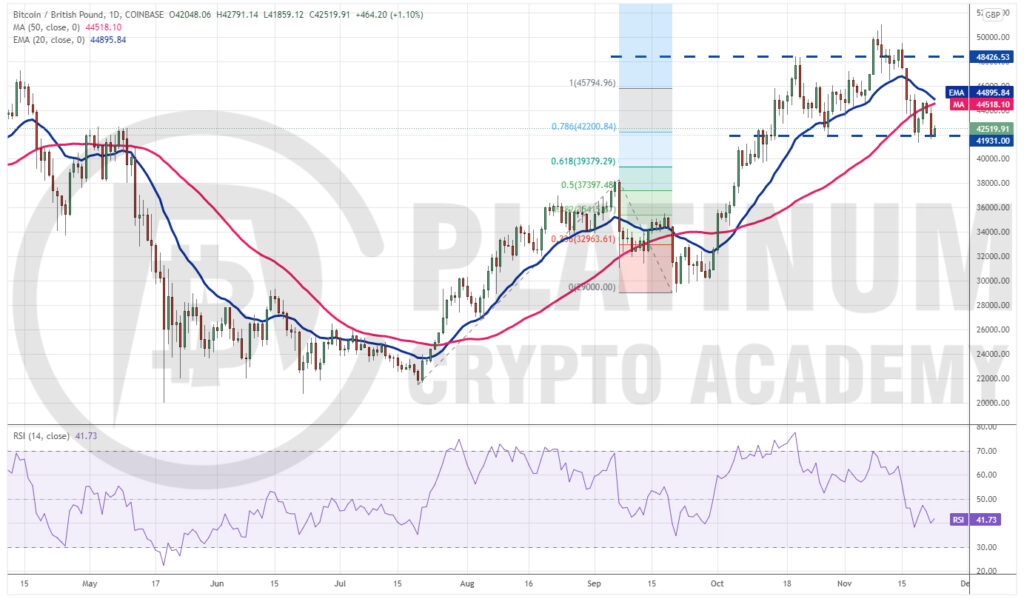
Bitcoin broke and closed above the downtrend line on December 23 but the bulls could not sustain the momentum and push the price above the overhead resistance at £39,299.
This suggests that bears have not yet given up and are selling on rallies. The BTC/GBP pair has turned down from the overhead resistance and could now drop to the 200-day simple moving average.
The downsloping 50-day SMA and the relative strength index (RSI) in the negative zone indicate that bears are in control. If bears pull the price below £34,000, the selling could intensify and the pair could extend its downtrend.
Alternatively, if the price rebounds off the 200-day SMA or the support at £34,000, it will suggest that bulls are aggressively buying at lower levels. The pair could then remain range-bound between £39,299 and £34,000 for the next few days.
A break and close above £39,299 and the 50-day SMA will indicate that the downtrend could be over. The pair could then rally to £45,000 and later retest the all-time high at £51,000.
We will wait for the price to break and sustain above £39,299 before recommending a trade in it.
BTC TO GBP – HOW TO TRADE BTC/GBP 21ST DECEMBER 2021
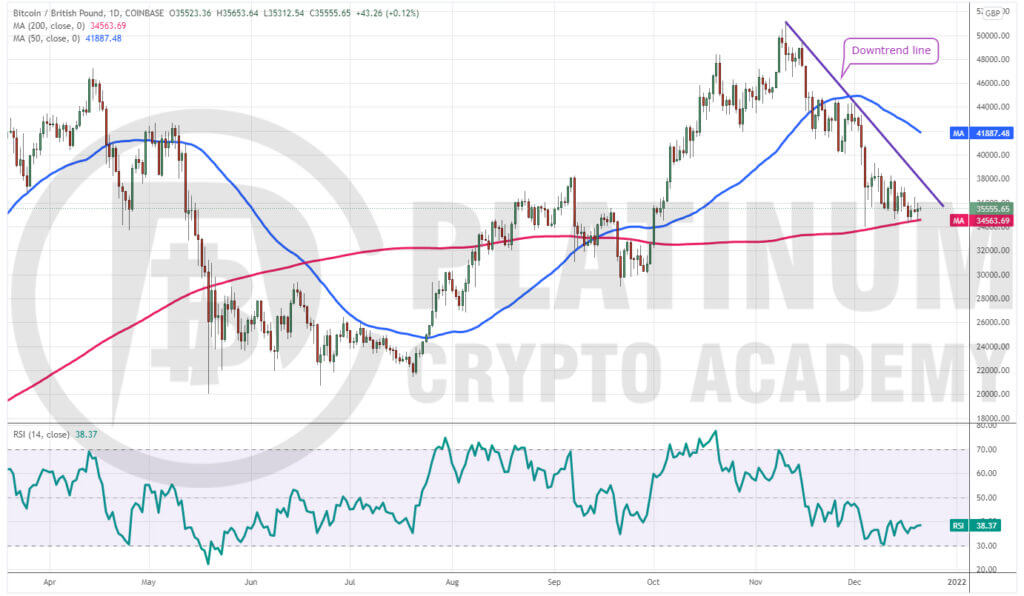
Bitcoin has been finding support at the 200-day simple moving average (SMA) for the past few days but is struggling to sustain the rebound. This suggests a lack of demand at higher levels.
The 50-day SMA has turned down and the relative strength index (RSI) has been trading in the negative territory, indicating that bears are in control.
A break and close below the 200-day SMA will be a huge negative as that will dent sentiment further and drive away the bulls. The BTC/GBP pair could then drop to £29,000 and later to £26,845.
The longer the price sustains below the 200-day SMA, the greater the possibility of an extended downtrend.
Contrary to this assumption, if the price rebounds off the current level and rises above the downtrend line, it will suggest that the selling momentum has weakened. The pair could then rise to the 50-day SMA.
A break and close above this level could open the doors for a possible rally to £45,306.70 and then to the all-time high at £51,000.
We will wait for the price to bounce and sustain above the downtrend line before recommending any long trades.
BTC TO GBP – HOW TO TRADE BTC/GBP 14TH DECEMBER 2021
Bearish sentiment continued last week especially after Tuesday’s big sell off in the markets as Bitcoin once more came under heavy selling pressure.
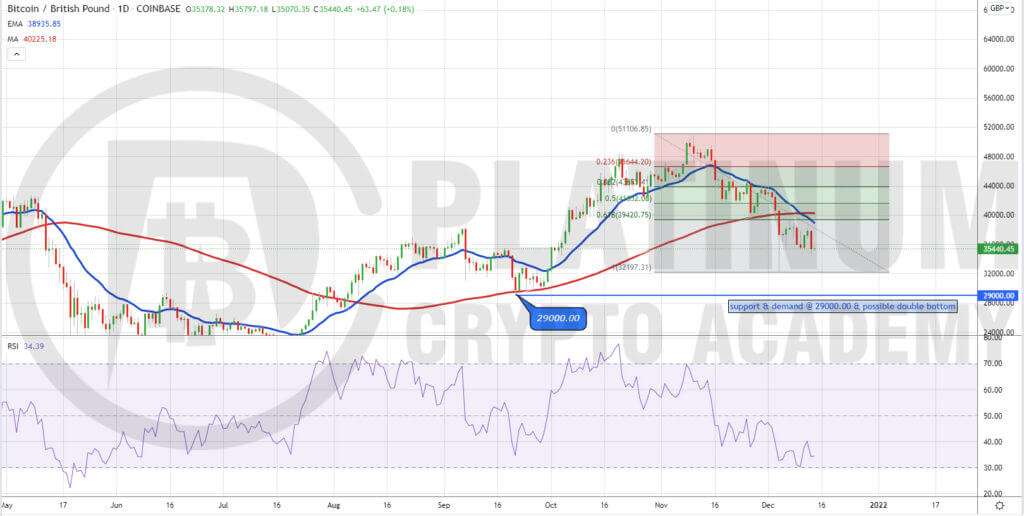
From the dizzying heights of £51,000 made last month on November 10, this pair ended the week at £37,105 below both moving averages as the 20-day EMA finally crossed the 100-day SMA to the downside.
This is aided and abetted by the relative strength index ( RSI ) which is currently sitting at around 34 with the bears firmly in control.
From a technical view this is backed up by the resistance and supply levels on the Fib retracements, with double confluence at the 61.8 level and MA’s.
It will be interesting to see how this chart plays out towards the end of 2021 going into the new year to see if the bulls can move price above both moving averages or maybe a double bottom will be formed from the low of September 21 at £29,000 and support and demand area as indicated on the chart.
Fundamentally we have some big news announcements this week, with none bigger than Wednesday’s final FOMC meeting of the year to be mindful of.
BTC TO GBP – HOW TO TRADE BTC/GBP 7TH DECEMBER 2021
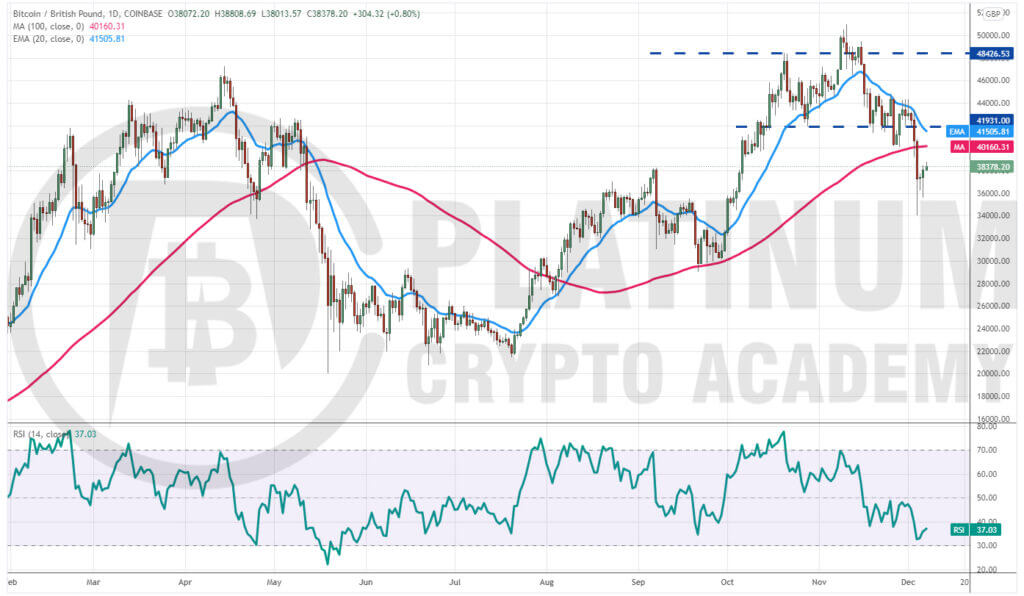
The failure of the bulls to push Bitcoin above the 20-day exponential moving average (EMA) between November 29 to December 1 showed that bears are defending this level aggressively.
This may have prompted selling from traders who had purchased the dip to the 100-day simple moving average (SMA). The selling intensified on a break below the 100-day SMA and the BTC/GBP pair plunged to £34,031.76.
The long tail on the day’s candlestick shows that bulls aggressively purchased the dip. But a minor negative is that buyers are struggling to sustain the bullish momentum at higher levels.
This indicates that demand dries up at higher levels. The 100-day SMA, which had been acting as a strong support till now is likely to turn into a stiff resistance.
If the price turns down from the 100-day SMA, the pair could retest the December 4 intraday low at £34,031.76. A break and close below this level could pull the pair to £30,000. The downsloping 20-day EMA and the relative strength index (RSI) in the negative zone indicate that bears have the upper hand. This bearish view will invalidate on a break and close above the 20-day EMA.
NOVEMBER BLOG
BTC TO GBP – HOW TO TRADE BTC/GBP 30TH NOVEMBER 2021
Bitcoin plunged below the strong support of £41,931 on November 26 but a positive sign is that the bulls aggressively defended the 100-day simple moving average (SMA).
The BTC/GBP pair rebounded off the 100-day SMA on November 28 and reached the overhead resistance at the 20-day exponential moving average (EMA) on November 29.
The bears are currently attempting to stall the relief rally at the 20-day EMA. If the price turns down from the current level and breaks below £41,931, the bears will once again try to challenge the 100-day SMA.
A break and close below this level could intensify selling and the pair may drop to the £38,000 to £35,500 support zone.
Contrary to this assumption, if the price turns up and breaks above the 20-day EMA, it will signal that the bears may be losing their grip. The pair could then rise to £45,306.70.
The bullish momentum could pick up if bulls clear this overhead hurdle. The pair may then challenge the £48,426.53 to £51,000 resistance zone.
BTC TO GBP – HOW TO TRADE BTC/GBP 23RD NOVEMBER 2021
Bitcoin plunged below the 50-day simple moving average (SMA) on November 18 but the bulls successfully defended the critical support of £41,931 on November 19.
However, the subsequent rebound fizzled out just above the 50-day SMA, indicating that bears are selling on rallies. The BTC/GBP pair turned down on November 21 and the price has dipped back to the support at £41,931.
The moving averages are about to complete a bearish crossover and the relative strength index (RSI) is in the negative zone, indicating that the path of least resistance is to the downside.
If the pair breaks and closes below £41,931, the selling could intensify and the decline could extend to £38,000.
Contrary to this assumption, if the price rebounds off the current level, it will suggest strong accumulation on dips. The bulls will have to push and sustain the price above the moving averages to indicate that the selling pressure has reduced. The pair could then rise to the overhead resistance at £48,426.53.
We do not find any reliable setups, hence we are not recommending any trade in it.
BTC TO GBP – HOW TO TRADE BTC/GBP 16TH NOVEMBER 2021
Bitcoin broke above the psychological barrier of £50,000 on November 9 and 10 but the bulls could not sustain the higher levels. This may have prompted profit-booking from short-term traders which pulled the price back below the breakout level of £48,426.53 on November 10.
The bulls defended the 20-day exponential moving average (EMA) on November 12 but higher levels again attracted selling by the bears. The BTC/GBP pair turned down on November 15 and the bears have pulled the price below the 20-day EMA today.
If the pair closes below the 20-day EMA, the possibility of a decline to the 50-day simple moving average (SMA) increases. The negative divergence on the relative strength index (RSI) also points that the bullish momentum may be weakening. The selling could intensify if bears break the critical support at £41,931.
This negative view will be invalidated if the price turns up from the current level and breaks above the all-time high. Such a move will indicate that demand remains strong and traders are accumulating on dips.
We do not see any attractive trade setup, hence we have not been proposing any trades for the past few days.
BTC TO GBP – HOW TO TRADE BTC/GBP 9TH NOVEMBER 2021
Bitcoin bounced off the 20-day exponential moving average (EMA) on November 6 and soared above the overhead resistance at £48,426.53 on November 8, defying our assumption of a consolidation. The BTC/GBP pair could now pick up momentum and charge toward the 161.8% Fibonacci extension level of £56,174.25 and if this resistance is crossed, the next stop could be £60,249.98.
Both moving averages are sloping up and the relative strength index (RSI) is in the overbought territory, indicating advantage to buyers
The important level to watch on the downside is £48,426.53. If bulls flip this level into support during the next correction, the possibility of the resumption of the uptrend will be high.
On the other hand, a break and close below £48,426.53 will be the first indication that traders are booking profits at higher levels. The pair may then drop to the 20-day EMA. The bears will have to pull the price below this support to signal that the bullish momentum has weakened.
BTC TO GBP – HOW TO TRADE BTC/GBP 2ND NOVEMBER 2021
Bitcoin broke below the 20-day exponential moving average (EMA) on October 27 but the bulls did not allow the bears to have their way. Strong buying at lower levels pushed the price back above the 20-day EMA on October 28.
However, higher levels continue to attract profit-booking. The BTC/GBP pair has been stuck between £46,000 and the 20-day EMA for the past four days. This tight-range trading is likely to result in a strong trending move.
If the price breaks below the 20-day EMA, the bears will make one more attempt to pull the pair below £41,500. If they succeed, the pair could plummet to the 50-day simple moving average (SMA). Such a move could delay the start of the next leg of the uptrend.
Conversely, if bulls push and sustain the price above £46,000, the pair may challenge the all-time high at £48,426.53. A break and close above this level could suggest the resumption of the uptrend.
The 20-day EMA is gradually flattening out and the relative strength index (RSI) has dropped below 57, indicating that the bullish momentum may be weakening.
We expect the consolidation to continue for a few more days hence, we are not recommending any trade in it.
OCTOBER BLOG
BTC TO GBP – HOW TO TRADE BTC/GBP 26TH OCTOBER 2021
This indicates that traders continue to buy on dips, anticipating a move higher. The rising moving averages and the relative strength index (RSI) above 63 signals advantage to buyers.
A breakout and close above the £47,240.05 to £48,426.53 overhead resistance zone could indicate the start of the next leg of the uptrend. The next target objective on the upside is the 1.618% Fibonacci extension level at £56,174.25.
Contrary to this assumption, if the price turns down from the current level, the bears will try to sink the pair below the important support of £42,653.53. If they succeed, it will suggest the start of a deeper correction that may reach the 50-day simple moving average (SMA).
We remain cautious and will wait for a decisive close above the overhead resistance before recommending any trades.
BTC TO GBP – HOW TO TRADE BTC/GBP 19TH OCTOBER 2021
In this analysis of BITCOIN PRICE GBP – Bitcoin soared above the £42,653.53 resistance on October 15, clearing the path for a retest of the all-time high at £47,240.05.
The rising 20-day exponential moving average (EMA) and the relative strength index (RSI) in the overbought zone indicate that bulls are in the driver’s seat.
If buyers push the price above £47,240.05, the BTC/GBP pair could start its northward journey toward the 1.618% Fibonacci extension level at £56,174.25.
Conversely, if the price turns down from £47,240.05, the first support to watch on the downside is £42,653.53. If bulls defend this level successfully, the pair may consolidate between the two levels for a few days.
A consolidation near the all-time high is a positive sign as it shows that traders are not rushing to the exit. That could increase the prospects of the continuation of the uptrend.
The first sign of weakness will be a break and close below the 20-day EMA. Such a move will suggest that supply exceeds demand and the sentiment could be turning negative. A break and close below the 20-day EMA could pull the price down to £38,257.06.
We are not confident that the price will sustain after making a new all-time high, hence we are not proposing any trades.
BTC TO GBP – HOW TO TRADE BTC/GBP 12TH OCTOBER 2021
Bitcoin has picked up momentum after breaking out of the descending channel. The rising 20-day exponential moving average (EMA) and the relative strength index (RSI) near the overbought zone indicate advantage to buyers.
The bears are currently attempting to stall the up-move at the overhead resistance at £42,653.53 but a positive sign is that bulls are not giving up much ground. This suggests that traders are not booking profits in a hurry and increases the possibility of a break above it.
If buyers propel the price above £42,653.53, the BTC/GBP pair could challenge the all-time high at £47,240.05. A breakout and close above this resistance could propel the pair to uncharted territory.
Contrary to this assumption, if the price turns down from the current level, the zone between £38,000 and the 20-day EMA is likely to act as a strong support.
A strong bounce off it will indicate that the sentiment remains positive and traders are buying on dips but if the 20-day EMA cracks, the short-term trend may tilt in favor of bears.
BTC TO GBP – HOW TO TRADE BTC/GBP 5TH OCTOBER 2021
Bitcoin price GBP bounced off the 100-day simple moving average (SMA) on September 29 and broke above the descending channel on October 1. This move suggests that the downtrend could be over. The 20-day exponential moving average (EMA) has turned up and the relative strength index (RSI) has jumped into the positive territory, indicating that bulls have the upper hand.
The BTC/GBP pair could now rally to £38,257.06 where the bears are likely to mount a stiff resistance. If the bulls defend the 20-day EMA during the next dip, it will increase the possibility of a break above £38,257.06
If that happens, the pair may start its northward march to £42,653.53 and then retest the all-time high at £47,240.05.
Alternatively, if the price turns down from the current level or the overhead resistance and breaks below the 20-day EMA, the pair could plummet to £31,011.
SEPTEMBER BLOG
BTC TO GBP – HOW TO TRADE BTC/GBP 28TH SEPTEMBER 2021
We had warned that Bitcoin could face selling near the 20-day exponential moving average (EMA) and that is what happened. The bulls tried to push the price above the 20-day EMA on September 24 and again on September 27 but failed. However, a minor positive is that bulls have successfully defended the 100-day simple moving average (SMA) for the past few days. This indicates accumulation at this support. Hence, this becomes an important level for the bears to break.
If that happens, several stop losses may trigger and the bearish momentum could pick up. The BTC/GBP pair could then slide to the support line of the descending channel pattern.
A break and close below the channel will indicate panic selling and that may pull the price down to £22,000.
This bearish view will invalidate if bulls drive and sustain the price above the channel. The pair could then rise to £35,525 and later to £38,000.
As the trend is down and a firm bottom is not in place, we are not proposing any trades.
BTC TO GBP – HOW TO TRADE BTC/GBP 21ST SEPTEMBER 2021
Although Bitcoin rose above £34,398.41 on September 15, the bulls could not sustain the higher levels. The bears pulled the price back below the moving averages on September 20, resulting in panic selling. The moving averages have completed a bearish crossover and the relative strength index (RSI) has dropped into the negative territory, indicating that sellers are in command. The long tail on today’s candlestick shows that bulls are attempting to defend the critical support at £31,011.
However, any relief rally to the 20-day exponential moving average (EMA) and the downtrend line is likely to attract selling. If the price turns down from this overhead resistance zone, the bears will try to resume the down move.
If the BTC/GBP pair plummets and closes below £31,011, the next stop could be £26,845. Such a deep fall could delay the start of the next leg of the uptrend.
The first sign of strength will be a break and close above the downtrend line. If that happens, the pair could climb toward £38,000.
We will wait for the price to confirm a bottom before recommending any fresh trade in it.
BTC TO GBP – HOW TO TRADE BTC/GBP 14TH SEPTEMBER 2021
We had highlighted in the previous analysis that the negative divergence on the relative strength index (RSI) was warning that the bullish momentum was slowing down and a break below the 20-day exponential moving average (EMA) could pull the price to the 50-day simple moving average (SMA).
Our assumption played out on September 7 as Bitcoin turned down sharply from £38,257.06 and plunged to an intraday low of £31,011. The bulls could not push the subsequent bounce above the 20-day EMA, which suggests that the sentiment has turned negative and traders are selling on rallies.
The important support to watch on the downside is £31,011. If this level breaks down, the selling momentum could pick up further and the BTC/GBP pair could plummet to £27,000.
The first sign of strength will be a break and close above the 20-day EMA. The bullish momentum could pick up if the pair rises above £34,398.41.
BTC TO GBP – HOW TO TRADE BTC/GBP 7TH SEPTEMBER 2021
Bitcoin price GBP bounced off the 20-day exponential moving average (EMA) on September 1, indicating strong buying by the bulls on dips. The buyers continued their momentum and pushed the price above the 61.8% Fibonacci retracement level at £36,834.35 on September 5. If bulls sustain the price above this level, the bitcoin to GBP pair could continue its journey toward £42,650.
Although the upsloping moving averages favor the bulls, the negative divergence on the relative strength index (RSI) indicates that the bullish momentum may be slowing down.
The first sign of weakness will be if bears pull the btc to gbp price below the 20-day EMA. If that happens, several short-term traders may book profits, dragging the pair down to the 50-day simple moving average (SMA).
AUGUST BLOGS
BTC TO GBP – HOW TO TRADE BTC/GBP 31ST AUGUST 2021
We had suggested traders book profits on 75% of their open positions in our previous analysis as we expected Bitcoin to face stiff resistance at the 61.8% Fibonacci retracement level at £36,834.35 and then again at £38,000.
The BTC/GBP pair turned down from £36,075.24 on August 29 and has reached the 20-day exponential moving average (EMA).
https://www.youtube.com/watch?v=s4HberhgV4w&t=2s
This is an important support for the bulls to defend because if it cracks, the decline could extend to £32,000 and then to the 50-day simple moving average (SMA).
The flattening 20-day EMA and the relative strength index (RSI) near the midpoint indicate that bulls are losing their grip.
This negative view will invalidate if the price rebounds off the current levels and rises above the August 23 intraday high of £36,999. Such a move could signal the resumption of the uptrend. If that happens, the next stop could be £38,000 and then £42,000.
BTC to GBP – HOW TO TRADE BTC/GBP 24TH AUGUST 2021
Bitcoin price GBP, we had mentioned in our earlier analysis that Bitcoin may rise to £36,000 and then to £38,000 if it sustains above £31,005 and that is what happened. The btc to gbp pair rallied to £36,999 on August 23. Traders who had purchased on our earlier recommendation may book profits on 75% of the open positions and trail the rest with a stop-loss below the 20-day exponential moving average (EMA).
CRYPTOCURRENCY TECHNICAL ANALYSIS – HOW TO TRADE BITCOIN VS GBP GRAPH
The btc to gbp pair is likely to face stiff resistance at the 61.8% Fibonacci retracement level at £36,834.35 and then again at £38,000. If the price turns down and breaks below £35,280, the pair could decline to the 20-day EMA. A strong rebound off this support will suggest that the trend remains positive and the bulls will then again try to resume the uptrend. A breakout of £38,000 could open the doors for a rally to £42,500. The first sign of weakness will be a break and close below the 20-day EMA. Such a move will suggest that traders are closing their positions and supply exceeds demand. The pair may then decline to the 50-day simple moving average (SMA).
BTC to GBP – HOW TO TRADE BTC/GBP 10TH AUGUST 2021
We had said in our previous analysis that a short-term trading opportunity may open up if Bitcoin rebounds off the 20-day exponential moving average (EMA) and that is what happened. Traders who bought on our recommendation may book partial profits and trail the stops higher on the rest of the position.
CRYPTOCURRENCY TECHNICAL ANALYSIS – HOW TO TRADE BITCOIN VS GBP GRAPH
The BTC/GBP pair turned down from £30,310.12 on August 1 but the bulls aggressively defended the 20-day EMA. This suggests that the sentiment has turned positive and traders are viewing dips as a buying opportunity. The pair bounced off the 20-day EMA on August 4 and the bulls pushed the price above the overhead resistance of £31,005 on August 7. The bears tried to trap the bulls by pulling the price back below the breakout level of £31,005 on August 8 but the long tail on the day’s candlestick shows strong buying at lower levels. If buyers sustain the price above £31,005, the pair could start its journey to £36,000 and then to £38,000. The rising moving averages and the relative strength index (RSI) in the overbought zone suggests that bulls are in control. This positive view will invalidate if the bears pull the price back below the 20-day EMA. Such a move could open the doors for a decline to £26,926.16.
Hopefully, you have enjoyed today’s article. Thanks for reading! Have a fantastic day! Live from the Platinum Crypto Trading Floor.
Bitcoin price gbp we had said in our previous analysis that bears will continue to defend the £31,005 levels aggressively and that is what happened. The failure of the bulls to push the Bitcoin to GBP price above £31,005 between July 30 and August 1 attracted profit-booking from short-term traders.
https://youtu.be/HZkHpfDI2B4
CRYPTOCURRENCY TECHNICAL ANALYSIS – HOW TO TRADE BITCOIN VS GBP GRAPH
The moving averages have completed a bullish crossover and the RSI is in the positive territory, suggesting that bulls have the upper hand. If the BTC/GBP pair rebounds off the 20-day exponential moving average (EMA), the bulls will make one more attempt to clear the overhead hurdle at £31,005. If they succeed, it will suggest the start of a new uptrend. This bullish view will invalidate if the btc to gbp price breaks below the 20-day EMA. Such a move will increase the possibility of a range-bound action for the next few days. A short-term trading opportunity may arise if the price rebounds off the 20-day EMA but traders could remain on the sidelines if the support cracks.
Hopefully, you have enjoyed today’s article. Thanks for reading! Have a fantastic day! Live from the Platinum Crypto Trading Floor.
Bitcoin price gbp we had mentioned in our previous analysis that the bulls may not surrender the £21,000 to £20,000 support zone easily and that is what happened. Bitcoin soared from the support zone and broke above the downtrend line of the descending triangle pattern on July 26.
https://youtu.be/fwplT0SonzQ
CRYPTOCURRENCY TECHNICAL ANALYSIS – HOW TO TRADE BITCOIN VS GBP GRAPH
This may have attracted aggressive short-covering from the bears, resulting in the spike to £29,358.54. However, the long wick on the day’s candlestick suggests that demand dried up at higher levels. If bulls do not allow the btc to gbp price to dip back into the triangle, it will indicate buying on dips. In such a case, buyers will make one more attempt to push the price to the overhead resistance at £31,005. The bears may again mount a stiff resistance at this level and if the price turns down from it, the BTC/GBP pair could extend its range-bound action between £31,005 and £21,000 for a few more days. A short-term buying opportunity could arise if the bitcoin to gbp price rebounds off the downtrend line as that could open the doors for a possible rise to £31,005. Conversely, if bears pull the price back into the triangle, the pair could again drop to £23,620. Traders must keep a close stop-loss on fresh trading bets and trail it higher as the price moves northward. A bull phase has not yet started in any of the major coins; hence traders should continue to book profits near resistance levels and not get too greedy.
Hopefully, you have enjoyed today’s article. Thanks for reading! Have a fantastic day! Live from the Platinum Crypto Trading Floor.
Bitcoin Price GBP we had mentioned in our previous analysis that the possibility of a fall is greater and that is what happened. BTC to GBP broke below the £23,620 support on July 15, indicating that the bitcoin to gbp bears have overpowered the bulls. The bulls tried to push the btc to gbp price back above £23,620 on July 18 but failed. This may have attracted further selling and the bears will now try to capitalize on the weak sentiment by pulling the price below £21,000.
https://youtu.be/L9JPq-dorOg
CRYPTOCURRENCY TECHNICAL ANALYSIS – HOW TO TRADE BITCOIN PRICE GRAPH GBP
If they succeed, the BTC/GBP pair will complete a bearish descending triangle pattern. This negative setup could start the next leg of the downtrend, which may reach £15,000. The downsloping moving averages and the relative strength index (RSI) in the negative territory indicate the path of least resistance is to the downside. However, the bulls may not surrender the £21,000 to £20,000 support zone easily and will try to defend it. A strong rebound will indicate accumulation at lower levels. The bulls will have to push the btc to gbp price above the downtrend line to signal a trend change. As the trend is negative, traders may remain on the sidelines until a bottom is confirmed. Pre-empting a bottom could quickly result in a loss.
Hopefully, you have enjoyed today’s article. Thanks for reading! Have a fantastic day! Live from the Platinum Crypto Trading Floor.
Bitcoin has been trading between the 20-day exponential moving average (EMA) and the horizontal support at £23,620 for the past few days. This tight range trading suggests a lack of urgency among traders to buy at the current levels. When the price consolidates near a strong support, the possibility of a breakdown increases. The bears will now try to sink the BTC/GBP pair below the £23,620 support.
CRYPTOCURRENCY TECHNICAL ANALYSIS – HOW TO TRADE BITCOIN VS GBP GRAPH
If they succeed, the pair could start its journey to the next major support at £21,000. This level has held successfully twice before, hence the bulls will again try to defend the support. A strong rebound from the £21,000 to £23,620 support zone will indicate accumulation by the bulls while a shallow bounce will enhance the prospects of a further slide. If bears sink the price below £21,000, the selling could intensify and the pair may drop to £15,000. This negative view will invalidate if the price rebounds off the current level and breaks above the 50-day simple moving average (SMA). Such a move will open the gates for a move to £29,350.
Hopefully, you have enjoyed today’s article. Thanks for reading! Have a fantastic day! Live from the Platinum Crypto Trading Floor.
The Bitcoin price GBP is currently stuck between the 50-day simple moving average (SMA) and £23,620. Although the bulls pushed the xbt to gbp price above the 20-day exponential moving average (EMA) on July 4, they could not clear the hurdle at the 50-day SMA. This shows that the bears are not ready to throw in the towel yet. If bears pull the price below £23,620, the BTC/GBP pair could retest the critical support at £21,000. Repeated retest of a support level tends to weaken it. A break below £21,000 could result in panic selling and the xbt to gbp pair could plummet to £15,000.
CRYPTOCURRENCY TECHNICAL ANALYSIS – HOW TO TRADE BITCOIN PRICE GRAPH GBP
Therefore, traders who had purchased on the rebound off £21,000 as suggested in our earlier analysis may trail their stops to breakeven. The flattish 20-day EMA and the bullish divergence on the relative strength index (RSI) indicate a minor advantage to the bulls. If the xbt to gbp price rebounds off £23,620, the bulls will make one more attempt to drive the price above the 50-day SMA. If they succeed, the pair could start its journey toward the £30,000 to £31,005 overhead resistance zone.
Hopefully, you have enjoyed today’s article. Thanks for reading! Have a fantastic day! Live from the Platinum Crypto Trading Floor.
In our previous analysis we had recommended traders buy the rebound off £21,000 and the market gave two opportunities to buy on June 22 and 26. The stops for this trade can be kept just below £20,000. Bitcoin is currently facing resistance at the 20-day exponential moving average but the bears have not been able to sink the price back below £23,620. This suggests that the selling pressure may be reducing.
CRYPTOCURRENCY TECHNICAL ANALYSIS – HOW TO TRADE BITCOIN PRICE GRAPH GBP
The bullish divergence on the relative strength index also supports the view that the bearish momentum may be waning. If the bulls drive the price above the 20-day EMA, the BTC/GBP pair may rise to the 50-day simple moving average where the bears are likely to mount another stiff resistance. However, the possibility of the bulls pushing the price above the 50-day SMA is high. If that happens, the pair could rally to £29,350 where traders can book profits on 50% of their position and trail the stops on the rest. A breakout and close above the £30,000 to £31,005 resistance zone will suggest that the downtrend has ended. This bullish view will be invalidated if the pair turns down from the current level and plummets below the £20,000 support. Such a move could open the doors for a further decline to £15,000.
Hopefully, you have enjoyed today’s article. Thanks for reading! Have a fantastic day! Live from the Platinum Crypto Trading Floor.
Bitcoin price gbp last week, we had advised traders to book profits on 50% of the positions bought at lower levels because a new uptrend is unlikely to start in a hurry. This turned out to be a profitable exercise as Bitcoin turned down from £29,350 on June 15. The btc to gbp 20-day exponential moving average (EMA) failed to act as a strong support when the bitcoin to gbp price turned down from £29,350. This shows the sentiment remains negative. The failure of the buyers to defend the £23,620 support is another sign of a lack of demand at lower levels.
CRYPTOCURRENCY TECHNICAL ANALYSIS – HOW TO TRADE BITCOIN PRICE GRAPH GBP
However, the relative strength index (RSI) has formed a positive divergence, indicating the selling pressure has reduced. The gbp to btc bulls are likely to defend the £23,620 to £21,000 support aggressively. If buyers can drive the gbp to btc price above the 20-day EMA, the BTC/GBP pair will continue its consolidation between £21,000 to £31,005. Contrary to this assumption, if bears sink the price below £21,000, the selling could intensify and the pair may drop to £15,000. Long-term investors may start to accumulate on dips. They can buy 30% of their desired long-term purchase at the current level. Short-term investors may buy if the next dip again rebounds off £21,000. The stops can be placed just below the support. Long positions should be avoided if the next drop cracks the £21,000 level.
Hopefully, you have enjoyed today’s article. Thanks for reading! Have a fantastic day! Live from the Platinum Crypto Trading Floor.
Bitcoin price GBP we had advised traders to buy 40% of the desired allocation in Bitcoin on a bounce off £21,000. Traders got that opportunity on June 8 when the price rebounded off £21,952.65. Those who bought the dip are already sitting on profits. The BTC/GBP pair is unlikely to start a new uptrend in a hurry. Therefore, traders should book profits on their gains and again attempt to buy at lower levels. About 50% of the position may be closed at the current level and the rest can be held with the stop-loss at breakeven.
CRYPTOCURRENCY TECHNICAL ANALYSIS – HOW TO TRADE BITCOIN PRICE GRAPH GBP
The 20-day EMA has started to turn up and the RSI has risen into the positive territory, indicating that the selling pressure has reduced. The bitcoin to gbp pair may now rally to the 50-day SMA, which is likely to act as a stiff resistance. If the bitcoin price uk turns down from the 50-day SMA, the pair could drop to the 20-day EMA. A strong rebound off this support will suggest that the sentiment has turned bullish and traders are attempting to buy on dips. A breakout and close above the 50-day SMA will clear the path for a stronger recovery that may reach the 61.8% Fibonacci retracement level at £33,902.53 and then £38,000. Conversely, if the price turns down and breaks below the 20-day EMA, it will suggest that traders are squaring their positions on rallies. That may result in a few days of range-bound action.
Hopefully, you have enjoyed today’s article. Thanks for reading! Have a fantastic day! Live from the Platinum Crypto Trading Floor.
Bitcoin Price GBP turned down from the 20-day exponential moving average (EMA) on June 4, suggesting the bears are aggressively defending this resistance. The downsloping moving averages and the relative strength index (RSI) near the oversold territory indicate the bears are in control. The BTC/GBP pair has broken below the critical support at £23,620 today. This opens the door for a drop to the £21,000 to £20,000 support zone. The bulls are likely to defend this zone aggressively.
CRYPTOCURRENCY TECHNICAL ANALYSIS – HOW TO TRADE BITCOIN PRICE GRAPH GBP
The Bitcoin price GBP buyers will have to push and sustain the price above the 20-day EMA to indicate a possible change in trend. Until then, every rally is likely to be met with strong selling pressure from the bears. Aggressive traders may buy 40% of the desired allocation if the Bitcoin price GBP bounces off £21,000. This trade should not be attempted on the way down but only on a rebound. This is a risky counter-trend trade, hence, traders may keep a close stop-loss to protect their positions because if the £20,000 level cracks, the decline could extend to £15,000.
Hopefully, you have enjoyed today’s article. Thanks for reading! Have a fantastic day! Live from the Platinum Crypto Trading Floor.
Bitcoin Price GBP relief rally again turned down from the 38.2% Fibonacci retracement level at £28,593.47 on May 27. This suggests that traders are selling on every minor rally. Both moving averages are sloping down and the relative strength index (RSI) is in the negative territory, indicating bears have the upper hand. The sellers will now try to sink the BTC/GBP pair below the £23,620 support.
CRYPTOCURRENCY TECHNICAL ANALYSIS – HOW TO TRADE BITCOIN PRICE CHART GBP
If they succeed, the Bitcoin Price GBP could drop to the critical £21,000 to £20,000 support zone. A break below this zone could result in panic selling, which may pull the price down to £15,000. The longer the price remains below the 20-day exponential moving average (EMA), the greater is the possibility of a continued downside. This negative view will invalidate if the bulls push and sustain the price above the 20-day EMA. Such a move will suggest strong buying at lower levels and the pair could rally to £31,005 and then to the 50-day simple moving average (SMA). We will wait for the price to break out of the 20-day EMA and sustain it for a couple of days before suggesting fresh long positions.
Hopefully, you have enjoyed today’s article. Thanks for reading! Have a fantastic day! Live from the Platinum Crypto Trading Floor.
Bitcoin Price GBP plunged to £21,000 on May 19 according to our expectations. However, the bulls purchased this drop as seen from the long tail on the day’s candlestick. The bulls attempted to push the price back above £31,005 on May 20 but failed. The downsloping moving averages and the RSI near the oversold territory suggest that bears are in control.
CRYPTOCURRENCY TECHNICAL ANALYSIS – HOW TO TRADE BITCOIN PRICE CHART GBP
Therefore, relief rallies to the 20-day EMA are likely to be sold into. With buyers stepping in at £21,000 and sellers at £31,005, the stage seems to be set for a consolidation between these two levels for a few days. However, if the bears sink the price below £21,000, the selling could intensify and the pair could drop to £15,000. This negative view will invalidate if the bulls push and sustain the price above £31,005. That will suggest the bottom has been made at £21,000. A short-term trading opportunity may present if the price rebounds off the £21,000 to £22,000 range in the next few days. Traders may buy on the bounce off this zone with the stops at £20,800. The target objective of this trade is £31,005. Traders may step aside if the price breaks below £21,000.
Hopefully, you have enjoyed today’s article. Thanks for reading! Have a fantastic day! Live from the Platinum Crypto Trading Floor.
Bitcoin Price GBP, we had mentioned that shorting opportunities may open up for professional traders and that is what happened. Bitcoin broke below the £38,000 support on May 12, which triggered panic selling. The BTC to GBP pair continued to move lower and reached the £31,005 support on May 17. The bulls are currently attempting to defend the £31,005 support.
CRYPTOCURRENCY TECHNICAL ANALYSIS – HOW TO TRADE BITCOIN PRICE CHART GBP
However, any rebound from the current level is likely to face stiff resistance from the 20-day EMA as traders stuck at higher levels are likely to bail out of their positions on rallies. The downsloping 20-day EMA and the RSI near the overbought territory indicate the bears are in control. A break below the £31,005 support will invalidate the bullish falling wedge pattern and open the doors for a further fall to £21,000. Though a rebound from the current levels can not be ruled out, we do not suggest buying in a falling market. We will wait for the correction to end and a bottom to be confirmed before recommending long positions once again.
Hopefully, you have enjoyed today’s article. Thanks for reading! Have a fantastic day! Live from the Platinum Crypto Trading Floor.
Bitcoin price GBP broke above the downtrend line of the falling wedge pattern on May 8 but the bulls could not build up and start a new rally higher, as we had predicted in our previous analysis. The price re-entered the wedge on May 10 and broke below the moving averages, suggesting the bears are selling on every minor rally. The first support on the downside is £38,000.
CRYPTOCURRENCY TECHNICAL ANALYSIS – HOW TO TRADE BITCOIN PRICE CHART GBP
If the bears sink the xbt to gbp price below this support, the BTC/GBP pair could drop to £33,705.58 and then to £31,005. A breakdown from this level could result in a massive long liquidation. The flat moving averages and the RSI below 45 suggest the bears are making a comeback. This negative view will invalidate if the xbt to gbp price turns up and breaks above £42,653.53. We do not find any buy setups at the current levels, hence we are not recommending any long positions in it. However, professional traders may gear up to soon short the pair.
Hopefully, you have enjoyed today’s article. Thanks for reading! Have a fantastic day! Live from the Platinum Crypto Trading Floor.
Bitcoin Price GBP we did not suggest any trade in Bitcoin last week as we believed that every higher level will bring additional supply and that is what seems to be happening. The BTC to GBP pair surged above the moving averages on April 30 but the bulls could not sustain the rally. The bulls again tried to extend the relief rally on May 3 but met with stiff resistance above the £42,000 level as seen from the long wick on the day’s candlestick. Today, the bears have dragged the price back below the moving averages.
CRYPTOCURRENCY TECHNICAL ANALYSIS – HOW TO TRADE BITCOIN PRICE CHART GBP
the bears sustain the BTC to GBP price below the 20-day EMA, the pair could again drop to £37,617. The bulls may try to defend this level aggressively but every rise is likely to hit a wall near the moving averages. A break below £37,617 could pull the price down to £32,500. This negative view will invalidate if the BTC to GBP price turns up from the current level and rises above the downtrend line of the falling wedge pattern. That could clear the path for a rally to the all-time high at £47,240.05. However, such a move looks unlikely at the moment. We do not find any strong conviction trades at the current levels.
Hopefully, you have enjoyed today’s article. Thanks for reading! Have a fantastic day! Live from the Platinum Crypto Trading Floor.
BITCOIN PRICE GBP – HOW TO TRADE BTC/GBP 27TH APRIL 2021
Bitcoin price GBP slipped and closed below the £36,777 support on April 24 but the bears could not extend the decline to £31,005. The price reversed direction from £33,705.58 on April 25 and soared back above £36,777 on April 26. After the initial bounce, the bulls are unlikely to have an easy path higher. The bearish crossover on the moving averages and the RSI still in the negative territory suggests the bears have the upper hand.
CRYPTOCURRENCY TECHNICAL ANALYSIS – HOW TO TRADE BITCOIN PRICE CHART GBP
The relief rally is likely to face stiff resistance at the moving averages. If the price turns down from the 20-day EMA, it will suggest that traders are liquidating their positions at higher levels. That could pull the price down to the critical support at £36,777. If this support cracks, the risk of a decline to £31,005 increases. The deeper the decline, the longer it will take for the BTC/GBP pair to stage a recovery and challenge the all-time high. This negative view will invalidate if the pair climbs above the moving averages. Such a move could open the doors for a retest of the £44,238 to £47,240.05 overhead resistance zone.
Hopefully, you have enjoyed today’s article. Thanks for reading! Have a fantastic day! Live from the Platinum Crypto Trading Floor.
BITCOIN PRICE GBP – HOW TO TRADE BTC/GBP 20TH APRIL 2021
Bitcoin price GBP behaved the way we had projected in the previous analysis. Traders who had bought on the breakout and trailed their stops higher according to our suggestion could have exited at a small profit. The biggest cryptocurrency broke out of the overhead resistance at £44,238 and made a new all-time high at £47,240.05 on April 14.
CRYPTOCURRENCY TECHNICAL ANALYSIS – HOW TO TRADE BITCOIN PRICE CHART GBP
However, the bulls could not sustain the Bitcoin price GBP above £44,238 and the BTC/GBP pair dipped back below this level on April 17. This resulted in sharp selling by short-term traders and the price plunged below the 50-day SMA on April 18. Although the bulls purchased the initial dip, they have not been able to continue the recovery. The 50-day SMA, which had been acting as a major support, is now acting as a resistance. Selling continued on April 19 and the pair commenced its journey toward the next support at £36,777. This is an important support to watch out for because if it cracks, the selling could intensify and the pair may drop to £31,005. The 20-day EMA has turned down and the RSI has slipped into the negative zone, indicating advantage to the bears. However, if the bulls purchase the drop to £36,777, the btc price gbp could remain range-bound for a few days. The break above the 20-day EMA will be the first sign that the selling could be over and the bulls are back in command.
Hopefully, you have enjoyed today’s article. Thanks for reading! Have a fantastic day! Live from the Platinum Crypto Trading Floor.
Bitcoin price gbp broke above the overhead resistance of £44,238 on April 12 and 13, but the bulls have not been able to sustain the breakout. This suggests that demand dries up at higher levels. However, the positive sign is that the bulls have not given up much ground, which shows that traders are not closing their positions in a hurry. The upsloping 20-day EMA and the RSI above 62 suggest advantage to the bulls.
CRYPTOCURRENCY TECHNICAL ANALYSIS – HOW TO TRADE BITCOIN PRICE CHART GBP
If the bulls can push and sustain the btc value gbp above £44,238 for three days, the next leg of the uptrend could resume. Aggressive traders can buy on a close (UTC time) above £44,238 and keep a stop-loss below the 20-day EMA. The first target for Bitcoin highest price GBP ever is on the upside is £45,000. Traders can trail the stops higher as the price moves northward. However, the short-term traders may dump their positions if the bulls fail to sustain the bitcoin value gbp above £44,238. That may also encourage the aggressive bears to initiate short positions. If that happens, the btc price gbp could drop to the 50-day SMA. A break below this support could start a deeper correction that could reach £36,777 and then £31,005.
Hopefully, you have enjoyed today’s article. Thanks for reading! Have a fantastic day! Live from the Platinum Crypto Trading Floor.
BITCOIN PRICE GBP – HOW TO TRADE BTC/GBP 6TH APRIL 2021
Bitcoin price GBP broke above the downtrend line on March 29, but the bitcoin value gbp could not push the price above the all-time high at £44,238. This suggests the bears are defending this level aggressively. However, a positive sign is that the bulls have not allowed the price to dip back below the 20-day EMA. This suggests the bulls are buying on every minor dip
CRYPTOCURRENCY TECHNICAL ANALYSIS – HOW TO TRADE BITCOIN PRICE CHART GBP
This tight range trading is unlikely to continue for long. We should soon see a sharp move that could start the next trend. If the bulls can drive the btc price gbp above the all-time high and sustain the breakout for two days, it will signal the start of the next leg of the uptrend. The next target objective on the upside is £50,000. Contrary to this assumption, if the bears sink the price below the 20-day EMA, the BTC/GBP pair could retest the critical support at the 50-day SMA. This is an important support to watch out for because if it cracks, the pair could drop to £36,777. Such a move will suggest that the bullish momentum has weakened. Traders may buy on a breakout and close above £44,238. The stop-loss for this trade could be kept below the 20-day EMA initially and can be trailed higher as the Bitcoin price GBP moves northwards. Contrary to this assumption, long positions may be avoided if the price breaks below the 20-day EMA.
Hopefully, you have enjoyed today’s article. Thanks for reading! Have a fantastic day! Live from the Platinum Crypto Trading Floor.
Bitcoin price GBP broke below the £38,355 support on March 25 but the bears could not crack the 50-day SMA support. This could have attracted sharp buying from the bulls and short covering from the bears who went short below £38,355. The BTC price GBP rose back above the 20-day EMA on March 26, indicating the breakdown was a bear trap. On March 29, the bulls pushed the price above the downtrend line. If they can sustain the breakout, the pair may retest the all-time high at £44,238.
CRYPTOCURRENCY TECHNICAL ANALYSIS – HOW TO TRADE BITCOIN PRICE CHART GBP
A Bitcoin price GBP breakout of the all-time high will signal the resumption of the uptrend, with the next target objective at £50,000. The upsloping moving averages suggest advantage to the bulls but the negative divergence on the RSI signals caution. The bears are unlikely to give up without a fight. They will mount a stiff resistance in the zone between £42,000 and £44,238. If the Bitcoin value gbp turns down from this resistance zone and breaks the 20-day EMA support, the bears will again challenge the 50-day SMA. Repeated retests of a critical support level tend to weaken it. Therefore, the next dip toward the 50-day SMA might break it. If that happens, the pair could start a deeper correction to £31,005. The chart setup looks like the price may remain range-bound with a negative bias. Hence, we are not recommending any fresh long positions at the current levels.
Hopefully, you have enjoyed today’s article. Thanks for reading! Have a fantastic day! Live from the Platinum Crypto Trading Floor.
BITCOIN PRICE GBP – HOW TO TRADE BTC/GBP 23RD MARCH 2021
Bitcoin price GBP bounced off the 20-day EMA on March 17 fizzled out at £43,125.98 on March 18. This suggests that bears are aggressively defending the all-time high at £44,238. The failure to make a new all-time high could have attracted profit-booking from short-term traders, which has pulled the price below the 20-day EMA. In an uptrend, when the price breaks below the 20-day EMA, it is a sign that the bullish momentum may be waning.
CRYPTOCURRENCY TECHNICAL ANALYSIS – HOW TO TRADE BITCOIN PRICE CHART GBP
the selling continues and the bears sink the price below £38,355, it will complete a bearish descending triangle pattern. This setup has a pattern target at £34,472. If the Bitcoin price GBP breaks the 50-day SMA, it will signal a possible trend reversal. The flat 20-day EMA and the RSI just above the midpoint also suggest the bulls are losing their grip. This negative view will invalidate if the Bitcoin price GBP rebounds off £38,355 and the bulls push the pair above the downtrend line of the triangle. Such a move will invalidate the bearish pattern and could result in a retest of the all-time high. As the bearish divergence on the RSI warrants caution, we suggest traders remain on the sidelines until a new bullish setup form.
Hopefully, you have enjoyed today’s article. Thanks for reading! Have a fantastic day! Live from the Platinum Crypto Trading Floor.
The Bitcoin price GBP We had mentioned in our previous analysis that we were bullish and that is how Bitcoin played out last week. The largest cryptocurrency surged above £41,795 on March 13 and hit a new all-time high at £44,238. However, the bulls could not hold on to the higher levels as the price turned down and broke below the breakout level at £41,795. This is a negative sign as it suggests traders are booking profits on rallies.
CRYPTOCURRENCY TECHNICAL ANALYSIS – HOW TO TRADE BTC/GBP
The Bitcoin price GBP pair has dipped back to the 20-day EMA, which is an important support to watch out for. If the price rebounds off this support, it will suggest traders are buying on dips. The bulls will then again try to resume the uptrend by pushing the Bitcoin price GBP above the £41,795 to £44,238 overhead resistance zone. Contrary to this assumption, if the bears sink the price below the 20-day EMA, the pair could drop to the 50-day SMA. This is an important support because the bears have not been able to break it since October 9 of last year. Therefore, a break below it will suggest a possible change in trend. The bearish divergence on the RSI is pointing to a possible deeper correction. We will wait for the price to form a bottom before proposing a trade in it.
Hopefully, you have enjoyed today’s article. Thanks for reading! Have a fantastic day! Live from the Platinum Crypto Trading Floor.
BITCOIN PRICE GBP – HOW TO TRADE BTC/GBP 9TH MARCH 2021
The Bitcoin price GBP turned down from the £36,759.61 overhead resistance on March 4, but the bulls did not allow the price to sustain below the 20-day EMA on March 5 and 6. This showed the bulls are buying on minor dips and are not waiting for a fall to £30,936 to buy. The bulls pushed the price above the £36,759.61 overhead resistance on March 8 and have followed it up with another up-move today. The BTC/GBP pair could now rally to the all-time high at £41,795.
CRYPTOCURRENCY TECHNICAL ANALYSIS – HOW TO TRADE BTC/GBP
If the bulls can propel the Bitcoin price GBP above this resistance, the pair could reach the psychological level at £50,000. The 20-day EMA has started to rise again and the RSI has risen above 63 levels, which suggests the bulls are back in the driver’s seat. However, the bears are unlikely to give up easily. They are likely to mount stiff resistance at £41,795. If the Bitcoin price GBP turns down from the all-time high, the pair may consolidate between £36,759.61 and £41,795 for a few days. Although the trend is bullish, we do not find a trade with an attractive risk to reward ratio, hence, we are not recommending any fresh long positions.
Hopefully, you have enjoyed today’s article. Thanks for reading! Have a fantastic day! Live from the Platinum Crypto Trading Floor.
BITCOIN PRICE GBP – HOW TO TRADE BTC/GBP 2ND MARCH 2021
The Bitcoin Price GBP dropped to £31,005 on February 28 as we had anticipated in our previous analysis. The rebound off the strong support has also been according to our expectation. The bulls will now try to push the price above £36,759.61. If they succeed, the BTC/GBP pair could start its journey towards the all-time high at £41,795. A breakout of this resistance could start the next leg of the up-move towards £50,000.
CRYPTOCURRENCY TECHNICAL ANALYSIS – HOW TO TRADE BTC/GBP
However, the flat moving averages and the RSI just above the midpoint suggest a few days of range-bound action. While the support is defined, the Bitcoin price GBP is yet to confirm the resistance level. If the pair forms a range, traders may wait for the Bitcoin price GBP to dip to £31,000 before buying. The stop-loss for this trade could be kept just below the 50-day SMA because a break below this support will indicate a possible change in trend. If the 50-day SMA breaks down, the decline could extend to £27,733.84 and then to £21,000.
FEBRUARY BLOGS
BITCOIN PRICE GBP – HOW TO TRADE BTC/GBP 23RD FEBRUARY 2021
Bitcoin price GBP as we had mentioned in our previous analysis, Bitcoin hit our first target objective at £40,872 on February 21. However, after this technical level was reached, profit-booking set in on February 22, which pulled the price down to the 20-day EMA. The long tail on the day’s candlestick shows that the bulls purchased the dip aggressively. The buyers will now have to drive the price above £41,795 to resume the uptrend.
CRYPTOCURRENCY TECHNICAL ANALYSIS – HOW TO TRADE BTC/GBP
However, the bears are unlikely to give up without a fight. They are currently again trying to sink the Bitcoin price GBP below the 20-day EMA. If they succeed, then it could lead to long liquidation as the aggressive bulls who purchased on February 22 may be forced to cover their positions. The next support on the downside is £30,936 and then the 50-day SMA. The bulls may try to arrest the decline in this zone. If they are able to do that, the Bitcoin price GBP may remain range-bound for a few days. On the other hand, if the bears sink the Bitcoin price GBP below the 50-day SMA, the pair could enter a deeper correction and decline to £21,000. As the bottom is still not in place, we are not proposing a trade in it.
BITCOIN PRICE GBP – HOW TO TRADE BTC/GBP 16TH FEBRUARY 2021
Bitcoin price GBP has been sustaining above the £30,936 breakout level for the past few days, but the momentum has not picked up. This shows hesitation among traders to buy at higher levels. But the bears have not even been able to pull the price down to £30,936, which suggests that traders are holding their long positions and are not closing them as they expect the uptrend to continue.
CRYPTOCURRENCY TECHNICAL ANALYSIS – HOW TO TRADE BTC/GBP
The upsloping moving averages and the RSI in the overbought territory suggest the path of least resistance is to the upside. If the bulls can propel the price above £36,000, the next leg of the up-move may begin. The next target on the upside is £40,872 and then £44,424.35. Contrary to this assumption, if the bulls fail to push and sustain the Bitcoin price GBP above £36,000, the short-term traders may book profits and that may pull the price down to the breakout level at £30,936. This is the critical level to watch out for. If the Bitcoin price GBP rebounds off £30,936, the bulls will try to resume the uptrend. On the other hand, if the bears sink the price below the support, the pair may drop to the 50-day SMA and then to £21,000.
BITCOIN PRICE GBP – HOW TO TRADE BTC/GBP 9TH FEBRUARY 2021
Bitcoin price GBP surprised us with the sharp rally in the past few days. It broke and closed above the downtrend line on February 2, which invalidated the bearish descending triangle pattern. The failure of a bearish pattern is a bullish sign as it traps several aggressive bulls who then hurry to close their short positions. The BTC/GBP pair attempted to break above the all-time high on February 6 but failed
CRYPTOCURRENCY TECHNICAL ANALYSIS – HOW TO TRADE BTC/GBP
However, the positive news flow on February 8 attracted huge buying from the bulls and short covering from the bears who may have opened short positions near the all-time high. The Bitcoin price GBP could now rally to £40,872 and if that level is also crossed the uptrend could reach £44,424.35. However, it is unlikely to be a straight dash to the target objective. The price is likely to turn down and retest the breakout level at £30,936. If the bulls can flip this level to support, it will increase the possibility of the resumption of the uptrend. On the other hand, if the bears sink the Bitcoin price GBP below £30,936, a drop to the 20-day EMA is possible. A strong rebound off this support will suggest that traders continue to buy on dips. However, a break below the 20-day EMA will suggest the bullish momentum has weakened. A short-term buying opportunity may open up if the pair rebounds off £30,936, but the risk is high. Therefore, we are not proposing any fresh long positions for swing traders.
BITCOIN PRICE GBP – HOW TO TRADE BTC/GBP 2ND FEBRUARY 2021
Bitcoin price GBP witnessed frenzied buying on January 29, which pushed the price above the downtrend line, resulting in a short squeeze that drove the price to £28,000. However, the bulls could not hold on to the breakout and the price gave back a large part of its gains and re-entered the triangle on the same day.
CRYPTOCURRENCY TECHNICAL ANALYSIS – HOW TO TRADE BTC/GBP
The Bitcoin price GBP has been clinging to the downtrend line for the past four days, which is usually a positive sign. If the bulls can propel and sustain the Bitcoin price GBP above the downtrend line, the pair may again rally to £28,000 and then to £30,000. A break above the £30,936 could resume the uptrend, but we give it a low probability of occurring at this juncture. The 20-day EMA has flattened out and the RSI is near the midpoint, which suggests a few days of range-bound action. The first sign of weakness will be a break below the 50-day SMA. If that happens, the pair could drop to the £21,000 support. This is an important level to watch out for because, if this cracks, a deeper correction could start. We do not find a reliable buy setup and the indicators are also not pointing to a clear advantage to the bulls. Therefore, we are not proposing a trade in it.
JANUARY BLOGS
BITCOIN PRICE GBP – HOW TO TRADE BTC/GBP 26TH JANUARY 2021
Bitcoin Price GBP, According to our assumption outlined in the previous analysis, the bulls could not push the price above the downtrend line. That led to a sharp fall below the 20-day EMA on January 21 and Bitcoin dropped to the 50-day SMA on January 22. Although the price rebounded off the 50-day SMA, the bulls could not push and sustain the price above the 20-day EMA. This suggests the sentiment has turned bearish and traders are now looking to sell on rallies to strong resistance levels.
CRYPTOCURRENCY TECHNICAL ANALYSIS – HOW TO TRADE BTC/GBP
The Bitcoin price GBP Doji candlestick pattern with a long wick on January 25 shows the bears sold the minor rally above the 20-day EMA. The bears are currently attempting to sink the price to the £21,000 support. The 20-day EMA has started to slope down and the RSI is trading in the negative territory, suggesting the bears are attempting to make a comeback. If the Bitcoin Price GBP breaks and sustains below £21,000, the BTC/GBP pair will complete a bearish descending triangle pattern. If that happens, the pair could drop to £16,459.75 and then to the pattern target at £11,064. This bearish view will invalidate if the pair turns up from the current levels and breaks above the downtrend line. Such a move could catch the bears off guard and may result in short-covering that could push the Bitcoin Price GBP back to the high at £30,936.
BITCOIN PRICE GBP – HOW TO TRADE BTC/GBP 19TH JANUARY 2021
Bitcoin price GBP has seemingly lost its parabolic momentum but is either poised for another strong run or the expected drop which the industry is poised for. Bitcoin saw a strong dip in the last 11 days, since hitting its most recent all-time high on January 8th. Today, January 19th, the coin struggles to breach a resistance level at £26,300, with each attempt being followed by a rejection of its price.
CRYPTOCURRENCY TECHNICAL ANALYSIS – HOW TO TRADE BTC/GBP
As we had mentioned in the previous analysis, Bitcoin has not resumed its uptrend yet. The bulls are facing selling near the downtrend line but the positive sign is that the buyers are not allowing the price to dip below the 20-day EMA. This suggests demand dries up at higher levels but traders are buying the dips. The upsloping moving averages and the RSI in the positive territory suggest bulls have the upper hand. If the buyers push the price above the downtrend line, the BTC/GBP pair may again attempt to retest the all-time high at £30,936. A breakout and close above this level will signal the resumption of the uptrend. The next target objective on the upside is £38,616. However, we give it a low probability of occurring as we anticipate the bears to mount a stiff resistance in the £29,398 to £30,936 zone. Instead of breaking above the downtrend line, if the bears sink the price below the 20-day EMA, the pair could drop to £24,000 and then to the 50-day SMA at £20,197. Such a deeper correction will suggest the bullish momentum has weakened and the uptrend may not resume in a hurry.
BITCOIN PRICE GBP – HOW TO TRADE BTC/GBP 12TH JANUARY 2021
The Bitcoin price GBP pair features Bitcoin as well as UK’s fiat currency-GBP. As far as Bitcoin is concerned, it remains the leading crypto with nearly 50% market share. However, the crypto is highly volatile, and when it comes to trading the pair, much focus lies on the price movements of the cryptocurrency, which is much higher than that of GBP. Thus, traders who are interested in trading the BTC/GBP pair must first assess the fundamentals of BTC and how it compares with that of the Pound or GBP. In the past few years, GBP has witnessed increased volatility due to uncertainty created by Brexit. Additionally, the currency continues to remain strong due to its historically stable economic and political climate.
In this article, learn more about how Bitcoin Price, GBP price fluctuations affect the pair and how to trade BTC/GBP.
GBP AND BTC- PRIMARY DIFFERENCES
As far as GBP (also referred to as Pound or Sterling) is concerned, its value continues to rise and drop with respect to other traditional or fiat currencies due to macroeconomic factors like economic strength, rates of interest as well as other central bank-related monetary policies and sentiments about future developments. For instance, uncertainty related to Britain’s exit resulted in a massive decline in the pound’s value against its peers like EUR and USD. On the other hand, everything being equal, a hike in the interest rates only strengthens the Pound or GBP. Also, GBP’s volatility varies and is mostly low as well as against other traditional currencies, the same averages close to 0.6percent a day. On the other hand, BTC is highly volatile and records an average daily movement of more than 4%. But BTC is a cryptocurrency that doesn’t belong to any region or country. Thus, the geopolitical and economic factors that affect the price fluctuations of fiat currency have zero impact on Bitcoin. Also, since BTC and other cryptos are relatively new, and still trying to gain the trust of the public, its demand is based on market sentiments, as well as the rates of adoption in the future. For instance, mainstream exchanges that launched Bitcoin futures in 2017 were mainly responsible for driving the bubble or bull run that pushed Bitcoin’s price higher to nearly $20,000 from 1000 dollars earlier during the same year. Similarly, Bitcoin’s value tends to drop when negative information around security, like exchanges getting hacked or cryptos stolen, dampen sentiment.
TRADING BTC/GBP
The BTC/GBP pair is appealing for traders who hold pound denominated accounts. Given that BTC’s volatility is much higher when compared to GBP on a long-term and daily basis, traders looking to trade the pair must focus on the price movements of BTC. Crypto investors must stay abreast with the news related to BTC, such as hard forks. Also, the overall approach of mainstream finance to both crypto and regulation will be crucial for both long-term and intraday trading of BTC/GBP. When holding the pair for the long-term, crypto traders must learn to stay calm when volatility lasts for the short-term. Bitcoin usually drops or rises 10% or higher during a day, or even higher over the week.
CRYPTOCURRENCY TECHNICAL ANALYSIS – HOW TO TRADE BTC/GBP
We had projected a target objective of £31,399 in our previous analysis and Bitcoin rose to an intraday high at £30,936 on January 8. We had also mentioned that the RSI is in overbought levels and such markets can turn around quickly. We saw an example of that on January 11 when the BTC/USD pair plummeted below the 20-day EMA and fell to an intraday low at £21,000. The bulls aggressively purchased the lows, which is a positive sign as it shows strong demand at lower levels. If the bulls can build upon yesterday’s recovery, the pair may again gradually attempt to move up to £30,000. However, the possibility of the uptrend resuming is low. The higher levels are likely to attract selling by traders as many may want to book profits. If the pair fails to break out to new highs, the selling is likely to intensify and that could again pull the price back towards £20,000. The pair could remain range-bound for a few days before starting the next trending move. We do not find any reliable setups that offer an attractive trading opportunity.
BITCOIN PRICE GBP – HOW TO TRADE BTC/GBP 5TH JANUARY 2021
Bitcoin has been in a strong uptrend that pushed the RSI deep into overbought territory. This suggests that traders are buying at every higher level due to FOMO. While such a frenzied buying generates quick returns, it is also very risky as the rally can turn around quickly. A sample of that was seen on January 4 when the BTC/GBP pair plummeted to £19,500, a 23.66% correction in a day. As this was the first dip, traders purchased it aggressively, resulting in a strong rebound. This suggests that the uptrend remains intact.
However, the long wick on the January 3 candlestick and the long tail on the January 4 candlestick shows traders are booking profits at higher levels and buying on dips. This could keep the pair range-bound for a few days as the bulls and the bears try to dominate proceedings. If the bulls can push the price above £25,543.89, the up-move could resume with the next target objective at £31,399. Contrary to this assumption, if the bears sink the price below the 20-day EMA, a deeper correction to the 50-day SMA could be on the cards. There are no reliable trade setups at current levels. Hence, traders can wait for the consolidation to end and the trending move to begin before initiating fresh positions.
BITCOIN PRICE GBP NEWS – 05/01/2021
What a start to 2021, Bitcoin holds near all-time highs whilst Ethereum is still surging, market sentiment is very bullish even while profitmaking is ongoing. Top Bitcoin price News today covers reasons why profit taking is ongoing and a stark warning of a possible big dump!
KEY POINTS FOR BITCOIN PRICE GBP NEWS
Bitcoin on Monday experienced its worst slump since last March
Bitcoin traded below £22,136.07 before getting sustained at the level
Market prices jumped again after an announcement from the OCC
After a parabolic rally that went as high as £22,136.07 Bitcoin took a breather Monday to correct at around £21398.20. Analysts say this correction will be short-lived. Many analysts have pointed out the difference between the 2020 rally and the one from 2017. While 2017 was marked by frenzied retail investors hoping to cash out, 2020 saw increased participation from institutional investors.
EXTREME: BITCOIN WARNING AS CRYPTOCURRENCY SURGES
The world’s most popular cryptocurrency is surging in value, making investors rich overnight – but there’s something you need to know. As the world’s most popular cryptocurrency Bitcoin price surges past $32,000 for the first time, millions are asking whether they should jump on-board and invest. The digital coin has more than quadrupled in value since the start of 2020, with the currency’s total value now past $860 billion. Australian market analyst Kyle Rodda said Bitcoin’s latest surge is “knocking over record high after record high right now” but he brings the price surge down to “a high degree of mania”. He compares the recent uptick to the surge we saw in 2017 before it plummeted again in early 2019
HOW TO TRADE BTC/GBP?
The BTC/GBP pair features Bitcoin as well as UK’s fiat currency-GBP. As far as Bitcoin is concerned, it remains the leading crypto with nearly 50% market share. However, the crypto is highly volatile, and when it comes to trading the pair, much focus lies on the price movements of the cryptocurrency, which is much higher than that of GBP. Thus, traders who are interested in trading the BTC/GBP pair must first assess the fundamentals of BTC and how it compares with that of the Pound or GBP. In the past few years, GBP has witnessed increased volatility due to uncertainty created by Brexit. Additionally, the currency continues to remain strong due to its historically stable economic and political climate.
GBP AND BTC- PRIMARY DIFFERENCES
As far as GBP (also referred to as Pound or Sterling) is concerned, its value continues to rise and drop with respect to other traditional or fiat currencies due to macroeconomic factors like economic strength, rates of interest as well as other central bank-related monetary policies and sentiments about future developments. For instance, uncertainty related to Britain’s exit resulted in a massive decline in the pound’s value against its peers like EUR and USD. On the other hand, everything being equal, a hike in the interest rates only strengthens the Pound or GBP. Also, GBP’s volatility varies and is mostly low as well as against other traditional currencies, the same averages close to 0.6percent a day.
On the other hand, BTC is highly volatile and records an average daily movement of more than 4%. But BTC is a cryptocurrency that doesn’t belong to any region or country. Thus, the geopolitical and economic factors that affect the price fluctuations of fiat currency have zero impact on Bitcoin. Also, since BTC and other cryptos are relatively new, and still trying to gain the trust of the public, its demand is based on market sentiments, as well as the rates of adoption in the future. For instance, mainstream exchanges that launched Bitcoin futures in 2017 were mainly responsible for driving the bubble or bull run that pushed Bitcoin’s price higher to nearly $20,000 from 1000 dollars earlier during the same year. Similarly, Bitcoin’s value tends to drop when negative information around security, like exchanges getting hacked or cryptos stolen, dampen sentiment.
TRADING BTC/GBP
The BTC/GBP pair is appealing for traders who hold pound denominated accounts. Given that BTC’s volatility is much higher when compared to GBP on a long-term and daily basis, traders looking to trade the pair must focus on the price movements of BTC. Crypto investors must stay abreast with the news related to BTC, such as hard forks. Also, the overall approach of mainstream finance to both crypto and regulation will be crucial for both long-term and intraday trading of BTC/GBP.
When holding the pair for the long-term, crypto traders must learn to stay calm when volatility lasts for the short-term. Bitcoin usually drops or rises 10% or higher during a day, or even higher over the week.
Hopefully, you have enjoyed today’s article. Thanks for reading! Have a fantastic day! Live from the Platinum Crypto Trading Floor.
Earnings Disclaimer: The information you’ll find in this article is for educational purpose only. We make no promise or guarantee of income or earnings. You have to do some work, use your best judgement and perform due diligence before using the information in this article. Your success is still up to you. Nothing in this article is intended to be professional, legal, financial and/or accounting advice. Always seek competent advice from professionals in these matters. If you break the city or other local laws, we will not be held liable for any damages you incur.
#1CRYPTO TRADING MAGAZINE
CRYPTONAIRE WEEKLY
WEEKLY TOP TRADES, TOP PROJECTS AND MARKET UPDATES
By Clicking Submit, You agree to our terms and conditions


")