We had warned that if Ether broke below £2,653.66, the selling momentum could pick up and the decline could reach £2,258.36 and that is how it played out..
ETH TO GBP
Enter Amount
Base Currency
Convert To
1 ethereum
=
GBP
JANUARY BLOGS
ETH TO GBP – HOW TO TRADE ETHER GBP 11TH JANUARY 2022– UPDATED CONTENT
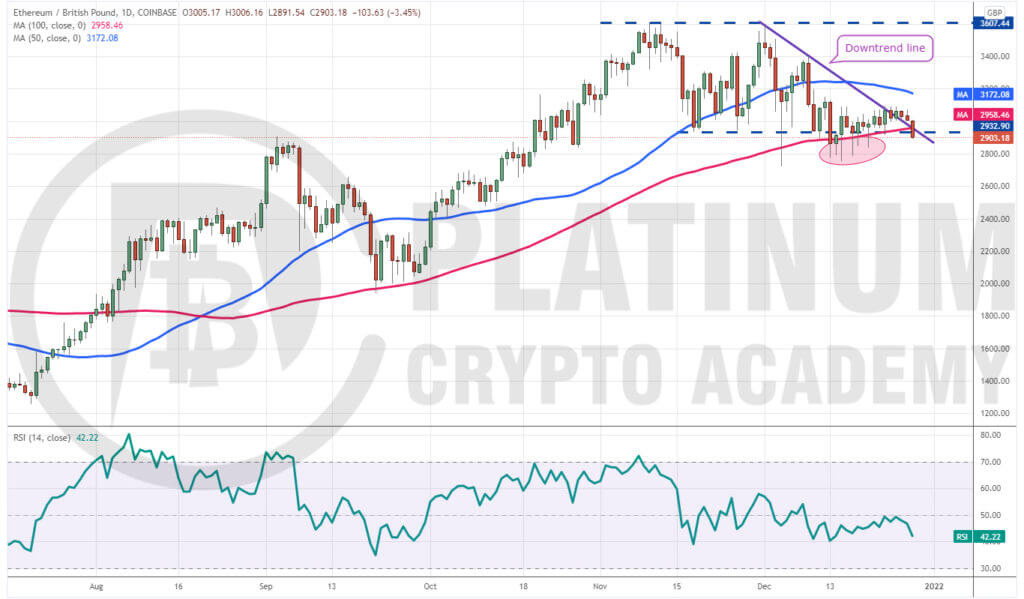
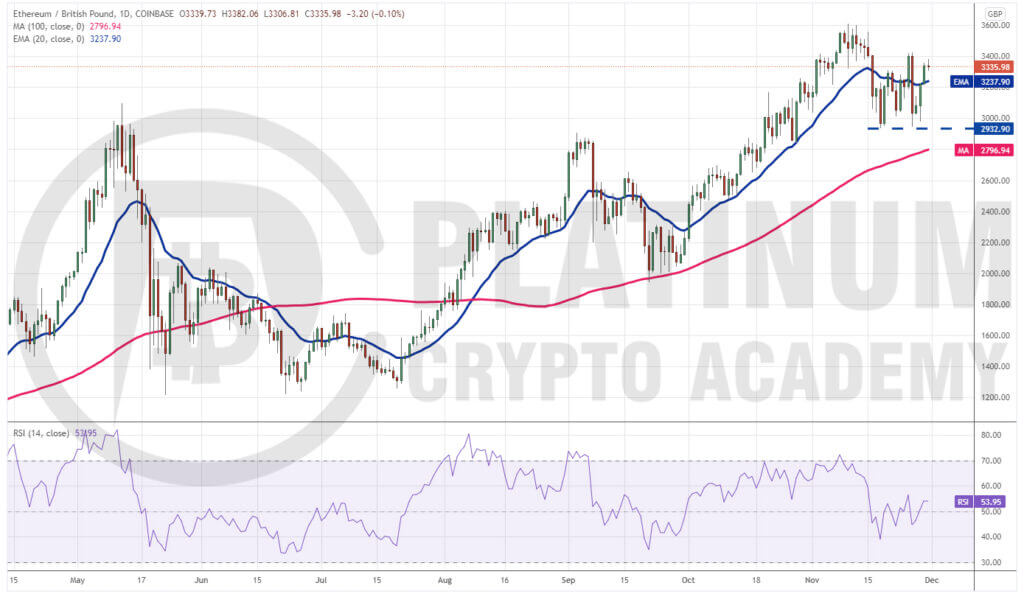
The bulls are attempting to defend £2,200 which could start a rebound that is likely to face resistance at the 200-day SMA. The downsloping 50-day SMA and the RSI in the oversold territory indicate that the path of least resistance is to the downside.
If the price turns down from the 200-day SMA, the bears will try to resume the downtrend by pulling the ETH/GBP pair below £2,200. If they succeed, the pair could plummet to psychological support at £2,000.
The bulls will have to push and sustain the price above the downtrend line to invalidate this bearish view.
ETH TO GBP – HOW TO TRADE ETHER GBP 4TH JANUARY 2022
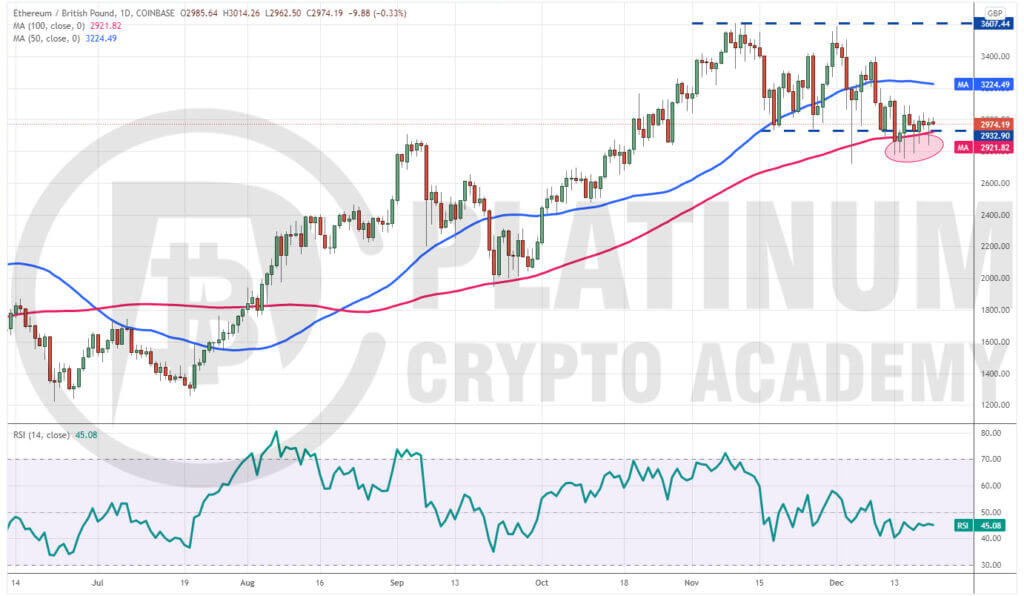
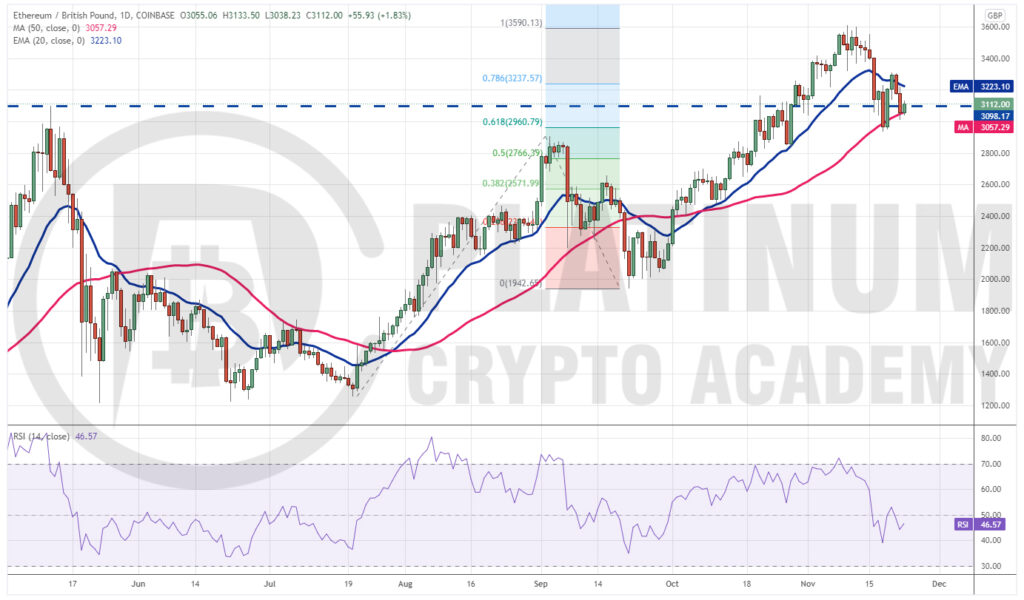
Ether broke below the December 4 intraday low of £2,721 on December 29. A minor positive is that bulls did not allow the bears to have their way and are attempting to push the price above the downtrend line.
If they succeed, the ETH/GBP pair could rise to the 50-day SMA. A break above this level will suggest that the corrective phase may be over. The pair could then start its journey to the all-time high at £3,607.44.
On the other hand, if the price turns down from the current level or the downtrend line and plummets below £2,653.66, the decline could extend to the 200-day SMA.
This is an important level for the bulls to defend because a break below it could intensify selling. The pair could first decline to £2,258.36 and then to £2,000.
DECEMBER BLOGS
ETH TO GBP – HOW TO TRADE ETHER GBP 28TH DECEMBER 2021
Ether bounced off the 100-day SMA but the bulls could not push and sustain the price above the downtrend line. This suggests that demand dries up at higher levels. The downsloping 50-day SMA and the RSI in the negative territory indicate that the path of least resistance is to the downside
The bears have pulled the price back below the downtrend line and the 100-day SMA today. If they can sustain the price below the support, the ETH/GBP pair could drop to the December 4 low at £2,721.
A break and close below this support could start a downtrend that has a target objective at £2,258.36.
This negative view will invalidate if the price turns up from the current level or the support at £2,721 and breaks above the 50-day SMA. Such a move could open the doors for a possible rally to £3,400 and then to the all-time high at £3,607.44.
ETH TO GBP – HOW TO TRADE ETHER GBP 21ST DECEMBER 2021
The bears have repeatedly pulled Ether below the 100-day SMA in the past few days but the long tail on the candlesticks suggests strong buying at lower levels.
However, a minor negative is that the bulls have not been able to build upon the bounce off the 100-day SMA. This suggests a lack of demand at higher levels.
The 50-day SMA has started to turn down gradually and the RSI is just below the midpoint, indicating that bears are making a comeback. A break and close below the 100-day SMA will be the first sign of the start of a deeper correction.
The ETH/GBP pair could then slump to £2,477.71 and if this level cracks, the next stop could be the critical level at £2,000.
Alternatively, if the price bounces off the current level and rises above the 50-day SMA, it will suggest that the selling pressure has reduced. That will open the gates for a possible rally to the all-time high at £3,607.44.
ETH TO GBP – HOW TO TRADE ETHER GBP 14TH DECEMBER 2021
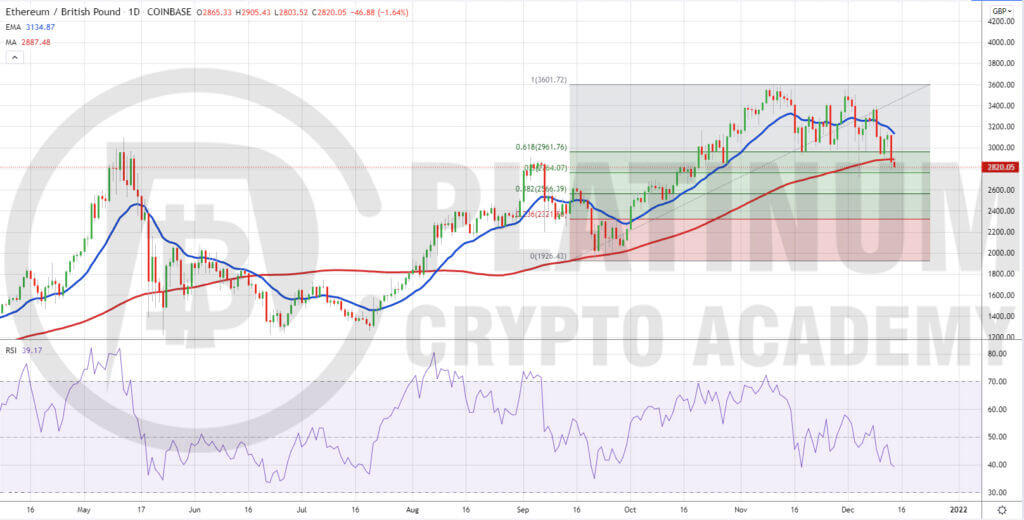
When price rejected the 50.0 Fib retracement on December 4 with that long Pinocchio Bar ( pin bar ), it looked as though the bulls were about to take control once more and continue the uptrend after a couple of weeks or so of sideways action, especially after price closed above the 20-day EMA on December 8.
However, the bears were clearly out in force and pushed price back below the 20-day EMA, and although it bounced off the 100-day SMA last Thursday on December 11, yesterday’s ( December 13 ) big sell off has price now firmly below that MA.
The relative strength index ( RSI ) is currently hovering around 40 mirroring the bearish price action on the chart.
A daily break and close above the 20-day EMA could prove to be the catalyst for a possible retest of £3,607.44, the high from November 10 which could paint a double top in the market.
The loss of the 100-day SMA support area none the less could see the bears gain full control as we end the year going into 2022.
ETH TO GBP – HOW TO TRADE ETHER GBP 7TH DECEMBER 2021
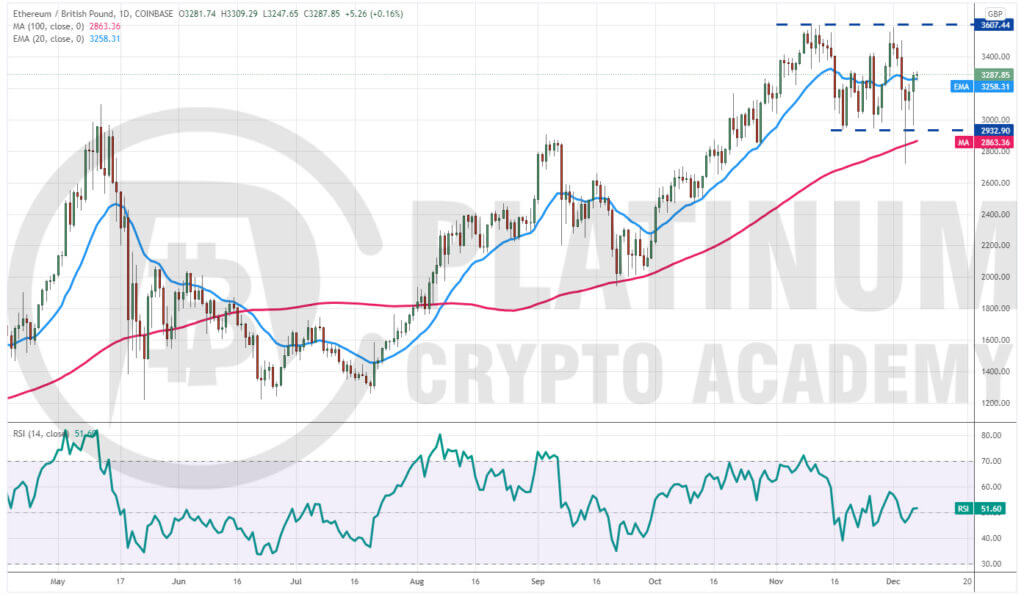
Ether is range-bound between £2,932.90 and £3,607.44. Although bears pulled the price below the support of the range and the 100-day SMA on December 4, they could not sustain the lower levels as seen from the long tail on the day’s candlestick.
The bears again tried to sink the price below the support of the range on December 6 but the long tail on the candlestick shows that bulls are defending the £2932.90 support with vigour.
The 20-day EMA has flattened out and the RSI is near the midpoint, indicating a balance between supply and demand. If the price sustains above the 20-day EMA, the ETH/GBP pair could rise to the resistance of the range.
A break and close above £3,607.44 could signal the resumption of the uptrend. The pair could then start its northward journey to £4,478.34.
The bears will have to sink and sustain the price below the support of the range to signal the start of a downtrend. The pair could then drop to £2,600.
NOVEMBER BLOGS
ETH TO GBP – HOW TO TRADE ETHER GBP 30TH NOVEMBER 2021
Ether bounced off the £2,932.90 support on November 26, indicating that bulls are defending this level aggressively. The bulls pushed the price above the 20-day EMA on November 29, signaling that the selling pressure may be reducing.
The 20-day EMA has started to turn up gradually and the relative strength index (RSI) has risen into the positive territory, indicating that bulls are attempting a comeback.
If buyers drive the price above £3,422.10, the ETH/GBP pair could pick up momentum and retest the all-time high at £3,607.44. A break and close above this level could suggest the resumption of the uptrend. The pair could then rally to the next target objective at £4,478.34.
Contrary to this assumption, if the price turns down from the overhead resistance and breaks below the 20-day EMA, it will indicate that traders are selling on rallies. The pair may then remain range-bound between £2,932.90 and £3,422.10.
ETH TO GBP – HOW TO TRADE ETHER GBP 23RD NOVEMBER 2021
Ether bounced off the 50-day SMA on November 19 and rose above the 20-day exponential moving average (EMA) on November 20. However, the bulls could not build upon this move.
The ETH/GBP pair turned down on November 21 and has again dropped to the 50-day SMA. If bears pull the price below this support and £2,932.90, the selling could accelerate. The pair could then drop to £2,600.
The downsloping 20-day EMA and the RSI just below the midpoint suggest a minor advantage to bears.
Alternatively, if the price rebounds off the current level, the bulls will make one more attempt to push the pair above the overhead resistance at £3,310.53. If they succeed, the pair could attempt to retest the all-time high at £3,607.44.
ETH TO GBP – HOW TO TRADE ETHER GBP 16TH NOVEMBER 2021
We had mentioned in our previous analysis that Ether’s rally could face stiff resistance at the 100% Fibonacci extension level at £3,590.13 and that is what happened.
The ETH/GBP pair rallied to £3,607.44 on November 10 but could not sustain the higher levels. The bulls again attempted to push the price above £3,600 but failed. This may have attracted selling by short-term traders.
The pair has broken below the 20-day EMA for the first time since October 1. This is a huge negative as it indicates that traders are rushing to the exit and supply exceeds demand.
If the pair sustains below the 20-day EMA for two days, the possibility of a drop to the 50-day SMA increases.
The bulls will have to push and sustain the price above £3,607.44 to negate the bearish view.
ETH TO GBP – HOW TO TRADE ETHER GBP 9TH NOVEMBER 2021
The failure of the bears to sustain Ether below the breakout level of £3098.17 attracted aggressive buying by the bulls. The momentum picked up on November 2 and the ETH/GBP pair has continued its journey northwards. The up-move could face resistance at the 100% Fibonacci extension level at £3,590.13. If the bulls arrest the subsequent pullback at the 20-day EMA, it will increase the prospects of the resumption of the uptrend.
A breakout and close above £3,590.13 will open the gates for a possible rally to 127.2% extension level at £4,038.24.
The critical level to watch on the downside is the 20-day EMA. If this support cracks, it will indicate that traders are rushing to the exit. The pair may then drop to the breakout level of £3,098.17.
The bears will have to pull and sustain the price below this support to signal the formation of a short-term top.
ETH TO GBP – HOW TO TRADE ETHER GBP 2ND NOVEMBER 2021
Ether skyrocketed to a new all-time high of £3,258.55 on October 29 but the bulls are struggling to sustain the higher levels. This suggests that traders are booking profits on every rise. However, a minor positive is that bulls have not allowed the price to stay below £3,098.17. The long tail on the candlesticks of the past two days shows that traders are buying on dips.
The rising 20-day EMA and the RSI in the positive zone indicate that bulls are in control. If bulls push the price above £3,258.55, the ETH/GBP pair could resume its uptrend with the next target objective at £3,472.
The short-term view will tilt in favour of the bears if the pair breaks and closes below the 20-day EMA. Such a move will indicate that traders are rushing to the exit. The pair could then drop to the 50-day SMA.
OCTOBER BLOGS
ETH TO GBP – HOW TO TRADE ETHER GBP 26TH OCTOBER 2021
This is an important zone for the bulls to overcome because if they do, the bullish momentum could pick up and the pair could rally to £3,350. The rising 20-day EMA and the RSI in the positive zone indicate that bulls have the upper hand.
The bears will have to pull the price below the neckline of the inverse head and shoulders (H&S) pattern to indicate the start of a deeper correction. The trend could turn in favour of the bears if the support at £2,400 cracks.
ETH TO GBP – HOW TO TRADE ETHER GBP 19TH OCTOBER 2021
Ethereum price gbp broke above the neckline on October 14, completing a bullish inverse head and shoulders pattern. However, as we had projected in our previous analysis, the bears aggressively defended the overhead resistance at £2,905.65 and have pulled the price back to the neckline.
A minor positive is that bulls have held the neckline on a closing basis. The rising moving averages and the RSI above 61, suggest that bulls have the upper hand. If bulls drive the price above £2,905.65, the ETH/GBP pair could retest the all-time high at £3,098.17. A break and close above this resistance could open the doors for a rally to the pattern target of £3,350. Alternatively, if the price turns down from the current level or the overhead resistance and plummets below the moving averages, it will suggest the start of a deeper correction to £2,312 and later to £2,000.
ETH TO GBP – HOW TO TRADE ETHER GBP 12TH OCTOBER 2021
Ether is facing stiff resistance near the overhead barrier at £2,700 but a minor positive is that bulls have not allowed the price to break and close below the 20-day EMA. This suggests that traders continue to buy on dips. The gradually rising 20-day EMA and the RSI in the positive zone indicate a minor advantage to buyers.
If bulls thrust and close the price above the neckline, the ETH/GBP pair will complete an inverted head and shoulders pattern. This bullish setup has a target objective at £3,350. However, the bears are unlikely to allow a linear rise as they will mount a stiff resistance at £2,905.65 and again at the all-time high at £3,098.17. Contrary to this assumption, if the price turns down and breaks below the moving averages, the pair could drop to £2,312 and eventually to £2,000.
ETH TO GBP – HOW TO TRADE ETHER GBP 5TH OCTOBER 2021
The tight range trading in Ether resolved to the upside on October 1 when bulls pushed and closed the price above the 20-day EMA. This was the first sign that the bears are losing their grip. The recovery is currently facing selling near £2,576.33 but the positive sign is that bulls are buying on dips as seen from the long tail on the October 4 candlestick. The 20-day EMA has turned up and the RSI has climbed into the positive territory indicating an advantage to bulls.
If buyers push the price above the £2,576.33 to £2,657 resistance zone, the bullish momentum could pick up. The ETH/GBP pair could then rise to the all-time high at £3,098.17. This positive view will invalidate if the price turns down and breaks below the 20-day EMA. The pair could then drift down to the support at £2,149.50.
SEPTEMBER BLOG
ETH TO GBP – HOW TO TRADE ETHER GBP 28TH SEPTEMBER 2021
Ethereum price GBP has been sandwiched between the 100-day SMA and the 20-day EMA for the past few days. This shows that bulls are buying on dips but demand dries up at higher levels and bears assert their dominance. The 20-day EMA is sloping down and the relative strength index (RSI) is in the negative territory indicating that the path of least resistance is to the downside.
A break and close below the 100-day SMA could result in aggressive selling, which could pull the price down to £1,759 and then to £1,663. A deep fall could drive away the dip buyers and may delay the resumption of the up-move. Contrary to this assumption, a breakout and close above the 20-day EMA will suggest that bulls have absorbed the selling by the bears. That could clear the path for a possible rally to £2,657. We would wait for the ETH/GBP pair to sustain above the 20-day EMA for three days before turning positive.
ETH TO GBP – HOW TO TRADE ETHER GBP 21ST SEPTEMBER 2021
We had expected Ether to pick up momentum after breaking above the overhead resistance at £2,587.26 but that did not happen. The ETH/GBP pair turned down from £2,657 on September 16, trapping the aggressive bulls. The bears pulled the price back below the 20-day EMA on September 17 and the selling intensified on a break below the 50-day simple moving average (SMA) on September 20.
The moving averages are on the verge of a bearish crossover and the RSI is in the negative territory, indicating advantage to bears. If the price sustains below the critical support at £2,149.50, the selling could further pick up momentum and start its downward journey toward £1,700. However, the long tail on today’s candlestick suggests strong buying at lower levels. The pair could now rise to the 20-day EMA where bears are likely to mount a stiff resistance. If the price turns down from the 20-day EMA, it will suggest that sentiment remains negative and that will increase the prospects of a further downside. The bulls will have to push and sustain the price above the 20-day EMA to indicate that the correction may be over.
ETH TO GBP – HOW TO TRADE ETHER GBP 14TH SEPTEMBER 2021
On Ether also we had warned of a possible correction or consolidation being signalled by the negative divergence on the RSI. That played out on September 7 when the price nosedived from £2,852.01 to £2,200. The long tail on the day’s candlestick shows that bulls bought the dip to the 50-day SMA. However, they could not push and sustain the price above the 20-day EMA, indicating a lack of demand at higher levels. https://youtu.be/I9sqnVlbXA4
The bears again tried to sink the ETH/GBP pair below the 50-day SMA on September 13 but failed. This makes the 50-day SMA an important level to watch on the downside. If bulls propel the price above the 20-day EMA and the £2,587.26 resistance, it will suggest that the correction could be over. The pair could then rally to the £2,900 to £3,098.17 overhead zone. On the other hand, if bears sink the price below £2,200, the pair could witness panic selling and may drop to £1,900.
ETH TO GBP – HOW TO TRADE ETHER GBP 7TH SEPTEMBER 202
Ether rebounded off the 20-day EMA on August 31 and soared above the overhead resistance zone at £2,400 to £2,466. This signalled the resumption of the uptrend. The upsloping moving averages indicate advantage to the bears but the negative divergence on the RSI warns of a possible correction or consolidation. The ETH/GBP pair is facing resistance in the £2,900 to £3,098.17 overhead zone. https://youtu.be/cJHhiw3OPJM
However, the bulls have not given up much ground in the past three days, suggesting that traders are not rushing to the exit. The pair is likely to find strong support at £2,682.43 and then again at the 20-day EMA. A strong rebound off either level will suggest that bulls are accumulating on dips. That will increase the possibility of a retest of the all-time high. Alternatively, a break and close below the 20-day EMA will be the first sign that bulls are tiring out.
AUGUST BLOGS
ETH TO GBP – HOW TO TRADE ETHER GBP 31ST AUGUST 2021
The bulls pushed Ether above the overhead resistance of £2,400 on August 23 but could not sustain the breakout. The bears pulled the price back below £2,400 on August 24. This suggests a lack of aggressive buying at higher levels.
Although the price rebounded off the 20-day EMA on August 27, the bears have continued to pose a stiff challenge at £2,400
https://www.youtube.com/watch?v=4NHD4-ZaWms
The RSI has dipped below 58, indicating that the bullish momentum is weakening.
If bears sink the price below the 20-day EMA, the ETH/GBP pair could drop to the breakout level of £2,160. A strong rebound off this level could keep the pair range-bound between £2,160 and £2,400 for a few days.
A break and close below £2,160 could result in a decline to the 50-day SMA while a break above £2,500 may signal the resumption of the uptrend.
ETH to GBP – HOW TO TRADE ETher GBP 24TH AUGUST 2021
Etherum price GBP, we had mentioned in our earlier analysis that £2,400 may act as a resistance and that is what happened. Ether GBP has been struggling to break out and sustain above this resistance for the past few days.
But a positive sign is that the eth to gbp bulls have not allowed the price to break below the breakout level at £2,160. With both moving averages sloping up and the relative strength index (RSI) in the positive territory, the advantage is with the buyers.
If ethereum to gbp bulls push the price above £2,500, the ETH/GBP pair could start its journey toward the next target objective of $3,000.
If the price turns down from the current level, the pair could drop to the 20-day EMA. A strong bounce off this support will suggest that ethereum to gbp bulls are buying the dips aggressively. That will enhance the prospects of the resumption of the uptrend.
A break and close below the 20-day EMA will be the first sign that the bullish momentum could be weakening. Traders who bought on our earlier recommendation may trail their stops just below the 20-day EMA.
ETH to GBP – HOW TO TRADE ETher GBP 10TH AUGUST 2021
In our previous analysis, we had recommended traders buy on a strong rebound off the 20-day EMA. The price did not drop to the 20-day EMA but came close to it on August 4. Traders who bought this bounce would have made quick gains.
Partial profits can be booked at the current levels and the stops can be trailed on the rest to protect the paper profits.
The bulls pushed the price above the overhead resistance of £2,160 on August 7, suggesting the resumption of the uptrend. However, the bears have other plans. They are attempting to stall the up-move and pull the price back below £2,160.
If the price turns down from the current level and breaks below £2,160, a drop to the 20-day EMA is possible. This is an important level to watch out for because if the pair rebounds off it, the bulls will again try to resume the up-move.
There is a minor resistance at £2,400 but if this level is crossed, the ETH/GBP pair could commence its journey to £3,000. Contrary to this assumption, if bears pull the price below the 20-day EMA, the pair could drop to the 50-day SMA.
ETH to GBP – HOW TO TRADE ETher GBP 3RD AUGUST 2021
Ethereum price gbp we had mentioned in our previous analysis that Ether may rise to the psychological level at £2,000 and that is what happened. The biggest altcoin rose to £1,938 on August 1.
The ETH/GBP pair formed an inside-day candlestick pattern on August 2, indicating indecision among the bulls and the bears. If bears sink the price below £1,800, the pair could drop to the 20-day EMA.
A strong rebound off the 20-day EMA will suggest that the sentiment has turned positive and traders are buying on dips. The bulls will then again try to push the ether gbp price above the overhead resistance at £2,000. If they succeed, the pair could rise to £2,160 and then £2,400.
Contrary to this assumption, if the ether gbp price turns down and slides below the 20-day EMA, the pair could retest the 50-day simple moving average (SMA). A break below this support could strengthen the bears who will then try to pull the price to £1,400.
Traders may attempt to buy on a strong rebound off the 20-day EMA and keep the stops below the 50-day SMA.
JULY BLOGS
ETH TO GBP – HOW TO TRADE ETHER GBP 27TH JULY 2021
Ethereum price gbp bulls aggressively purchased the dip to the strong support at £1,216.19 on July 21. Strong buying propelled the ethereum to gbp price above the downtrend line of the descending triangle pattern on July 26 but the long wick on the day’s candlestick shows selling by the bears at higher levels.
Ethereum TECHNICAL ANALYSIS – HOW TO TRADE ETH/GBP
The bears will now try to pull the eth to gbp price back below the moving averages. If they manage to do that, the ETH/GBP pair could drop to £1,400 and if this support also cracks, the decline may extend to the critical support at £1,216.19.
However, the 20-day exponential moving average has started to turn up and the relative strength index has risen into the positive territory, indicating advantage to buyers.
If the ether gbp price rebounds off the 20-day EMA, the bulls will try to resume the relief rally. A breakout above £1,800 could clear the path for a rally to the psychological level at £2,000. This may give a short-term buying opportunity to traders.
ETH TO GBP – HOW TO TRADE ETHER GBP 20TH JULY 2021
Ethereum price GBP our assumption of a decline to £1,216.19 in Ether, as enumerated in the previous analysis, has also played out. If the bearish momentum pulls the eth to gbp price below £1,216.19, the descending triangle pattern will complete.
This bearish setup could attract further selling and the ETH/GBP pair may slide down to psychological support at £1,000. If this support also cracks, the decline could extend to £800.
ETHEREUM TECHNICAL ANALYSIS – HOW TO TRADE ETH/GBP
The downsloping moving averages and the RSI below 35 suggest that bears are in command. Even if the ethereum to eth/gbp price rebounds off £1,216.19, the bulls will have to push the price above the downtrend line to signal a trend change.
If that does not happen, the bears will again try to sink the eth/gbp pair below £1,216.19. As the trend is down, we suggest traders avoid catching a falling knife. It is prudent to wait for a bottom to be confirmed before initiating a fresh long position.
ETH to GBP – HOW TO TRADE ETher GBP 13TH JULY 2021
The bears pulled Ether below the 20-day EMA on July 8 and have been defending the resistance since then. The failure to rise above the 20-day EMA may have attracted selling from short-term traders.
If the price breaks and sustains below £1,468.55, the ETH/GBP pair could slide to the next critical support at £1,216.19. The 20-day EMA has started to turn down and the RSI has dipped into the negative zone, indicating the path of least resistance is to the downside.
ETHEREUM TECHNICAL ANALYSIS – HOW TO TRADE ETH/GBP
The £1,216.19 level is an important support to watch out for because if it cracks, the bearish descending triangle pattern will complete. This could result in long liquidation, pulling the price down to £1,000 and later to £800.
To negate this possibility, the bulls will have to push and sustain the price above the downtrend line. If that happens, the aggressive bears who have gone short in anticipation of a breakdown may be forced to cover. That could propel the pair to £2,160.
ETH to GBP – HOW TO TRADE ETher GBP 6TH JULY 2021
Ethereum price gbp broke above the 20-day EMA but turned down from the 50-day SMA as we had projected in the previous analysis. The 20-day EMA is flat and the RSI is near the midpoint, suggesting a balance between supply and demand.
If the eth price gbp rebounds off the current level or from £1,468.55, the bulls will make one more attempt to push the ETH/GBP pair above the downtrend line. If they manage to do that, the bearish descending triangle setup will be negated and the pair could rally to £2,160.
ETHEREUM TECHNICAL ANALYSIS – HOW TO TRADE ETH/GBP
Contrary to this assumption, if bears sink the ether gbp price below £1,468.55, the pair could decline to £1,216.19. This is an important support to watch out for because if the price closes below it, the descending triangle pattern will complete.
That could result in panic selling and the ethereum price pounds pair may drop to £1,000 and then to £800. Traders may consider buying on a breakout and close above the downtrend line with the stops kept below the 20-day EMA.
JUNE BLOGS
ETH TO GBP – HOW TO TRADE ETHER GBP 29TH JUNE 2021
Ether bounced off the £1,216.19 support on June 22 and again on June 26. This suggests that the bulls are aggressively defending this support. Hence, on the way down, this becomes an important level to watch out for.
The relief rally of the past three days has reached the 20-day EMA where the bulls are facing resistance. However, the 20-day EMA is flattening out and the RSI has risen above 45, indicating that bulls are trying to form a bottom.
ETHEREUM TECHNICAL ANALYSIS – HOW TO TRADE ETH/GBP
If buyers propel the price above the 20-day EMA, the ETH/GBP pair could rise to the downtrend line. The 50-day SMA is close to the downtrend line, hence the bears may defend this level aggressively.
If the price turns down from the downtrend line but does not break below the 20-day EMA, it will indicate that the sentiment has turned positive and traders are buying on dips.
Conversely, if the price turns down from the current level, the bears will try to reassert their supremacy by pulling the price below £1,216.19. If they succeed, the pair may plummet to the psychological support at £1,000.
ETH to GBP – HOW TO TRADE ETher GBP 22ND JUNE 2021
Ethereum price GBP rebound off the support line of the triangle on June 12 fizzled out at the 20-day EMA on June 15. This suggests that the sentiment is bearish and traders are selling on rallies.
The bears pulled the eth to gbp price below the triangle on June 18 and the attempt by the bulls to push the ether gbp price back into the triangle failed on June 20. This attracted further selling on June 21, resulting in a sharp drop.
ETHEREUM TECHNICAL ANALYSIS – HOW TO TRADE ETH/GBP
The downsloping 20-day EMA and the RSI in the negative territory indicate advantage to the bears. If the bulls fail to push the eth price gbp back above the 20-day EMA within the next few days, the selling could intensify.
If bears sink the eth price gbp below £1,216.19, the ETH/GBP pair could drop to £1,000 and then to the pattern target of £871.74.
This bearish view will be invalidated if the price turns up and breaks above the 20-day EMA. We will wait for the pair to show strength before recommending a trade in it.
ETH to GBP – HOW TO TRADE ETher GBP 15TH JUNE 2021
Ethereum price GBP dipped below the support line of the triangle on June 12 but the bears could not capitalize on this breakdown. The ether gbp price rebounded off the support line and has reached the 20-day EMA. This suggests that bulls are buying on dips.
If buyers propel the eth to gbp price above the resistance line of the symmetrical triangle, it will suggest that the uncertainty has resolved in favour of the bulls. The pattern target of this breakout is £2,736.22.
ETHEREUM TECHNICAL ANALYSIS – HOW TO TRADE ETH/GBP
Therefore, we retain the buy recommendation given in the previous analysis.
Contrary to this assumption, if the eth price gbp price turns down from the resistance line, the ETH/GBP pair could extend its stay inside the triangle.
The trend will turn in favour of the bears if the pair turns down and plummets below the support line of the triangle. That could drag the price down to £1,474.60 and then to £1,216.19.
ETH to GBP – HOW TO TRADE ETher GBP 8TH JUNE 2021
Ethereum price GBP we had recommended traders to buy on a breakout and close above the 50-day simple moving average (SMA) but the trade did not trigger. ETH price GBP turned down from just below the 50-day SMA on June 4.
The bulls again tried to push the price above the 20-day EMA on June 5 and 7 but the long wick on the day’s candlestick suggests selling at higher levels. The bears will now try to sink the price below the support line of the triangle.
ETHEREUM TECHNICAL ANALYSIS – HOW TO TRADE ETH/GBP
If they succeed, the Ether GBP pair could drop to £1,474.60 and then to the May 23 low of £1,216.19. Conversely, if the eth price gbp rebounds off the support line of the triangle, it will suggest accumulation on dips.
A breakout and close above the triangle will suggest the downtrend could be over. Therefore, traders may buy on a breakout and close above the resistance line of the triangle.
ETH to GBP – HOW TO TRADE ETher GBP 1ST JUNE 2021
Ethereum price GBP broke above the 38.2% Fibonacci retracement level of £1,935.11 on May 26 but the bulls could not push the price above the 20-day EMA. However, the positive sign is that bulls continue to buy at higher levels. This has resulted in the formation of a symmetrical triangle pattern.
If buyers can propel the price above the triangle and the 50-day SMA, it will suggest the end of the downtrend. The ETH/GBP pair could then rally to the 61.8% retracement level at £2,379.25.
ETHEREUM TECHNICAL ANALYSIS – HOW TO TRADE ETH/GBP
This level may act as a stiff resistance but if the bulls do not allow the price to dip below the 20-day EMA, the pair could rise further to £2,695.43.
The 20-day EMA is flattening out and the RSI has risen above 47, indicating the bulls are trying to make a comeback. Traders may buy 50% of the usual allocation size on a breakout and close above the 50-day SMA.
This is a risky trade as the trend has not yet turned positive. Hence, risk-averse traders may wait for a better entry opportunity. The stop-loss for the trade can be kept below the support line of the triangle.
MAY BLOGS
ETH TO GBP – HOW TO TRADE ETHER GBP 25TH MAY 2021
Ethereum price GBP bulls failed to sustain Ether above the 20-day EMA on May 18 could have attracted profit-booking by traders, resulting in the massive drop on May 19. The Ethereum to GBP bulls tried to stage a recovery on May 20 but hit a wall at the 50-day SMA.
Renewed selling pulled the price below the May 19 low of £1,382.24 but the positive sign is that this did not lead to panic selling among investors. The long tail on the May 23 candlestick suggests traders purchased the drop to £1,216.19.
ETHEREUM TECHNICAL ANALYSIS – HOW TO TRADE ETH/GBP
The strong recovery on May 20 indicates demand at lower levels. However, the bulls are likely to face stiff resistance at the moving averages. If the eth to gbp price turns down from this resistance, the bears will again try to break the £1,216.19 support. If the Eth price GBP pair rebounds off this support, a few days of range-bound action between £1,216.19 and £2,000 is possible. Traders may wait for the price to rebound off the £1,216.19 support to initiate long positions with the stops placed at £1,190. This trade should not be attempted when the price is falling because if the bears sink the pair below £1,216.19, the decline could extend to £1,000.
ETH to GBP – HOW TO TRADE ETher GBP 18TH MAY 2021
Ethereum price GBP we had pointed out in our previous analysis that Ether may be topping out and our assumption was proven right. Although the biggest altcoin rose above £3,000 on May 12, aggressive profit-booking dragged the price lower, forming a bearish engulfing pattern. The bulls again tried to resume the uptrend on May 14 but the up-move fizzled out at £2,965.68. The selling resumed on May 15 and pulled the eth price gbp pair below the 20-day EMA on May 17.
ETHEREUM TECHNICAL ANALYSIS – HOW TO TRADE ETH/GBP
The 20-day EMA has flattened out and the RSI is near the midpoint, signaling a possible consolidation in the near term. This neutral view will invalidate if the price turns down and breaks below £2,200. If that happens, the pair may drop to the 50-day SMA. The farther the eth to gbp pair moves from the all-time high, the longer and harder it will become to resume the uptrend. We will wait for a bullish setup to form in the next few days before recommending a trade in it.
ETHEREUM TO GBP – HOW TO TRADE ETHER GBP 11TH MAY 2021
Ethereum price GBP made a new all-time high of £2,984.73 on May 10 but the bulls could not sustain the higher levels. The Doji candlestick pattern on the day suggests the rally may be tiring out. If the bears pull the price below £2,560.80, the ETH/GBP pair could drop to the 20-day EMA. If the price rebounds off the 20-day EMA, it will suggest the sentiment remains bullish and traders are buying on dips to strong support levels.
ETHEREUM TECHNICAL ANALYSIS – HOW TO TRADE ETH/GBP
The bulls will then attempt to resume the uptrend. A breakout and close above £3,000 could start the next leg of the uptrend that may reach £3,727.86. However, we give this a low probability of occurring. If the Ethereum price GBP dips below the 20-day EMA, it will suggest that traders are closing their positions in a hurry. That could increase the possibility of a decline to the 50-day SMA. We do not find any reliable buy setups at the current level.
ETH to GBP – HOW TO TRADE ETher GBP 4TH MAY 2021
Ethereum price GBP surprised us with its sharp up-move in the past few days. Momentum traders who had bought on our recommendation in the previous analysis could be sitting on huge profits within a short time. However, vertical rallies rarely sustain and they are usually followed by waterfall declines. Therefore, without getting too greedy, traders may book profits at the current levels or tighten the stops to lock in a large part of their paper gains.
ETHEREUM TECHNICAL ANALYSIS – HOW TO TRADE ETHEREUM
The sharp up-move of the Ethereum price pound chart in the past few days had pushed the RSI above 82, indicating the rally was overbought in the short term. However, when an asset is backed by momentum, it is difficult to call a top. If the bulls do not give up much ground from the current levels, the uptrend may continue. If the buyers drive the price above £2,500, the ETH/GBP pair could start the next leg of the uptrend that may reach £3,120. Conversely, a break below £2,137.25 may attract strong selling. The critical support on the downside is the 20-day EMA and a decisive break below could signal the start of a deeper correction.
APRIL BLOGS
ETHEREUM GBP – HOW TO TRADE ETH/GBP 27TH APRIL 2021
Ethereum price GBP as we had projected that bulls will try to stall the decline between £1,456.18 and the trendline and that is what happened. The biggest altcoin rebounded off the £1,456.18 support on April 20. The momentum picked up and the bulls pushed the price to a new all-time high of £1,905.49 on April 22. However, the bulls could not sustain the breakout and the price slipped back below £1,850 on the same day.
ETHEREUM TECHNICAL ANALYSIS – HOW TO TRADE ETHEREUM
Both upsloping moving averages and the RSI in the positive territory suggest the bulls have the upper hand. If the buyers drive the price above the £1,850 to £1,905.49 resistance zone, the next leg of the uptrend could begin, which has a target objective at £2,130. However, we anticipate the bears to mount a stiff resistance in the overhead zone and try to pull the price down to the 20-day EMA. If the ETH/GBP pair rebounds off this support, the possibility of a break above £1,905.49 increases. On the other hand, if the bears sink the price below the 20-day EMA, the pair could drop to £1,456.18 and remain range-bound for a few days. The risk to reward ratio for a positional trade is not attractive at the current levels. Hence, we are not proposing any fresh trade in it. However, momentum traders may try to ride the move higher if the pair breaks and sustains above £1,905.49 for a few hours.
ETHEREUM TO GBP – HOW TO TRADE ETH/GBP 20TH APRIL 2021
We had projected a target of £1,872 for Ether and it rallied to £1,850 on April 16. Traders who had bought and sold on our recommendation made huge profits within a short time, both entering and exiting at the right time. Technical traders seem to have booked profits after Ether reached its target objective. Although aggressive bulls seem to have purchased the dip on April 18, they could not sustain the price above the 20-day EMA.
ETHEREUM TECHNICAL ANALYSIS – HOW TO TRADE ETHEREUM
This shows that traders are booking profits on rallies. The ETH/GBP pair has dropped to critical support at £1,456.18. If this support cracks, the next stop could be the trendline. The bulls will try to stall the decline between £1,456.18 and the trendline. The extent of the next rebound will give insight into how successful they have been. A weak rebound will indicate a lack of buyers and the bounce is likely to be sold into. If the trendline support gives way, the pair could extend its decline to £1,130. Conversely, a strong rebound off £1,456.18 could keep the pair range-bound for a few more days. The bulls will gain the upper hand on a break above £1,850. We do not find any reliable buy setups at the current level, hence we are not suggesting any trade in it.
ETH to GBP – HOW TO TRADE ETH/GBP 13TH APRIL 2021
ETHEREUM TECHNICAL ANALYSIS – HOW TO TRADE ETHEREUM
Ethereum price GBP plunged below £1,456.18 on April 7, but the bulls purchased the dip and the price rebounded on April 8. As the eth price gbp did not break below the 20-day EMA and also did not reach the breakout level of the triangle,the suggested stop-loss in the previous analysis may not have triggered. The ETH/GBP pair has continued to make new highs, but the up-move lacks momentum. This suggests hesitation among the bulls to buy aggressively at higher levels. If the momentum does not pick up within the next two days, it will increase the possibility of a correction. A break below £1,400 will be the first sign of weakness. The first stop on the downside could be the support line of the triangle. If this support cracks, the pair could extend the decline to £1,100. Conversely, if the pair picks up momentum, a rally to £1,872 is likely. Traders can watch the price action and book profits if the price does not rally above £1,600 in the next couple of days. Until then, the stops can be kept just below the 20-day EMA.
ETHEREUM TO GBP – HOW TO TRADE GBP TO ETH 6TH APRIL 2021
Ethereum price gbp broke above the resistance line of the symmetrical triangle on March 31 and this triggered the buy recommendation given in the previous analysis. Traders who bought ether gbp on the suggestion are already profitable. The ethereum to gbp bulls continued their buying and propelled the eth price gbp to a new all-time high of £1,549.98 on April 2.
ETHEREUM TECHNICAL ANALYSIS – HOW TO TRADE ETHEREUM
The ethereum price pounds pair has been consolidating between £1,456.18 and £1,549.98 for the past three days. This shows that the bulls have flipped the previous resistance into support. If the bulls can push the Ethereum price gbp above £1,549.98, the next leg of the up-move could begin. This could carry the pair to £1,872, which is the pattern target of the breakout from the triangle. The rising 20-day EMA and the RSI in the positive territory suggest the bulls are in command. This positive view will invalidate if the price turns down from the current level and breaks below the 20-day EMA. Such a move will suggest aggressive selling at higher levels. That could then result in a fall to the support line of the triangle. Therefore, traders who have purchased on a break above the triangle can keep their stops at breakeven. This could be trailed higher if the ether gbp rises above £1,549.98. Traders who added their positions above £1,456.18 can keep the stops just below the 20-day EMA.
MARCH BLOGS
ETH TO GBP – HOW TO TRADE GBP TO ETH 30TH MARCH 2021
Ethereum price GBP has formed a symmetrical triangle, which generally acts as a continuation pattern and the breakout happens in the direction of the prevailing trend before the pattern was formed. In this case, as the trend was up before the formation of the pattern, we can expect the breakout on the upside. If that happens, the ETH price gbp could retest the all-time high at £1,456.18. A breakout and close above this resistance could result in a rally to the pattern target of £1,872.
ETHEREUM TECHNICAL ANALYSIS – HOW TO TRADE ETH/GBP
The flat moving averages and the RSI above 56 do not indicate a strong momentum in favour of the bulls. If the Ethereum price GBP turns down from the resistance line of the triangle, the pair may spend some more time inside the triangle. At times, the symmetrical triangle acts as a reversal pattern. Therefore, traders should wait for the price to either breakdown or break above the triangle before placing any positional trades. Aggressive traders may buy on a breakout and close above the triangle, but use 50% of the usual position size. The rest of the position could be added after the price breaks above £1,456.18.
ETHEREUM GBP – HOW TO TRADE ETH/GBP 23RD MARCH 2021
Ethereum price GBP bulls held on to the 20-day EMA for the most part of last week, but Ether failed to rebound with strength, indicating a lack of follow-up buying at higher levels. The failure to move up could have attracted profit-booking from short-term traders.
ETHEREUM TECHNICAL ANALYSIS – HOW TO TRADE ETH/GBP
That dragged the Ethereum Price GBP below the 50-day SMA on March 22. If the bulls do not push the Ethereum Price GBP back above the moving averages quickly, the slide may continue and the ETH/GBP pair could drop to £1,100 and then £932.54. The 20-day EMA has started to turn down and the RSI has dipped into the negative territory, suggesting that the bears are attempting to gain the upper hand. This bearish view will invalidate if the pair turns up and breaks out of the all-time high. As the trend is turning in favour of the bears, we suggest traders wait for the decline to end and the Ethereum Price GBP to signal a bottom before jumping in to buy.
ETH GBP – HOW TO TRADE GBP TO ETH 16TH MARCH 2021
We were expecting Ethereum price GBP to reach its all-time high at £1,456.18, but the bears had other plans. They stalled the rally at £1,391.98 on March 13. The price has again dipped back to the moving averages. The bulls will now try to defend the moving averages and if they succeed, the Ethereum price GBP pair may make one more attempt to rise above the all-time high. If they manage to do that, the pair could rally to £1,767.7 and then £1,968.87.
ETHEREUM TECHNICAL ANALYSIS – HOW TO TRADE ETH/GBP
However, the flattening 20-day EMA and the RSI near the midpoint suggest the bulls are losing their grip. If the bears can sink the Ethereum price GBP below the 50-day SMA, the decline could extend to £1,100 and then £932.54. A strong bounce off the support levels could keep the Ethereum price GBP range-bound for a few days. We do not find any reliable buy setups, hence we are not recommending any trade in it.
ETHEREUM GBP – HOW TO TRADE ETH/GBP 9TH MARCH 2021
Ethereum price GBP had a relief rally was setting up in Ether and that is how it has played out. After hesitating near the 20-day EMA between March 2 to 5, the bulls made a decisive breakout on March 6. The momentum picked up after the bulls sustained the price above the 20-day EMA. Now, the ETH/GBP pair could rally to the all-time high at £1,456.18. If the bulls can drive the price above this resistance, the next leg of the up-move could begin. The next target objective on the upside is £1,767.7 and then £1,968.87.
ETHEREUM TECHNICAL ANALYSIS – HOW TO TRADE ETH/GBP
On the other hand, if the bears defend the £1,456.18 level, the Ethereum price GBP may consolidate for a few days and dip to the 20-day EMA. However, the 20-day EMA has turned up and the RSI is above 61, indicating the path of least resistance is to the upside. This bullish view will invalidate if the Ethereum price GBP turns down and slips below the moving averages. Such a move will point to a few days of range-bound action. The bears will gain the upper hand if the price slips below £932.54.
ETH TO GBP – HOW TO TRADE GBP TO ETH 2ND MARCH 2021
The Ethereum price GBP dropped to £932.54 on February 28, very close to our expected level of £900, as mentioned in the previous analysis. The long tail on the day’s candlestick suggests traders bought the dip aggressively. The bulls are currently attempting to propel the price above the moving averages. If they can push and sustain the price above the 20-day EMA, it will suggest the short-term decline may be over.
ETHEREUM TECHNICAL ANALYSIS – HOW TO TRADE ETH/GBP
The bears may again mount a stiff resistance near £1,214, but if the bulls can clear this hurdle, the Ethereum price GBP may start its journey towards the all-time high at £1,456.18. However, the flat moving averages and the RSI just below the midpoint suggest a balance between supply and demand. If the Ethereum price GBP turns down from the current levels or £1,214, the pair may remain range-bound for a few days. The pair will get ready for a deeper decline if the bears can sink the price below the £900 support. Although a relief rally is possible, we do not find any reliable buy setups, hence we are not suggesting a trade in it.
FEBRUARY BLOGS
ETHEREUM GBP – HOW TO TRADE ETH/GBP 23RD FEBRUARY 2021
The Ethereum price GBP rallied to a new all-time high at £1,456.18 on February 20, which was just short of our target objective at £1,500. Momentum traders who had purchased as suggested in our previous analysis could have made a small profit or may have closed the position at breakeven. The Doji candlestick pattern on February 20 was followed by an inside day candlestick pattern on February 21. Both these candlestick patterns indicate indecision among the bulls and the bears.
ETHEREUM TECHNICAL ANALYSIS – HOW TO TRADE ETH/GBP
This uncertainty was resolved to the downside on February 22 and that resulted in aggressive profit-booking from traders. The Etherereum price GBP plummeted below the 20-day EMA and fell near the 50-day SMA. The bulls purchased the dip to the 50-day SMA and pushed the Etherereum price GBP back above the 20-day EMA as seen from the long tail on the candlestick. However, the failure of the bulls to build-up on the pullback today suggests the bears continue to sell on rallies. The bears will again try to sink the price below the 50-day SMA and the £1,052 support. If they succeed, a deeper decline to £900 and then to £800 is possible. On the contrary, if the bulls again successfully defend the 50-day SMA, it will suggest accumulation at lower levels. In such a case, the bulls will again try to resume the uptrend by pushing the price to a new all-time high. We do not find any reliable buy setups at the current level, hence we suggest traders remain on the sidelines.
ETHEREUM GBP – HOW TO TRADE ETH/GBP 16TH FEBRUARY 2021
Ethereum Price GBP hit our target objective of £1,352 on February 13 and that could have allowed traders to book profits. The price corrected to the 20-day EMA on February 15, but the sharp rebound off this level suggests the bulls are buying on dips. The upsloping moving averages and the RSI in the positive territory suggest the bulls are in command. If the bulls can drive the price above £1,354.01, the uptrend may resume and rally to the next target objective at £1,500.
ETHEREUM TECHNICAL ANALYSIS – HOW TO TRADE ETH/GBP
Contrary to this assumption, if the price turns down from the overhead resistance and breaks below the 20-day EMA, the Ethereum Price GBP could drop to the breakout level at £1,052. A strong rebound off this support will suggest that the sentiment remains positive and the bulls are buying on dips. Conversely, if the Ethereum Price GBP breaks and sustains below this support, it will suggest a possible change in trend. A short-term buying opportunity may arise for the momentum traders if the price sustains above £1,354.01 for a few hours.
ETHEREUM GBP – HOW TO TRADE ETH/GBP 9TH FEBRUARY 2021
Ethereum price GBP traders who had purchased on the breakout of the ascending triangle on February 2, according to our recommendation in the previous analysis are in the money. The bears pulled the price down to the breakout level at £1,052 on February 7 but the long tail on the day’s candlestick showed aggressive buying by the bulls. The bulls are currently facing resistance near £1,300.
ETHEREUM TECHNICAL ANALYSIS – HOW TO TRADE ETH/GBP
the buyers can drive the Ethereum price GBP above £1,300, the ETH/GBP pair could rally to the pattern target at £1,352. If this level is also crossed, the uptrend could extend to £1,500. Traders can consider booking partial profits at the current levels and trail the remaining position with a suitable stop-loss. As the Ethereum price GBP moves up, the stops can be trailed higher to protect the paper profits.
ETHEREUM GBP – HOW TO TRADE ETH/GBP 2ND FEBRUARY 2021
Ethererum price GBP is facing resistance near £1,052 and buying near the 20-day EMA. This suggests the bulls are not ready to let go of their advantage. The rising moving averages and the RSI in the positive territory suggest the bulls are in control.
ETHEREUM TECHNICAL ANALYSIS – HOW TO TRADE ETH/GBP
A tight consolidation near an overhead resistance usually results in a breakout above it. If the bulls can propel the Ethererum price GBP above the £1,051 to £1,076.99 resistance zone, the uptrend will resume, which has a target objective at £1,352. Traders can buy on a breakout and close (UTC time) above £1,052, with the stop-loss kept just below the 20-day EMA. Contrary to this assumption, if the Ethererum price GBP turns down from the overhead resistance, the ETH/GBP pair could continue to trade in a tight range between £1,052 and the 20-day EMA. The pair will turn negative if the bears sink and sustain the price below the 20-day EMA. Such a move will suggest that traders used the current consolidation to sell their long positions. The critical support to watch on the downside is £750.
JANUARY BLOGS
ETHEREUM GBP – HOW TO TRADE ETH/GBP 26TH JANUARY 2021
The Ethereum price GBP rose to a new all-time high at £1,059.82 on January 19, which could have triggered the short-term trade mentioned in the previous analysis. However, the bulls could not build upon this strength. Traders who trailed their stops could have stopped out with a small loss on January 21 as the ETH/GBP pair plunged below the 20-day EMA.
ETHEREUM TECHNICAL ANALYSIS – HOW TO TRADE ETH/GBP
The Ethereum price GBP fell on January 22 again gave an opportunity to the traders to go long as the intraday low of £755.03 was near the £720 level where we had suggested traders buy again. The pair rebounded sharply and again rose to a new all-time high at £1,076.99 on January 25. Traders may have benefitted from this rise. However, the failure of the bulls to sustain the price above £1,000 shows traders are booking profits at higher levels. If the bears sink the price below £948, the pair could drop to the 20-day EMA. If the price rebounds off this level, the bulls will again try to resume the uptrend. This positive view will invalidate if the pair turns down and breaks below the support line of the ascending wedge. Such a move could signal a trend change.
ETHEREUM GBP – HOW TO TRADE ETH/GBP 19th JANUARY 2021
Etherum price GBP is on a steady rise while Bitcoin continues to trade in a tightening range within a pennant pattern. Ethereum looks to show continued strong price momentum driven by the Ethereum 2.0 launch and upcoming CME futures launch in February. With demand on the rise, Ethereum’s daily transaction volume is going parabolic. It now settles $12 billion in transactions daily – $3 billion more than Bitcoin.
CRYPTOCURRENCY TECHNICAL ANALYSIS – HOW TO TRADE ETH/GBP
Ether is in a strong uptrend and the bulls have pushed the price back towards the recent high at £996.45. The upsloping moving averages and the RSI in the overbought territory suggest bulls are in command. If the buyers can sustain the price above £1,000, the momentum could pick up. The next target to watch on the upside is £1,201 and then £1,400. Traders can attempt to ride this move higher by buying after the price sustains above £1,000 for a few hours and the stop-loss could be kept just below the 20-day EMA. This is a short-term trade and the risk to reward ratio is only about 1:1, hence the position size can be 50% of usual. Contrary to this assumption, if the price turns down sharply from the overhead resistance and the bears sink the price below the 20-day EMA, the pair could drop to £720. The bulls may enter close to this level and the pair may consolidate between £720 and £1,000 for a few days before starting the next trending move
ETHEREUM GBP – HOW TO TRADE ETH/GBP 12TH JANUARY 2021
The Etherum price GBP is one of the most popularly traded pairs in the financial market. The pair includes Ether and UK’s fiat currency GBP for trading. While Ethereum functions as the blockchain platform, which independent developers use for building smart contracts, as well as decentralized apps using the computing power, further paid in Ether, the British Pound, also known as Sterling, is a widely traded traditional currency after USD, Euro, and Yen. https://youtu.be/o4JEVCLJxDw
FIND OUT HOW TO TRADE ETHERUM GBP
Etherum price GBP, despite maturing since its launch in 2012, is regarded as a highly volatile cryptocurrency. On the other hand, GBP is the traditional currency of the UK and one of the most sought-after fiat currencies in the world. When the two currencies are traded together, the focus lies entirely on the base currency i.e. on the crypto side, owing to its daily average volatility, which is nearly ten times higher than the GBP. This implies that to trade Ethereum Price GBP currency pair successfully, traders must gain an understanding of how the two are intrinsically linked with each other in the crypto market, as well as the blockchain segment. Additionally, it is also important to analyze the dynamics involved in the movements of sterling.
GBP AND ETHEREUM – MAIN DIFFERENCES
Many factors drive crypto’s price direction, and they are much different from those that influence fiat currencies like GBP. Traders looking to trade Ethereum Price GBP currency must understand these differences and factors to trade profitably. Even though it differs (in nature) from Bitcoin, Ether’s pricing direction, like any other cryptocurrency, is directly correlated to Bitcoin. Another thing that must be kept in mind is that all digital currencies, including that of Bitcoin, are mostly influenced by increased public sentiment related to the adoption of digital currencies in the future. Thus, news about developments that further impact cryptocurrencies’ traction drives the prices of cryptocurrencies, including Ether, upwards. Especially in the case of Ether, the number of decentralized apps being managed and operated on the Ether blockchain directly impacts its demand, and thus the price of the cryptocurrency. In turn, it affects the long-term pricing trends instead of daily movement. Over time, competition from different blockchains that offer similar functionalities as Ether shall also impact Ethereum’s users, as well as Etherum price GBP. On the other hand, the Sterling or the GBP’s value against many other fiat currencies is impacted depending upon the performance of the UK’s economy, as well as the BoE’s (Bank of England) monetary policy.
TRADING ETHERUM GBP
Traders planning to trade ETH/GBP need to look at the chart positions and monitor GBP/USD market trends, as well as developments. They should primarily focus on ETH and also note that some of the major drivers of Ether’s value are news related sentiments. Thus, any news related to the rates of crypto adoption in the future and the long term use of the Ether platform, as well as other blockchains like EOS.IO can impact the price of ETH to a large extent.
CRYPTOCURRENCY TECHNICAL ANALYSIS – HOW TO TRADE ETH/GBP
We had projected a target objective of £1,000 in our previous analysis and Etherum price GBP hit a high of £996.45 on January 10. This may have attracted profit booking from traders but the bulls purchased the dip, forming a long-legged Doji candlestick pattern on January 10. However, the bulls could not build up on the recovery and the Etherum price GBP pair again turned down on January 11. The selling intensified after the bears broke below the £785.57 support. The bulls aggressively purchased the sharp drop to £621.02, which led to a sharp recovery by the end of the day. This suggests strong demand at lower levels. The bulls will now try to push the Ethereum price GBP back to £1,000, but the up-move will have to face stiff selling pressure as traders who are stuck at higher levels are likely to liquidate their positions. After the large range day on January 10, the pair may remain range-bound for the next few days as the bulls and the bears try to establish their supremacy. As the chart is not offering any clarity about the next possible move, traders may remain on the sidelines.
HOW TO TRADE ETH/GBP
The ETH/GBP is one of the most popularly traded pairs in the financial market. The pair includes Ether and UK’s fiat currency GBP for trading. While Ethereum functions as the blockchain platform, which independent developers use for building smart contracts, as well as decentralized apps using the computing power, further paid in Ether, the British Pound, also known as Sterling, is a widely traded traditional currency after USD, Euro, and Yen.
HERE, FIND OUT HOW TO TRADE ETH/GBP.
Ether, despite maturing since its launch in 2012, is regarded as a highly volatile cryptocurrency. On the other hand, GBP is the traditional currency of the UK and one of the most sought-after fiat currencies in the world. When the two currencies are traded together, the focus lies entirely on the base currency i.e., on the crypto side, owing to its daily average volatility, which is nearly ten times higher than the GBP.
This implies that to trade Ethereum Price GBP currency pair successfully, traders must gain an understanding of how the two are intrinsically linked with each other in the crypto market, as well as the blockchain segment. Additionally, it is also important to analyze the dynamics involved in the movements of sterling.
GBP AND ETH- MAIN DIFFERENCES
Many factors drive crypto’s price direction, and they are much different from those that influence fiat currencies like GBP. Traders looking to trade Ethereum Price GBP currency must understand these differences and factors to trade profitably. Even though it differs (in nature) from Bitcoin, Ether’s pricing direction, like any other cryptocurrency, is directly correlated to Bitcoin. Another thing that must be kept in mind is that all digital currencies, including that of Bitcoin, are mostly influenced by increased public sentiment related to the adoption of digital currencies in the future. Thus, news about developments that further impact cryptocurrencies’ traction drives the prices of cryptocurrencies, including Ether, upwards.
Especially in the case of Ether, the number of decentralized apps being managed and operated on the Ether blockchain directly impacts its demand, and thus the price of the cryptocurrency. In turn, it affects the long-term pricing trends instead of daily movement. Over time, competition from different blockchains that offer similar functionalities as Ether shall also impact Ethereum’s users, as well as Ether’s price.
On the other hand, the Sterling or the GBP’s value against many other fiat currencies is impacted depending upon the performance of the UK’s economy, as well as the BoE’s (Bank of England) monetary policy.
TRADING ETH/GBP
Traders planning to trade ETH/GBP need to look at the chart positions and monitor GBP/USD market trends, as well as developments. They should primarily focus on ETH and also note that some of the major drivers of Ether’s value are news related sentiments. Thus, any news related to the rates of crypto adoption in the future and the long term use of the Ether platform, as well as other blockchains like EOS.IO can impact the price of ETH to a large extent.
Hopefully, you have enjoyed today’s article. Thanks for reading! Have a fantastic day! Live from the Platinum Crypto Trading Floor.
#1CRYPTO TRADING MAGAZINE
CRYPTONAIRE WEEKLY
WEEKLY TOP TRADES, TOP PROJECTS AND MARKET UPDATES
By Clicking Submit, You agree to our terms and conditions


")