
Reading crypto charts is an important skill that you’ll need to learn as soon as possible in your trading career and business in order to be successful consistently. Not only does crypto charts analysis allow you to predict the price trend based on historical prices but it also supports the facts that you uncover from your fundamental analysis or recent news update.
Today’s focus will be on how to quickly read candlestick crypto charts which can provide a lot of information without bothering to place indicators on the crypto charts.
UNDERSTANDING THE BASICS OF CANDLESTICK CRYPTO CHARTS
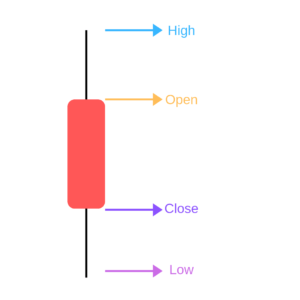
Let’s talk about this candlestick that you see here:
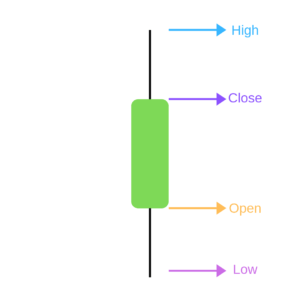
Each candlestick has 4 important parts that have been labeled in the diagram – high, low, open, and close. The green rectangular area that in the diagram is the body of the candlestick. A green body represents a bullish candle or a candle for which the closing price was above the opening price.
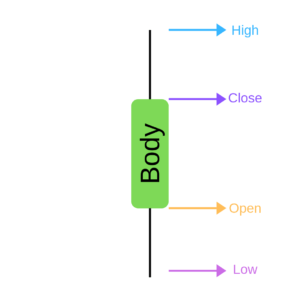
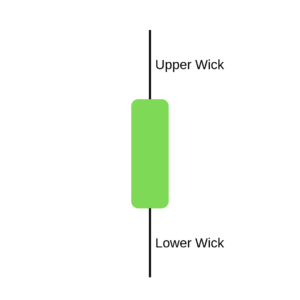
What happens after the open are shown as shadows or “wicks”, the lines that extend above and below the body of the candlestick. The shadows or the wicks represent where the price action went after the open.
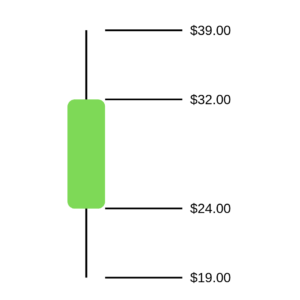
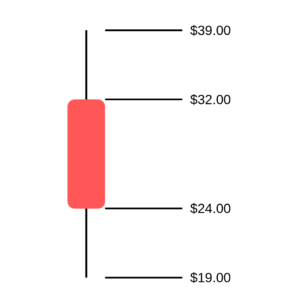
Consider this candlestick from a 24-hour crypto charts. At the start of the 24-hour period, this candle had a starting point or open at $24. Then, the candlestick starting falling till it reached $19 which became its low. After hitting the $19 mark the candlestick started to rise again and kept rising till it reached a high of $39. Then the candlestick started to fall again and finally closed at a price point of $32 at the end of the 24-hour period.
This was the anatomy of the bullish candlestick. For a bearish candlestick, the only difference is that the close is below the open.
Again, consider this bearish candlestick from a 24-hour chart:
This candlestick opened at $32, pushed up, and reached a high of $39. Then it started to fall and kept falling till it reached a low of $19. After that, the candlestick started to rise once again to reach $24, at which it closed at the end of the 24-hour period.
WHAT DOES A CANDLESTICK MEAN?
A candlestick represents price action during a specific time period. Price action means the movement or day-to-day fluctuation in the price of a particular cryptocurrency. The time period that you can choose to observe depends on the crypto charts platform that you are using but it generally ranges from a minute to a month.
If you’re studying crypto charts with a 5-minute period, it means that the candlestick will show the price movement that happened during that 5-minute period.
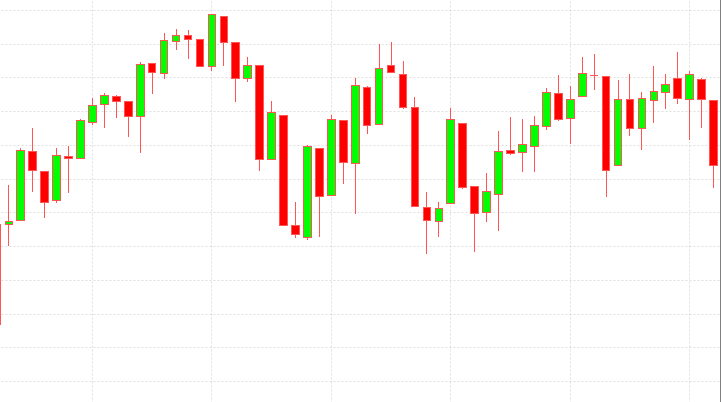
Consider this candlestick chart for which the time period has been set to a week. Each of the candlesticks represents a full week of price action.
HOW CAN CANDLESTICK CRYPTO CHARTS DETERMINE WHAT’S HAPPENING IN THE MARKET?
Understanding how to read a candlestick chart is the foundation of a good cryptocurrency trading strategy.
In this candlestick chart that we’re studying now, we have a starting point of $1870.
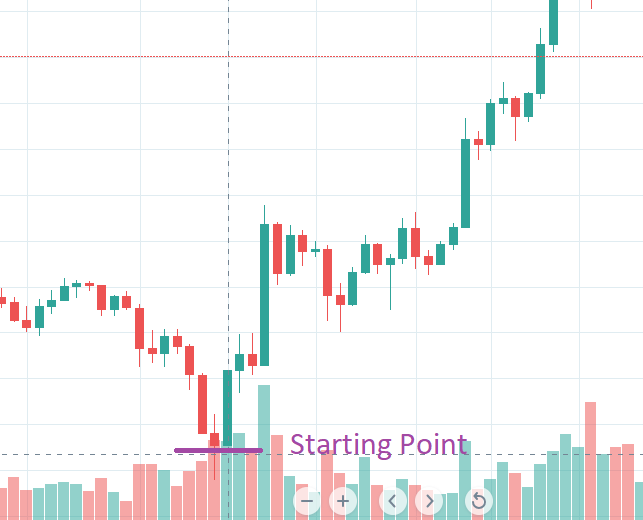
The crypto market then pushed up from this level with a nice, impulsive move. This indicates a lot of buyers coming in from that direction.
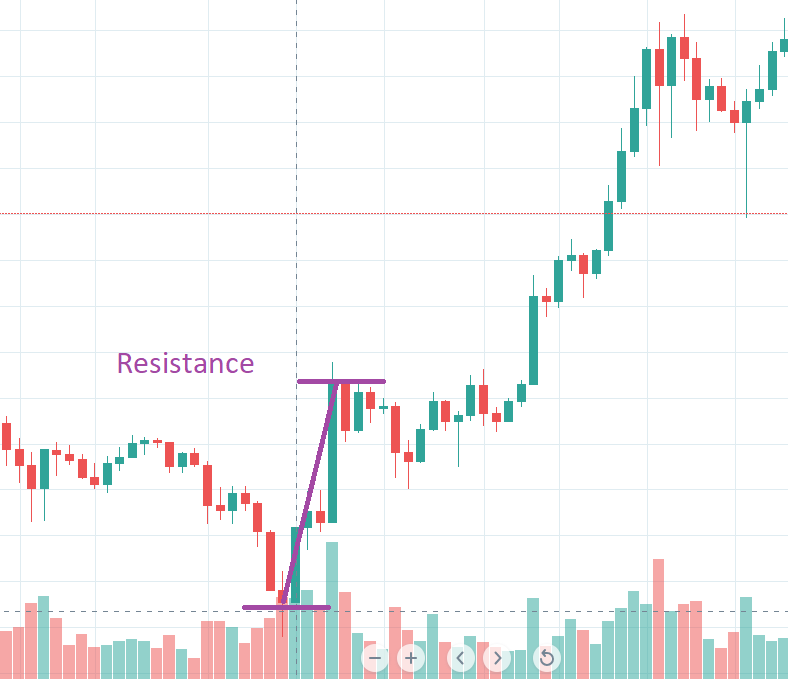
This “high” that was set up by the market before the price started to fall is known as resistance. At the resistance level, many traders look at their exit position and start taking profit by selling off the cryptocurrency.
We want to see if this resistance level is broken or not so that we can predict the market’s trend and overall movement.
After the price trend reaches a resistance level, there is a pullback and the price starts falling as traders start to sell and take profit. There can be various reasons behind why the traders starting selling at this point, from technical analysis to some trading tip to recent news event.
The price stops falling at the support level. At the support level, there is a large number of traders willing to buy the coin. This can be due to a lot of factors but mainly the traders believe that the coin is undervalued at this price and set their orders to buy the coin.
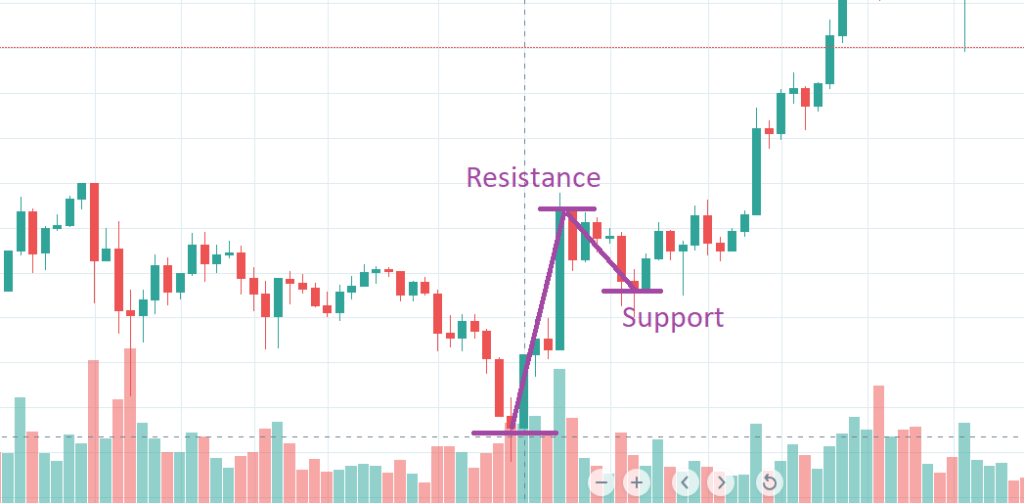
As soon as the price trend reaches a support level, we want to know if and when the resistance level will be broken. After hitting the support, the price again starts to rise, going over the previously set resistance level price and this is known as a breakout.
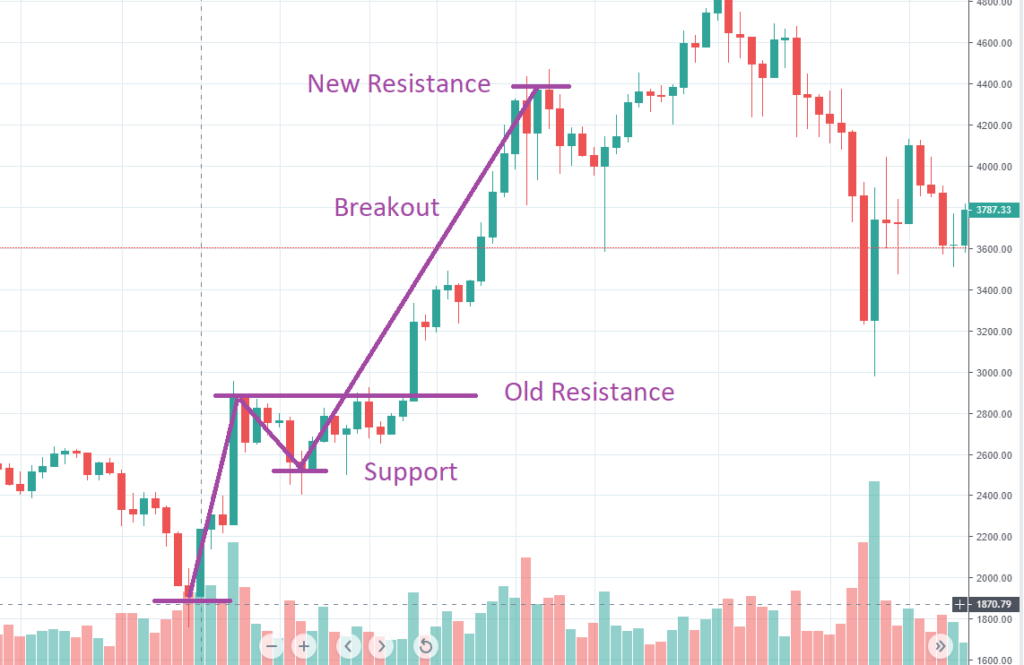
As soon as there is a resistance breakout, we can be sure that the market direction is currently up or bullish.
When you determine that the market is bullish, you can start making trades that require a bullish market to be successful. These are usually long-term trades which are optimistic about the continued rise in price.
In a bullish market, we expect the upward trend to continue and break the newly set resistance level before the price falls down to break the support level.
And that’s exactly what happens in our example. There is a pullback which creates a new support, after which the price starts rising and breaks the new resistance level that we had set.
Now, since we have a new high that broke our resistance level, we again expect the price trend to keep going up.
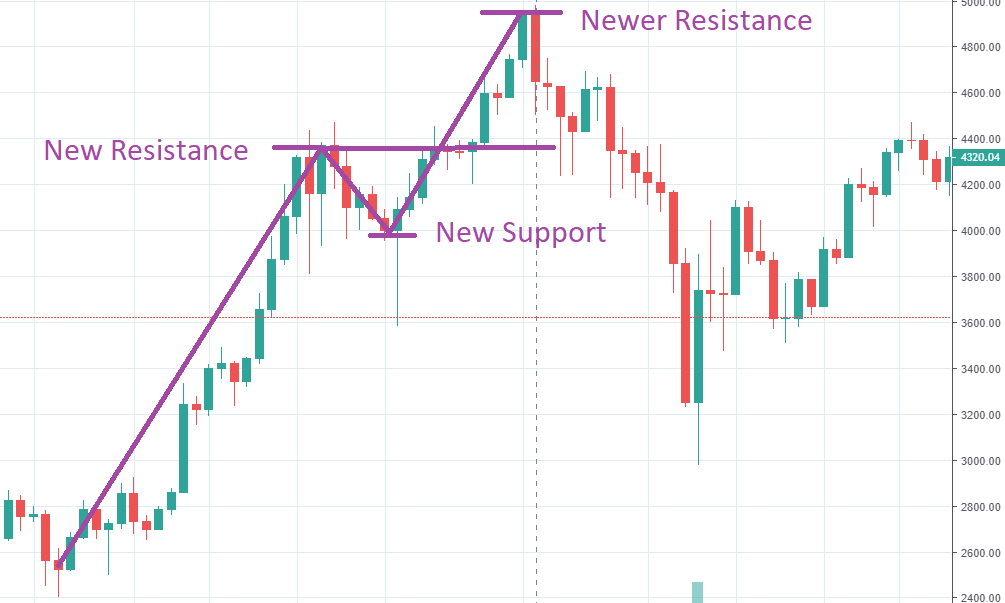
Notice this encircled region in this candlestick chart:
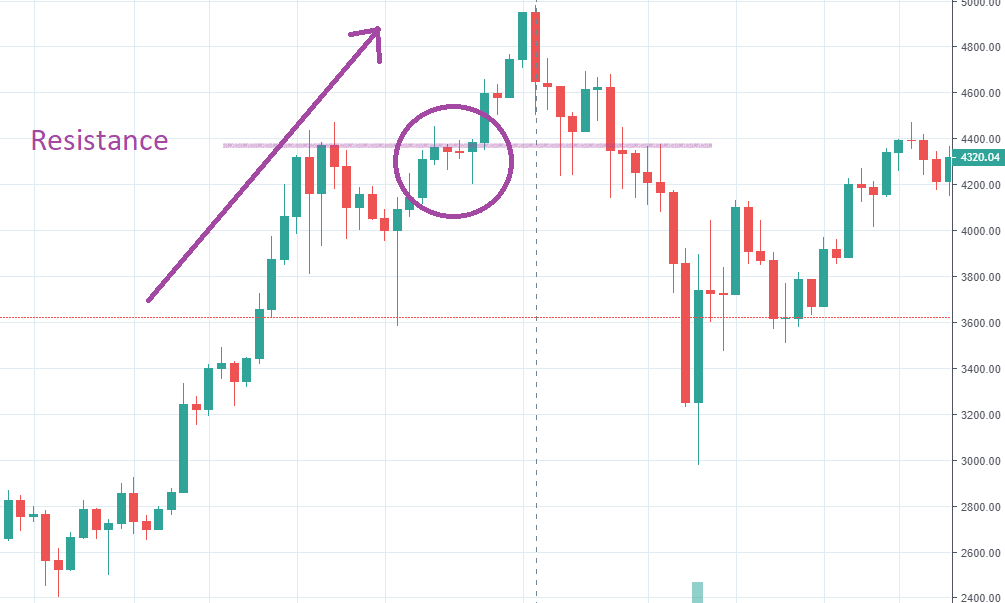
In this bullish market, our previously set resistance level was challenged by the market. Since the trend was bullish, the resistance level was broken and the price pushed beyond it. This is another indicator of the market’s underlying trend.
After hitting the newer resistance level, we were actually predicting the market to continue rising and break this newer resistance level before it could break the new support level. But that’s not what happens in this example.
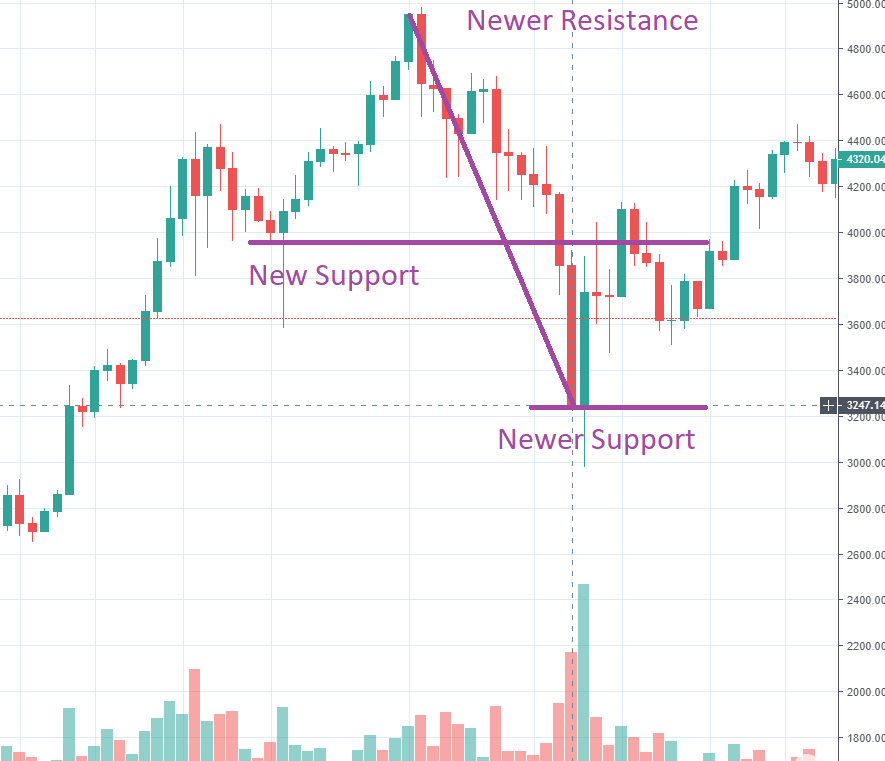
There is a pullback after hitting the newer resistance level and the market price continues to fall down, going below the previously set support level. It continues to fall until it set a newer support level at $3247.
At this point, we no longer continue to expect that the market is bullish and the trend will be up.
This is how you can get the market to tell you whether or not the market is going to be supported by a support level or continue rising in its bullish trend and vice-versa. There is no need for an indicator on your crypto charts for you to determine this. You don’t need MACD or RSI indicators to tell you whether the market is going to reverse or continue with its trend.
SAFETY NOT GUARANTEED
Note that technical analysis doesn’t guarantee any results or 100% accurate prediction of trends. I personally like technical analysis because it allows me to trade consistently within a framework. This ensures that my trading is not random or haphazard. I try to pick up patterns from the market and trade based on that. Technical analysis helps me uncover those patterns to quite an extent.
Hopefully, you have enjoyed today’s article. Thanks for reading! Have a fantastic day!
Richard Baker
Live from the Platinum Crypto Trading Floor.
Earnings Disclaimer: The information you’ll find in this article is for educational purpose only. We make no promise or guarantee of income or earnings. You have to do some work, use your best judgment and perform due diligence before using the information in this article. Your success is still up to you. Nothing in this article is intended to be professional, legal, financial and/or accounting advice. Always seek competent advice from professionals in these matters. If you break the city or other local laws, we will not be held liable for any damages you incur.