Hi Crypto Network,
The volatility in Bitcoin has again dropped close to the lows. This shows that a sharp directional move is around the corner. A Bloomberg article uses the Trading Envelope indicator to predict a large move.
It shows that the envelope is at its narrowest since September and the last time the envelope had narrowed similarly, Bitcoin had dropped 12%. While it is certain that a large directional move is around the corner, it is difficult to predict whether the price will breakout to the upside or the downside.
A few analysts are banking on the forthcoming halving in Bitcoin, in May 2020, to provide a boost to the price. The number being thrown around is $55,000. While this looks inviting, we have seen similar target projections by various analysts, which have failed to materialize. Hence, traders should buy only after the trend turns positive.
Let’s analyse the top five cryptocurrencies by market capitalization and see if we can spot any reversal patterns that can be purchased.
BTC/USD
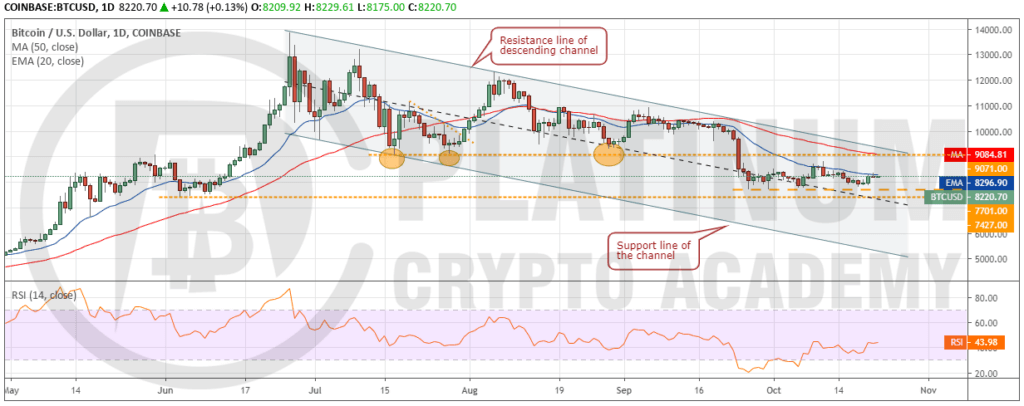
Bitcoin has been trading between the 20-day EMA and $7,701 for the past week. This shows that the range has tightened further as both the bulls and the bears wait for a clear directional move. If the bulls push the price above the 20-day EMA, a move to the resistance line of the descending channel is likely. A breakout of the channel will indicate an end of the downtrend. Traders can initiate long positions as suggested by us in our earlier analysis.
On the other hand, if the cryptocurrency turns down from current levels or the resistance line of the channel, the bears will attempt to sink it below the $7,701-$7,427 support zone. If successful, the pair can drop to the support line of the channel. A breakdown of the support zone will be a huge negative and will delay the start of the next leg of the up move.
ETH/USD
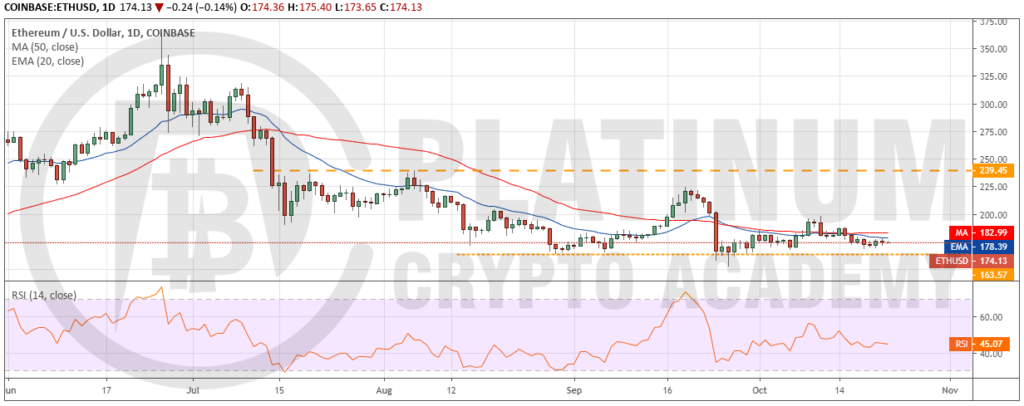
Ether has been trading close to the critical support of $163.57 for the past few days. The failure of the bulls to achieve a strong bounce off this level is a negative sign. It indicates that the buyers are not confident that a bottom is in place.
Both moving averages have flattened out and the RSI is just below the midpoint. This suggests a consolidation between $163.57-$197.93 in the short-term. A breakout of the moving averages can carry the price to the top of the range at $197.93. If the bulls can propel the price above this resistance, a rally to $224.71 and above it to $239.45 is possible.
Conversely, if the bears sink the price below the support at $163.57, a retest of the recent lows at $152.11 is likely. A break below $152.11 will be a huge negative as it can drag the price to $122. Therefore, traders can keep a stop loss of $163 on their long positions.
XRP/USD
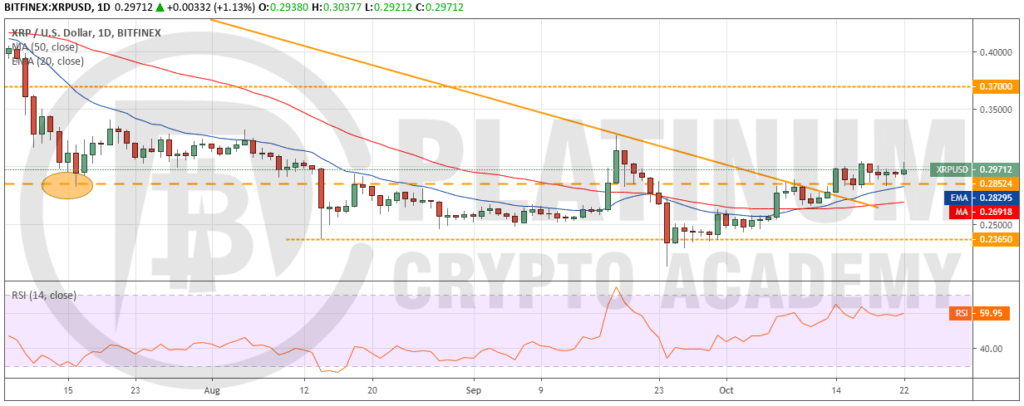
XRP has been sustaining above $0.28524 for the past five days. The 20-day EMA is sloping up and the RSI is in the positive territory. This shows that the bulls have the advantage in the short-term. If the buyers can push the price above $0.30478, a rally to $0.32732 will be on the cards. Above this level, the up move can reach $0.37.
Contrary to our assumption, if the bears sink the price below the immediate support of $0.28524, a dip to $0.26540 and below that to $0.23650 is likely. For now, the traders can keep the stop on the long positions at $0.23. The stops can be trailed higher to $0.26 if XRP moves above $0.31 during the week.
BCH/USD
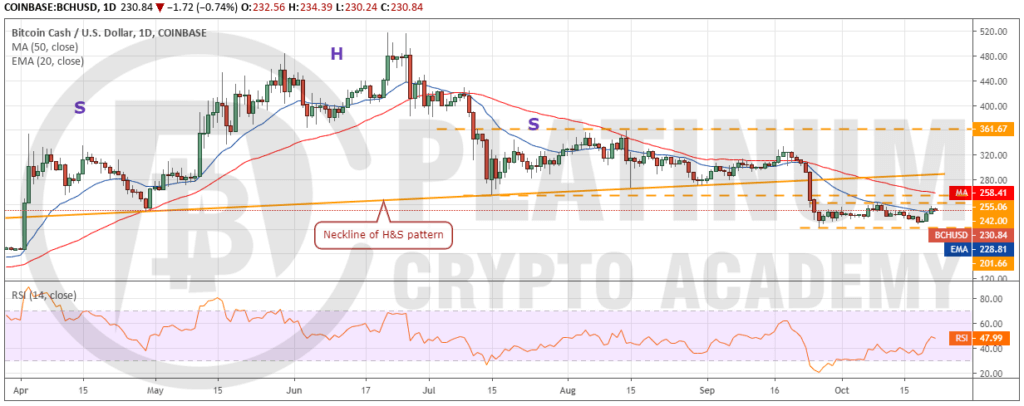
Bitcoin Cash has bounced sharply from close to the support at $201.66. This is a positive sign as it shows that bulls believe that a bottom is in place. The rebound has cleared the 20-day EMA, which shows that buyers continue to pile up even at higher levels. There is a minor resistance at $242, above which a move to the neckline of the head and shoulders pattern is likely. Though the 50-day SMA might act as a hurdle, we expect it to be crossed.
The neckline can act as a stiff resistance. If the price turns down from it, the bears will attempt to resume the downtrend while the bulls will try to form a higher low. If the next dip finds support above $242, it will be a positive sign. The traders can buy 50% of the desired position on a breakout and close (UTC time) above $242. We shall suggest adding the remaining position after the next dip.
Contrary to our assumption, if the bulls fail to propel the price above $242, the cryptocurrency will remain range-bound for a few more days. The trend will turn lower on a break below the recent lows of $201.66.
LTC/USD
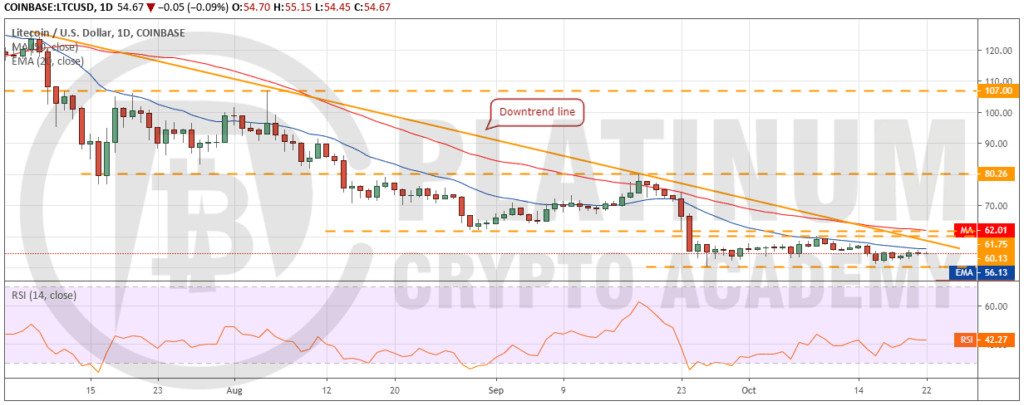
Litecoin again held the support at $50.25 on October 16, which is a positive sign. However, the bulls are struggling to scale the 20-day EMA. This shows that buying dries up at higher levels. There are several resistances between the 20-day EMA and 50-day SMA.
If the bulls can overcome these resistance levels and propel the price above the 50-day SMA, it will indicate an end of the downtrend. Above the 50-day SMA, a rally to $80.26 is likely. Therefore, traders can initiate long positions as recommended in our previous analysis.
Our bullish view will be invalidated if the bears sink the price below the recent lows of $50.25. A break below this can drag the price to $40.
Hopefully, you have enjoyed today’s article. Thanks for reading!
Have a fantastic day!
Live from the Platinum Crypto Trading Floor.
Earnings Disclaimer: The information you’ll find in this article is for educational purpose only. We make no promise or guarantee of income or earnings. You have to do some work, use your best judgement and perform due diligence before using the information in this article. Your success is still up to you. Nothing in this article is intended to be professional, legal, financial and/or accounting advice. Always seek competent advice from professionals in these matters. If you break the city or other local laws, we will not be held liable for any damages you incur.
")