A Bitcoin bear trap can be somewhat frustrating for a crypto traders so how do you avoid and ensure you dont get stuck in the trap. today we go through our usual market analysis but also explain the ins and outs of a Bitcoin bear trap.
BITCOIN BEAR TRAP – WHAT IS IT?
Bitcoin bear trap trading is when a Bitcoin bearish chart pattern occurs and falsely signals a reversal of the rising price trend.
What you may see is a reversal pattern (bearish rising wedge, bearing expanding triangle) that has formed on an uptrend. using this technical analysis you may think that the Bitcoin price is going to fall and continue down but what actually happens is the price either continue sideways or bounces back.
The best way to stop being caught by a Bitcoin bear trap is to have an understanding of candlestick patterns and knowledge of support and resistance levels.
Using proper risk management helps to keep any losses at a minimum! A Bitcoin bear trap is a common occurrence so traders should be prepared
CRYPTO MARKET ANALYSIS – BITCOIN BEAR TRAP
The crypto markets are currently moving in sync with the US equity markets. On June 11, the Dow plunged and that dragged the crypto markets lower. Again, on June 15, the Dow futures were pointing to a sharp fall that led the crypto markets lower.However, the US markets recovered and ended the day in the green. Promptly, the crypto markets also followed suit and recovered from their intraday lows.
JPMorgan Chase & Co. analysts painted a positive picture for the crypto universe as they said that cryptocurrencies had passed their first stress test during the current crisis. The analysts noted that Bitcoin is not acting as a safe haven but has been moving in tandem with the stock market. They warned that cryptocurrencies were likely to work more as “a vehicle for speculation than as a medium of exchange or store of value.”
A survey by Fidelity was more bullish on the investments by institutional investors. About 36% of the institutions already owned crypto assets and that number was likely to go up to 91% in the next five years. This shows that the institutional players are hedging their traditional portfolios by investing in cryptocurrencies.
Another indication of increased institutional appetite was the huge premium they are ready to pay to own Ether through the Grayscale Ethereum Trust. Usually, institutional investors take a long-term view, hence, these developments indicate that cryptocurrencies are likely to rally in the future.
POSSIBLE BITCOIN BEAR TRAP – BTC/USD PRICE CHART
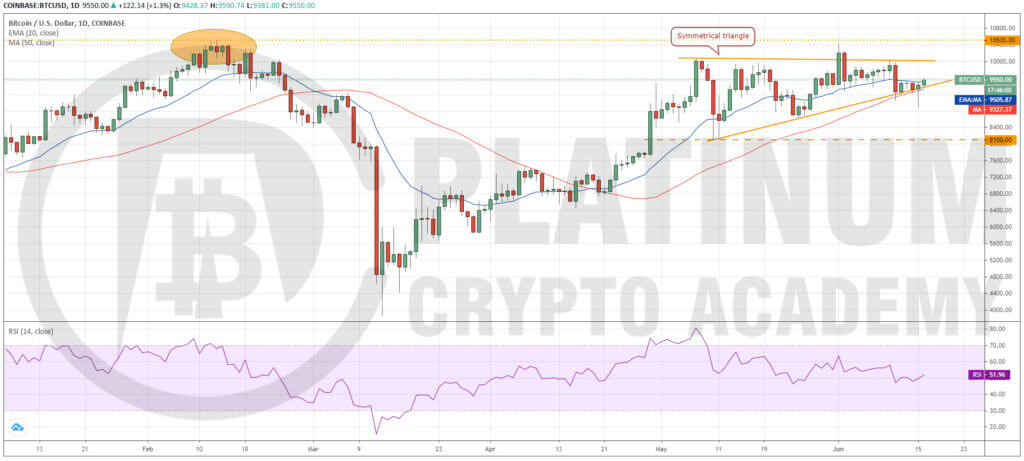
Though Bitcoin reached the $10,018.67 level on June 10, the bull could not sustain the price above $9,900 for four hours, hence, the trade suggested by us in the previous analysis did not trigger.
The failure to sustain above $10,000 levels resulted in profit booking by the short-term traders. As a result, the BTC to USD pair plunged to the 50-day SMA on June 11.
This dip was purchased by the bulls but they could not push the price above the 20-day EMA, which led to another sharp fall on June 15 to $8,895.01. However, the bears could not capitalize on this down move as lower levels saw aggressive buying by the bulls.
By close (UTC time), Bitcoin recovered and re-entered the triangle, which is a huge positive. Currently, the bulls are trying to push the price above the 20-day EMA. If successful, another attempt to break out of the $10,000-$10,500 resistance zone will be on the cards.
If the bulls can sustain the price above the $10,000 levels for four hours, traders can consider long positions with a close stop-loss. The first target is $10,500 and if that is crossed, then a rally to $12,000 is possible.
This bullish view will be invalidated if the pair again turns down from $10,000. In such a case, a few more days of volatile trading is likely.
ETH/USD
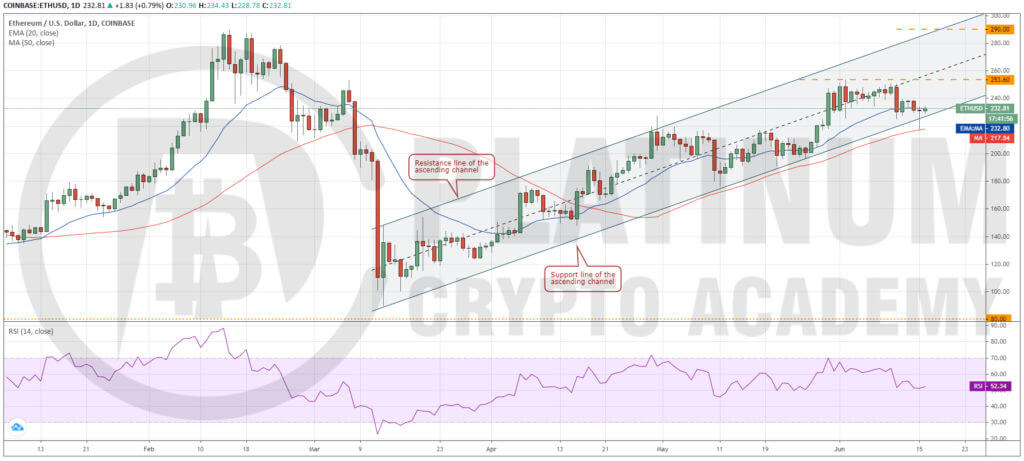
Ether turned down sharply on June 11 and broke below the 20-day EMA. Though the bulls bought this dip, the rebound fizzled out at $239.54. This suggests a lack of demand at higher levels.
On June 15, the bears resumed their selling and the biggest altcoin plunged below the support line of the channel. However, the bulls defended the 50-day SMA aggressively. As a result, the price recovered and the ETH to USD pair re-entered the channel.
If the bulls can push the price back above $240, a retest of the recent highs at $253.60 is likely. Above this level, the uptrend is likely to resume. The first target is a move to the resistance line of the channel at $290.
Therefore, aggressive traders can buy on a close (UTC time) above $240 with a stop-loss of $225. If the bulls struggle to scale the price above $253.60, the stops can be trailed higher to breakeven.
This bullish view will be invalidated if the price turns down from the current levels and breaks below $217.79. If that happens, the slide can extend to $196 and then to $176.
XRP/USD
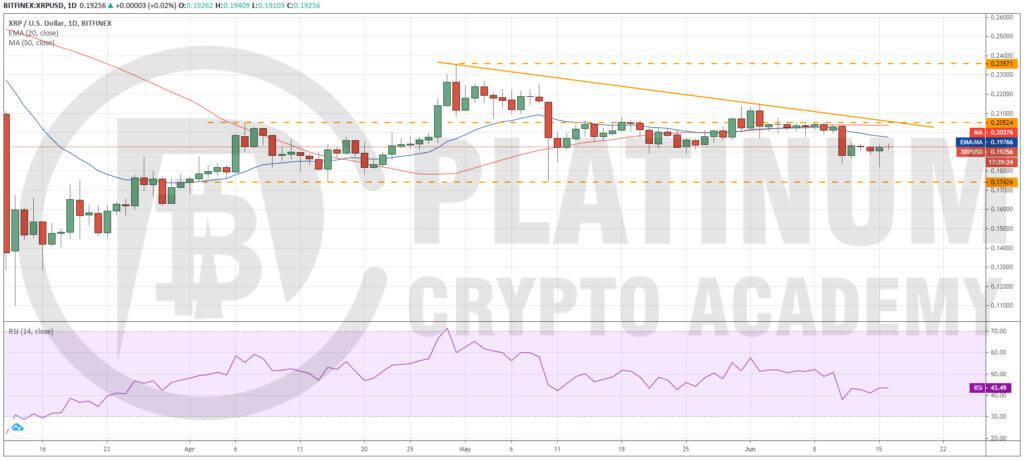
The bulls repeatedly failed to propel XRP above the overhead resistance of $0.20524 in the past few days. This resulted in profit booking by the short-term traders that dragged the price lower on June 11.
The bears again attempted to sink the price on June 15 but buyers stepped in at $0.18221 and staged a recovery. On the upside, the bears might defend the 20-day EMA and above it $0.20524.
A breakout and close (UTC time) above $0.20524 will be the first sign of strength. Above this level, a rally to $0.23571 is likely. If the momentum can carry the ETH to USD pair above this resistance, a new uptrend is possible.
Conversely, if the pair turns down from the current levels, it can drop to $0.17426. This level is likely to act as a strong support as it has not been broken since April 2. But if the bears sink the price below $0.17426, a new downtrend is likely.
The altcoin has been a huge underperformer for the past many months. Therefore, traders should wait for a trending move to start before buying it.
BCH/USD
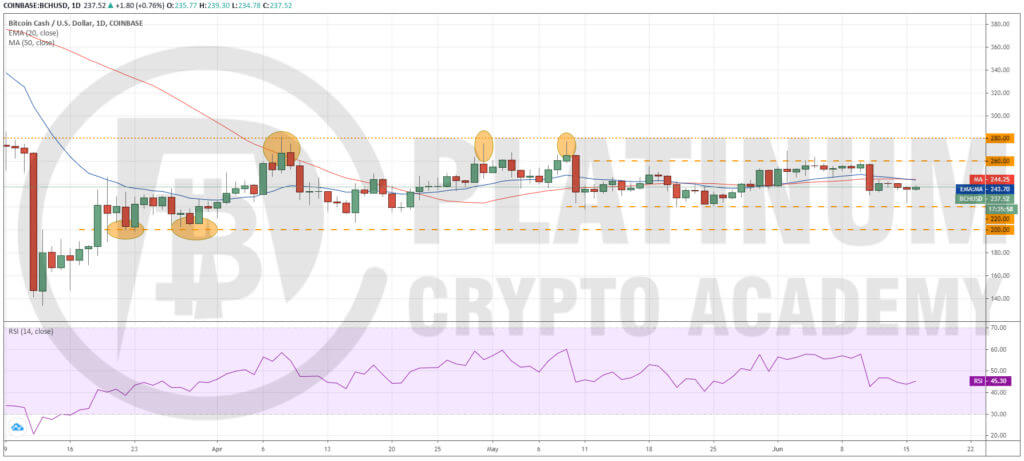
Bitcoin Cash is currently stuck in a tight range of $220-$260. The failure to breakout of this range attracted selling on June 11 that dragged the price down to the $224.22 on June 15.
Currently, bulls are attempting to keep the price inside the range. A break above the moving averages can result in a move to $260 and if this resistance is scaled, a retest of $280 will be on the cards. A breakout of this level will be a huge positive and can be purchased.
Conversely, if the BCH to USD pair turns down from the current levels or from the moving averages, the bears will once again attempt to sink the price below $220. If successful, a drop to $200 is possible. A break below $200 can result in a new downtrend.
BSV/USD
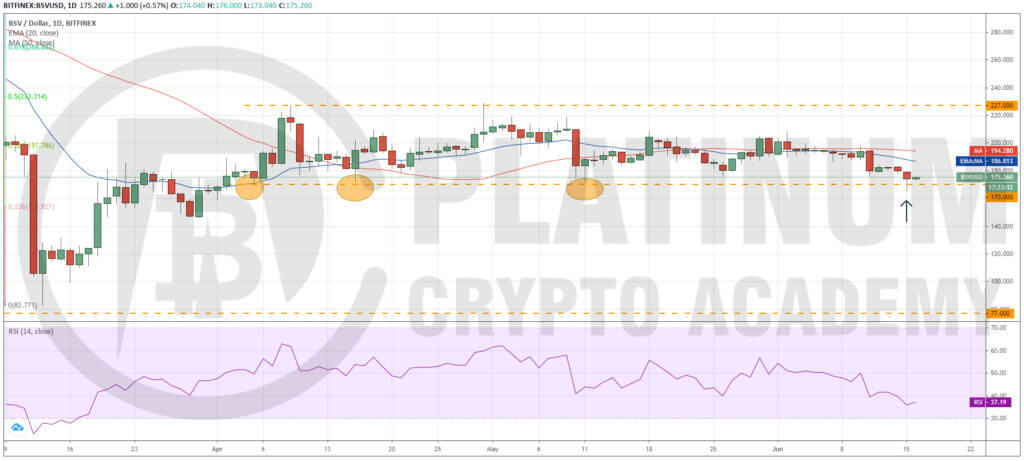
Bitcoin SV dipped below the support of the large $170-$227 range on June 15. This is a huge negative as it suggests that the bulls are not aggressively defending the $170 support.
Though the BSV to USD pair recovered and closed inside the range on June 15, the bulls are struggling to carry the price higher. This suggests a lack of demand at higher levels.
If the pair breaks below the $165.30-$170 support zone, a new downtrend is likely. The next support on the downside is at $146.20 and below that $120. As the pair has been a huge underperformer for the past many weeks, the traders can remain on the sidelines.
Hopefully, you have enjoyed today’s article. Thanks for reading!
Have a fantastic day!
Live from the Platinum Crypto Trading Floor.
Earnings Disclaimer: The information you’ll find in this article is for educational purpose only. We make no promise or guarantee of income or earnings. You have to do some work, use your best judgement and perform due diligence before using the information in this article. Your success is still up to you. Nothing in this article is intended to be professional, legal, financial and/or accounting advice. Always seek competent advice from professionals in these matters. If you break the city or other local laws, we will not be held liable for any damages you incur.
")