
Bitcoin soared above $22,000 and Ether above $1,500 on July 18, raising hopes that the worst may be over for the cryptocurrency markets. Bitcoin’s recovery started on July 13 even as the United States inflation in the month of June hit a 40-year high of 9.1%, much higher than economist expectations of 8.8%, according to Refinitiv.
The recovery in Bitcoin and Ether on July 18 pushed the total crypto market capitalization above $1 trillion for the first time since June 13, according to coinmarketcap data.
Does the recovery mark the end of the bear phase in Bitcoin? Market intelligence firm Glassnode believes that a “genuine bottom formation could be underway” but more sideways action is likely in the next few weeks.
In their latest newsletter, Glassnode said that the realized price, the value of all Bitcoin at the price they were bought, divided by the number of Bitcoin in circulation, is a reliable metric to signal a bear market bottom. During previous bear markets, Bitcoin has spent an average of 197 days below its realized price while it has only clocked 35 days below its realized price during the current bear phase.
On similar lines, fund manager Grayscale said in a recent report titled “Bear Markets in Perspective” that Bitcoin moves in market cycles that last approximately “4 years or 1,275 days.” According to Grayscale, the current 2020 cycle completed 1,198 days as of July 12. This means Bitcoin “ may see another 5-6 months of downward or sideways price movement.”
Although on-chain data suggests that Bitcoin may have started a bottoming formation, the Bitcoin whales have not yet sprung into action. BlockTrends analyst Caue Oliveira said in a Twitter thread that institutional activity could be tracked by monitoring the “transactional volume moved over a short period of time.” Large transactions have been absent after the month of May, barring the period when Terra LUNA collapsed. Oliveira added that “whales remain in hibernation, waiting for the right moment to take up.”
Could Bitcoin price bottomed out and major altcoins remain stuck in a range or is a short-term rally possible? Read our analysis of the major cryptocurrencies to find out.
BTC/USD Market Analysis
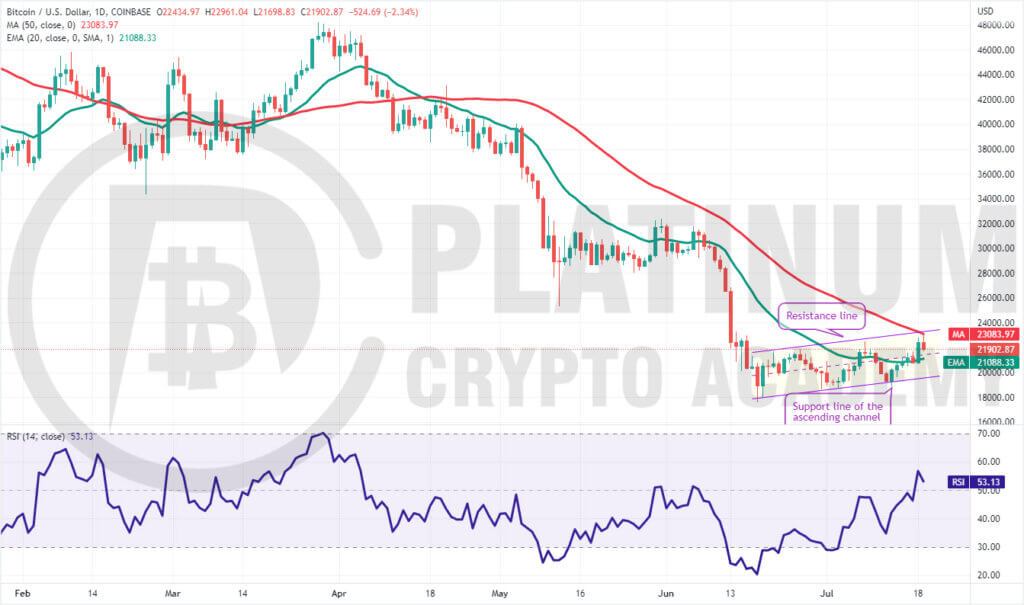
We had projected in our previous analysis that if Bitcoin rebounds off the support line, it could reach the resistance line of the ascending channel and that is what happened.
The price has turned down from the resistance line, indicating that bears are active at higher levels. If the price rebounds off the 20-day exponential moving average (EMA), the bulls will make another attempt to clear the overhead hurdle.
If they succeed, the BTC/USD pair could pick up momentum and rally toward the pattern target of $26,500. If this level is crossed, the up-move could reach $32,000.
On the other hand, if the price slips below the 20-day EMA, the pair could drop to the support line of the channel. A bounce off this level will suggest that the pair may extend its stay inside the channel for a few more days.
The flattish 20-day EMA and the relative strength index (RSI) near the midpoint also suggest a range-bound action in the near term.
The bears will have to sink the price below the channel to gain the upper hand. That could open the doors for a retest of the June 18 intraday low of $17,567.45.
ETH/USD Market Analysis
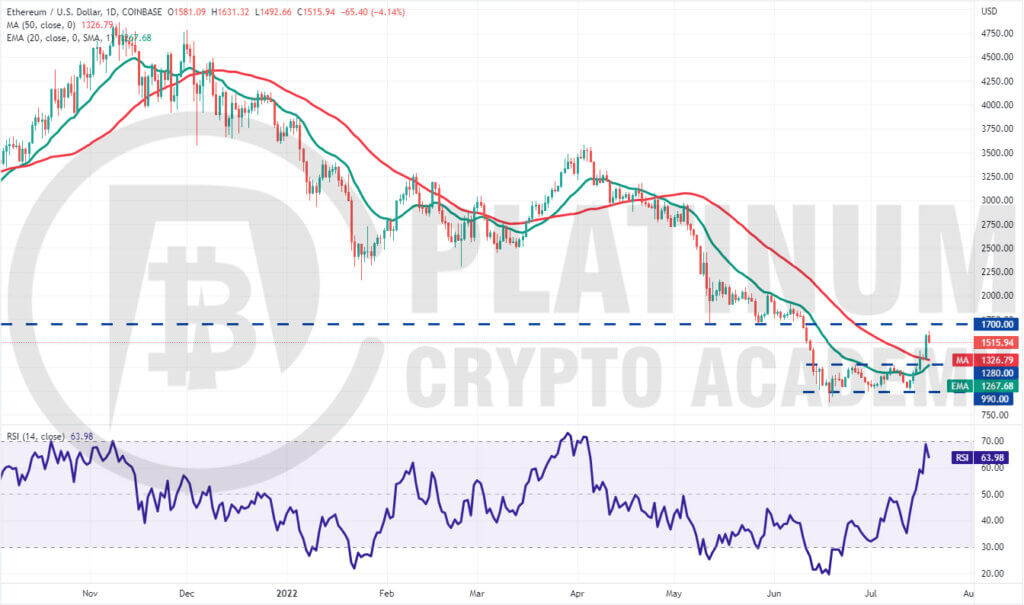
Ether bounced off the strong support at $990 on July 13 and broke above the overhead resistance at $1,280 on July 16. This indicates that the ETH/USD pair may have bottomed out at $879.80.
The bears tried to stall the up-move at the 50-day simple moving average (SMA) on July 17 but sustained buying by the bulls cleared the overhead hurdle on July 18. The pair could reach $1,700 where the bears are expected to mount a strong resistance.
The moving averages are close to completing a bullish crossover and the RSI is in the positive territory, indicating advantage to buyers.
If the bulls arrest the next pullback at the 20-day EMA, it will indicate that the sentiment has changed from selling on rallies to buying on dips. The pair could then again attempt to climb above $1,700. If that happens, the next stop could be the psychological level of $2,000.
This positive view could invalidate if the price breaks below $1,280. Such a move will suggest that the pair may oscillate inside a large range between $990 and $1,700 for a few days.
BNB/USD Market Analysis
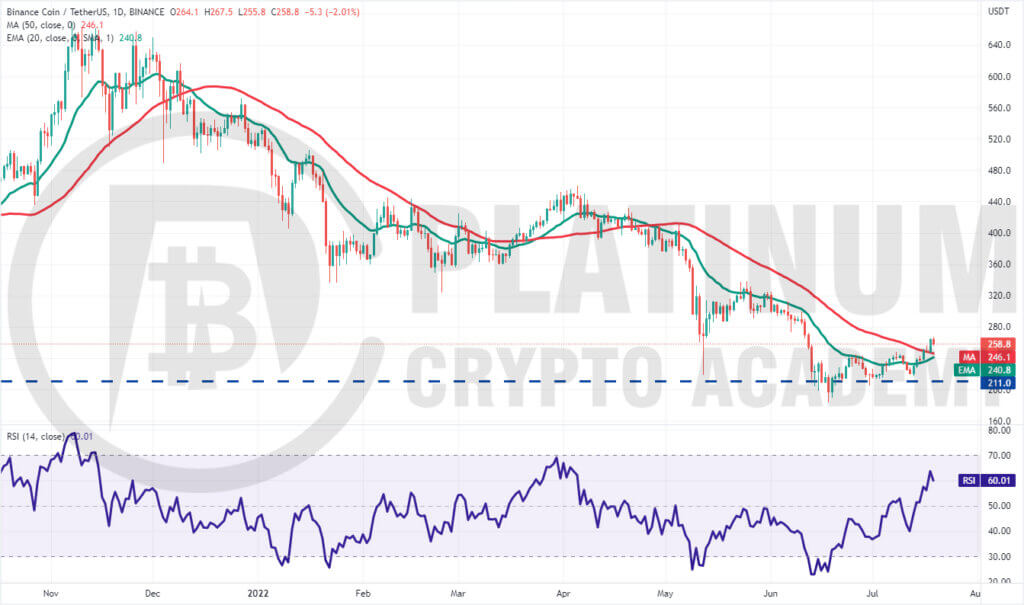
The bulls aggressively defended the $211 support on July 13, indicating that this level could be acting as a strong floor. The buyers pushed Binance Coin above the 20-day EMA on July 14 and cleared the hurdle at the 50-day SMA on July 18. This is the first indication that the BNB/USD pair may have bottomed out.
The moving averages are on the verge of a bullish crossover and the RSI is in the positive territory. This suggests that buyers have the upper hand. The critical level to watch on the downside is the 20-day EMA.
If the price rebounds off the 20-day EMA, it will suggest bulls are accumulating on dips. That will increase the possibility of the resumption of the up-move. The pair could then rise to the psychological level at $300 and then march higher to $340.
Conversely, if the price turns down and breaks below the moving averages, it will suggest that bears continue to sell on rallies. The pair could then drop to $211. However, we give this a low probability of occurring.
XRP/USD Market Analysis
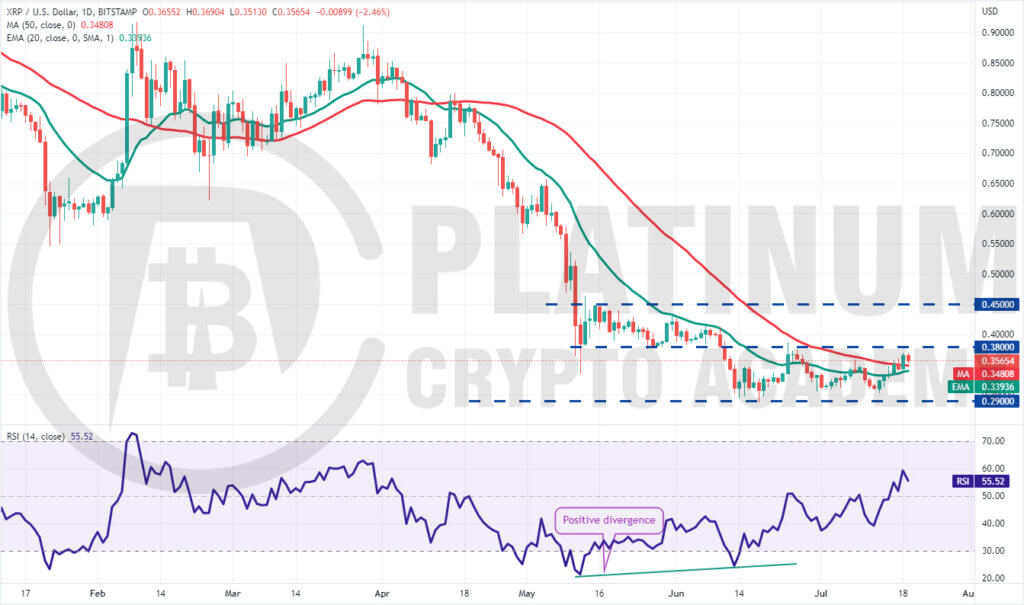
XRP has been trading between $0.29 and $0.38 for the past few days. In a range, traders buy near the support and sell near the resistance. The 20-day EMA has flattened out and the RSI is in the positive territory, indicating a slight advantage to buyers.
If the price rebounds off the 20-day EMA, the likelihood of a break above $0.38 increases. If that happens, the XRP/USD pair could rally to the next overhead resistance at $0.45. The bears are expected to defend this level with vigor.
If the price turns down from $0.45 but does not dip back below $0.38, it will indicate that the downtrend may be over.
Contrary to this assumption, if the price breaks below the 20-day EMA, the pair may slide to $0.29 and spend some more time inside this range. The bears will gain the upper hand on a break and close below $0.29.
ADA/USD Market Analysis
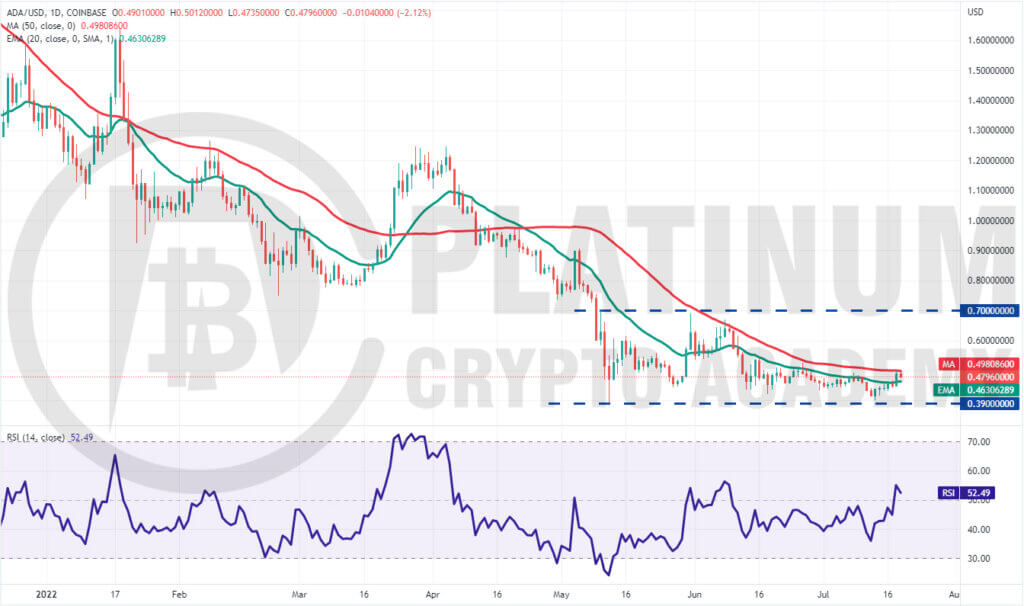
Cardano bounced off the crucial support at $0.39 on July 13, indicating strong demand at lower levels. The buyers cleared the 20-day EMA hurdle on July 18 but are facing resistance at the 50-day SMA.
The 20-day EMA has flattened out and the RSI is just above the midpoint, suggesting that the selling pressure could be reducing.
If the price turns down from the current level but rebounds off the 20-day EMA, it will enhance the prospects of a break above the 50-day SMA. If that happens, it will suggest that the bulls are back in the game.
A break and close above the 50-day SMA could clear the path for a possible rally to $0.60 and then to $0.70.
Alternatively, if the price slips below the 20-day EMA, the ADA/USD pair could slide to $0.39. A break and close below this support could indicate the resumption of the downtrend.
Hopefully, you have enjoyed today’s article for further coverage please check out our crypto Blog Page. Thanks for reading! Have a fantastic day! Live from the Platinum Crypto Trading Floor.
Earnings Disclaimer: The information you’ll find in this article is for educational purpose only. We make no promise or guarantee of income or earnings. You have to do some work, use your best judgement and perform due diligence before using the information in this article. Your success is still up to you. Nothing in this article is intended to be professional, legal, financial and/or accounting advice. Always seek competent advice from professionals in these matters. If you break the city or other local laws, we will not be held liable for any damages you incur.
")