
Bitcoin continues to trade inside a large range as dwindling inflows into the Bitcoin spot exchange-traded funds, geopolitical tensions, and uncertainty about the extent of rate cuts by the United States Federal Reserve in 2024 are keeping investors on the edge.
Although the uptrend has stalled, a positive sign in favor of the bulls is that Bitcoin has not collapsed below the psychologically important $60,000 level. However, the month of May could prove to be challenging for the buyers. CoinGlass data shows that Bitcoin has closed May in the red for the past three years.
Another negative for the markets in the near term is that investor interest in the Bitcoin ETFs seems to be decreasing. Farside Investors data shows that Bitcoin ETFs have witnessed net outflows since April 24. Although the figures are not alarming, they show that investors are cautious post-halving.
The lull after the Bitcoin halving is nothing new, as it has occurred during the previous three halvings since 2012, according to Bitwise. The firm said in a recent X post that markets remain uncertain after halving, but in the year following the halving, it sees substantial gains.
On similar lines, Bernstein said in a research report that the slowdown in Bitcoin ETF inflows was a temporary pause and not the start of a worrying trend. The broker has kept its target objective of $150,000 for Bitcoin by 2025.
Morgan Creek Capital CEO Mark Yusko remains bullish on digital assets in the medium term. While speaking in an interview with The Wolf Of All Streets podcast, Yusko said that roughly 1% of the baby boomers’ wealth of about $30 trillion is likely to enter into the cryptocurrency space within 12 months, which is “more money than has ever [been] converted to Bitcoin in 15 years.”
The near term remains uncertain, with the onus on the bulls to defend the support levels. What are the important levels to watch out for in Bitcoin and the major altcoins? Let’s study the charts to find out.
BTC/USD Market Analysis
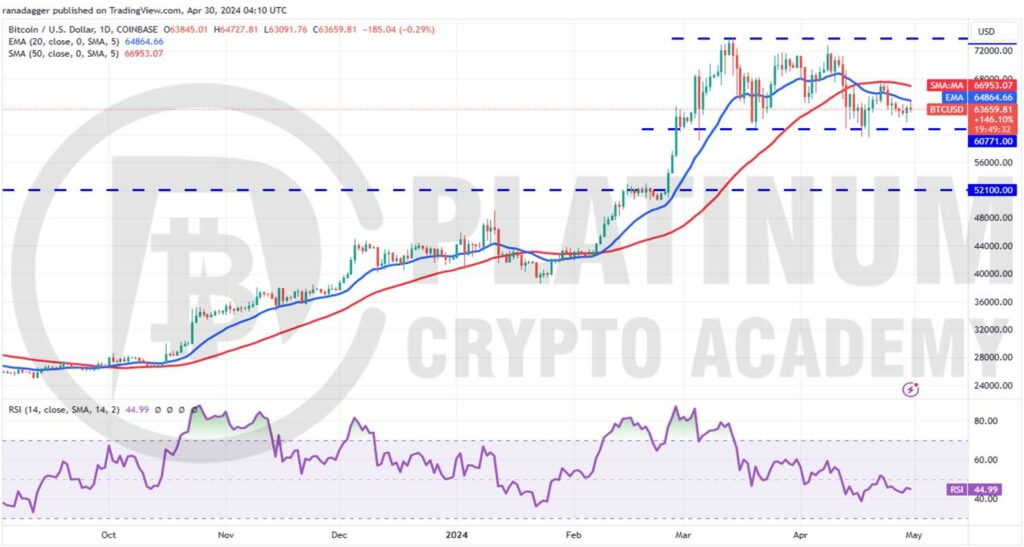
We said in the previous analysis that if the price rebounds off the $59,224 level, then Bitcoin may stay range-bound for some more time, and that is what happened.
The BTC/USD pair bounced off $59,573 on April 19, but the bulls could not clear the overhead resistance at the 50-day simple moving average (SMA). This suggests that the bears are selling on rallies.
The downsloping 20-day exponential moving average (EMA) and the relative strength index (RSI) just below the midpoint suggest a minor advantage to the bears. The sellers will make one more attempt to sink the pair below $59,224. If they succeed, the decline could extend to $52,100 where the buyers may step in to arrest the fall. A deeper correction could delay the start of the next leg of the uptrend.
On the other hand, if the price once again rebounds off $59,224, it will signal that the bulls are aggressively defending the level. The bulls will then make one more attempt to drive the price above the 50-day SMA. If they manage to do that, the pair may climb to the overhead resistance of $73,835. Buyers will have to clear this hurdle to start the next leg of the uptrend to $88,446.
ETH/USD Market Analysis
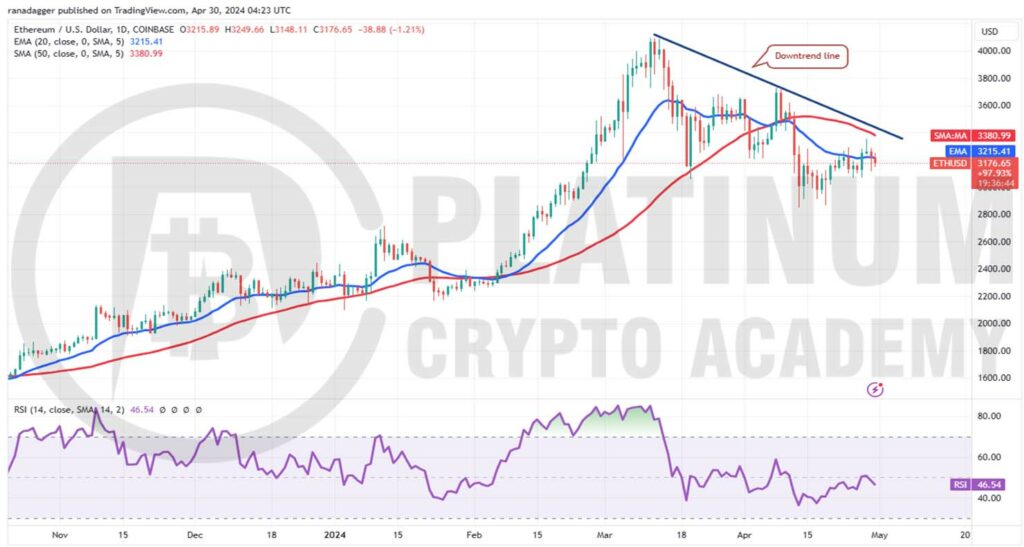
Ether pulled back from $2,865 on April 19, but the recovery hit a wall at the 50-day SMA. This suggests that the bears are active at higher levels. The bears will again try to sink the price below the solid support at $2,850.
However, the flattening 20-day EMA and the RSI just below the midpoint suggest a range-bound action in the near term. The ETH/USD pair may swing between $2,850 and the downtrend line for a while.
A break and close below $2,850 will indicate that the bears have overpowered the bulls. That could start a downward move toward $2,700. This level is likely to attract strong buying by the bulls, but if the bears prevail, the pair may plummet to $2,165.
Contrarily, if the price turns up and breaks above the downtrend line, it will signal that the bulls are trying to make a comeback. The pair could then start a rally to $3,730, which is likely to act as a solid barrier.
BNB/USD Market Analysis
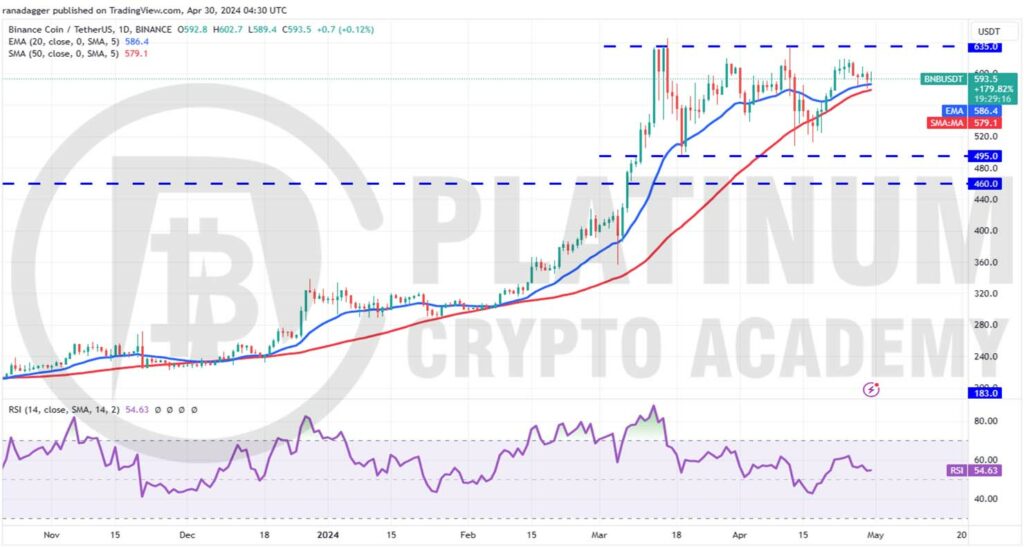
We mentioned in the previous analysis that Binance Coin is likely to remain range-bound if the $495 level holds, and that is how it has been.
The BNB/USD pair bounced off $512 on April 17 and started a relief rally, but that stalled at $618. This suggests that the pair is facing selling near the $635 resistance.
The price has dipped to the moving averages, an essential support to watch out for in the short term. If the price rebounds off the moving averages, the bulls will again try to overcome the obstacle at $635. If they manage to do that, it will indicate the resumption of the uptrend. The pair could then climb to $692.
Contrary to this assumption, if the price turns down and breaks below the moving averages, it will signal that the range-bound action may continue for a few more days. The bears will gain the upper hand if they sink and maintain the price below $495.
XRP/USD Market Analysis
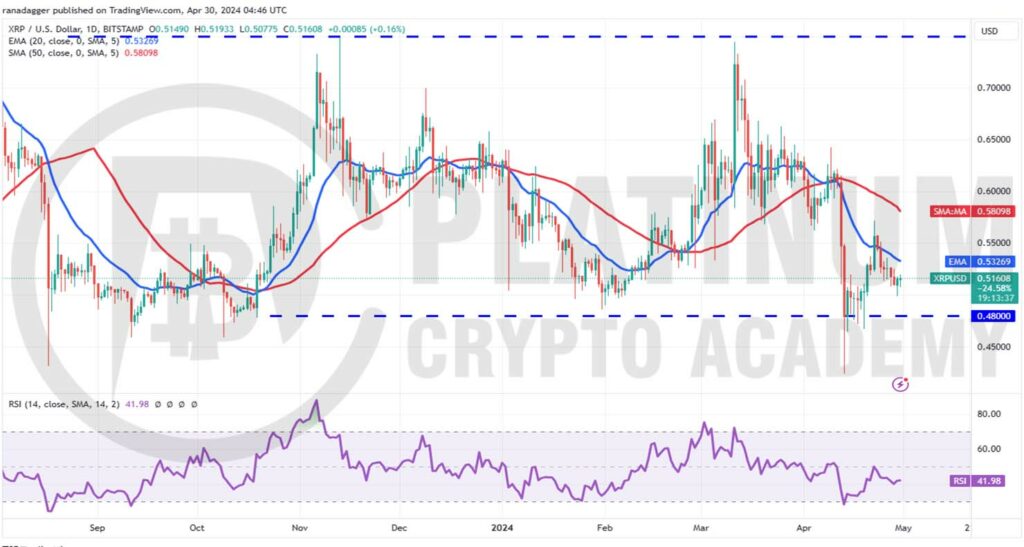
The repeated failure of the bears to sustain XRP below the $0.48 support started a recovery that rose above the 20-day EMA on April 22. However, the bulls could not maintain the higher levels, and the price turned back below the 20-day EMA on April 23. This shows that the sentiment remains negative, and traders are selling on rallies.
The XRP/USD pair could again descend to the vital support zone of $0.48 to $0.42. Buyers are likely to defend this zone with all their might because a break below it could start a new downtrend. The next support is at $0.35 and then $0.30.
On the upside, the bulls will have to clear the $0.57 resistance to indicate that the selling pressure could be reducing. The pair may then attempt a rally to $0.65. Such a move will suggest that the pair may spend some more time inside the large range between $0.48 and $0.75.
ADA/USD Market Analysis
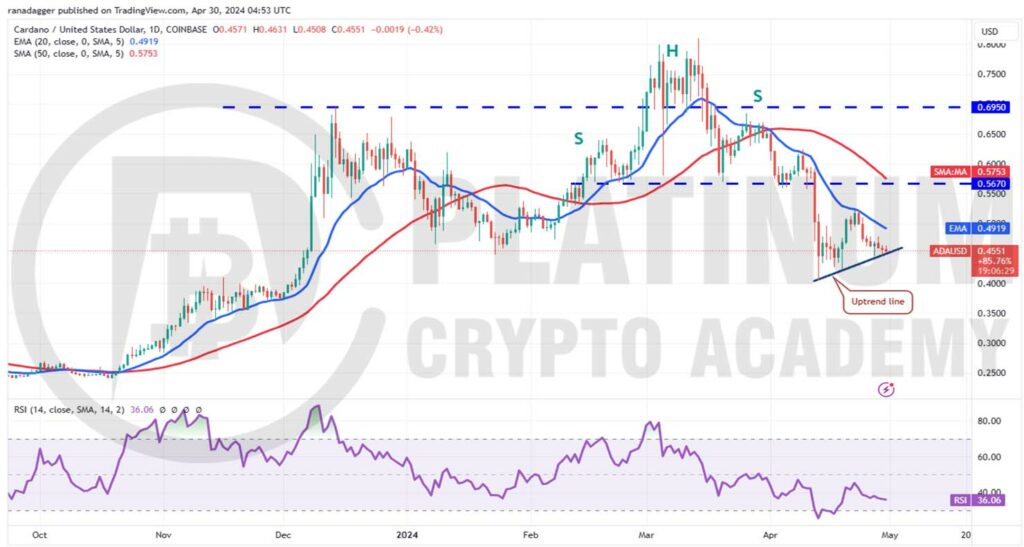
Cardano attempted a recovery, which hit a wall at the 20-day EMA. This suggests that the trend remains negative, and traders are viewing the rallies to the 20-day EMA as a selling opportunity.
The bulls are trying to defend the uptrend line, but the weak bounce shows a lack of aggressive buying. This increases the possibility of a fall to the crucial support at $0.40. If this support holds, it will indicate that the bulls are vigorously defending the level. That could start a relief rally toward $0.52.
A break and close above $0.52 will signal that the corrective phase may be over. The ADA/USD pair may then jump to $0.57 and subsequently to $0.62.
Contrarily, a fall below $0.40 will signal the resumption of the downtrend. The pair could then plunge to $0.35.
Hopefully, you have enjoyed today’s article for further coverage please check out our crypto Blog Page. Thanks for reading! Have a fantastic day! Live from the Platinum Crypto Trading Floor.
Earnings Disclaimer: The information you’ll find in this article is for educational purpose only. We make no promise or guarantee of income or earnings. You have to do some work, use your best judgement and perform due diligence before using the information in this article. Your success is still up to you. Nothing in this article is intended to be professional, legal, financial and/or accounting advice. Always seek competent advice from professionals in these matters. If you break the city or other local laws, we will not be held liable for any damages you incur.
")