
Bitcoin could start a decisive trending move soon, with some analysts expecting a target of more than $100,000 by the end of next year.
After falling 4% in July, Bitcoin entered a tight range in August. This suggests that the bulls and the bears are uncertain about the next directional move. A minor positive for the bulls is that they have not given up much ground from the local high of $31,862 made on July 13. This suggests that several traders are holding on to their positions as they anticipate the up-move to continue.
While the dull short-term price action has frustrated the traders, several long-term investors have shifted their focus to Bitcoin’s halving in 2024. Blockstream CEO Adam Back believes that Bitcoin will reach $100,000 before the next halving.
Back is not alone, Geoff Kendrick, Head of Crypto Strategy & Emerging Markets FX at Standard Chartered, while speaking to CNBC on July 27 said that Bitcoin could reach anywhere between $100,000 and $120,000 by the end of 2024. Kendrick’s projection is based on Bitcoin’s price action seen during previous halving cycles, which he expects will be repeated again.
Another possible trigger for Bitcoin could be approval for one or more Bitcoin spot exchange-traded fund applications by the United States Securities and Exchange Commission. Bloomberg ETF analyst James Seyffart tweeted on August 2 that all eight applications could be approved if Grayscale wins the lawsuit against the SEC.
MicroStrategy seems to be planning to build upon its already massive stash of Bitcoin. The Business Intelligence firm plans to raise $750 million via stock sale and use the proceeds for acquiring more Bitcoin and working capital.
While the long-term looks positive, investors seem to be nervous about the near term. CoinShares said in its latest Digital Asset Fund Flows Weekly Report that digital investment products saw an outflow of $107 million, indicating profit-booking in recent weeks.
Is the current weakness a buying opportunity in Bitcoin and the major altcoins or could the correction deepen further? Let’s study the charts of Bitcoin and the major altcoins to find out.
BTC/USD Market Analysis
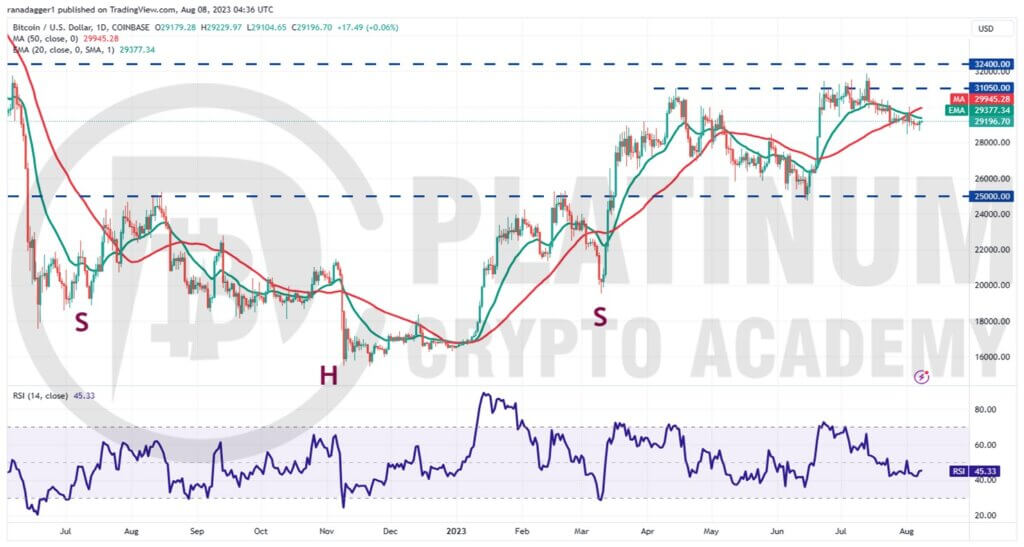
Bitcoin has been trading below the 20-day exponential moving average (EMA) for the past several days. But the bears have not been able to build upon this advantage and sink the price to the next support at $27,500. This suggests a lack of aggressive selling at lower levels.
The 20-day EMA remains the key short-term resistance to watch out for. If bulls overcome this barrier, the BTC/USD pair could rise to the 50-day simple moving average (SMA) and then sprint toward $31,050.
The bears are again expected to mount a strong defense in the zone between $31,050 and $32,400. A break and close above this zone could start an uptrend toward $40,000 as there is no major resistance in between.
On the downside, a drop and close below $28,477 could start a downward move toward $27,000. Such a move will suggest that the pair could remain stuck inside the large range between $25,000 and $31,050 for a while longer.
ETH/USD Market Analysis
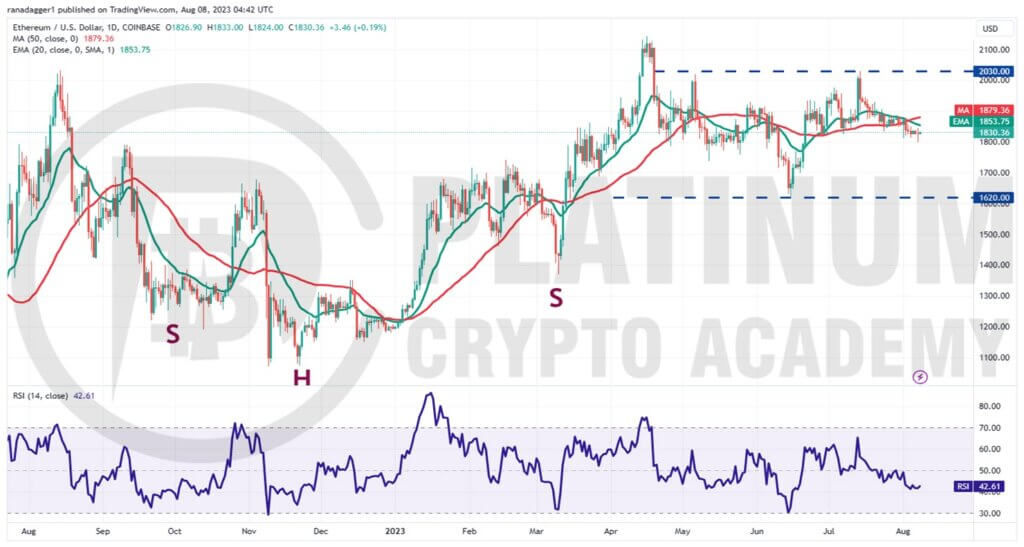
Ether has been range-bound between $1,620 and $2,030 for the past several days. The immediate support to watch on the downside is $1,800.
If this level gives way, the ETH/USD pair could slide to $1,700 and then to $1,620. The downsloping 20-day EMA and the relative strength index (RSI) in the negative territory indicate that bears have a slight edge.
If bulls want to prevent the decline, they will have to quickly drive the price above the moving averages. If they manage to do that, the pair could pick up momentum and make a dash toward the stiff overhead resistance at $2,030.
This level has acted as a major hurdle on two occasions, hence the bears will try to protect it fiercely. But if bulls overcome this obstacle, the pair could surge to the pattern target of $2,440.
BNB/USD Market Analysis
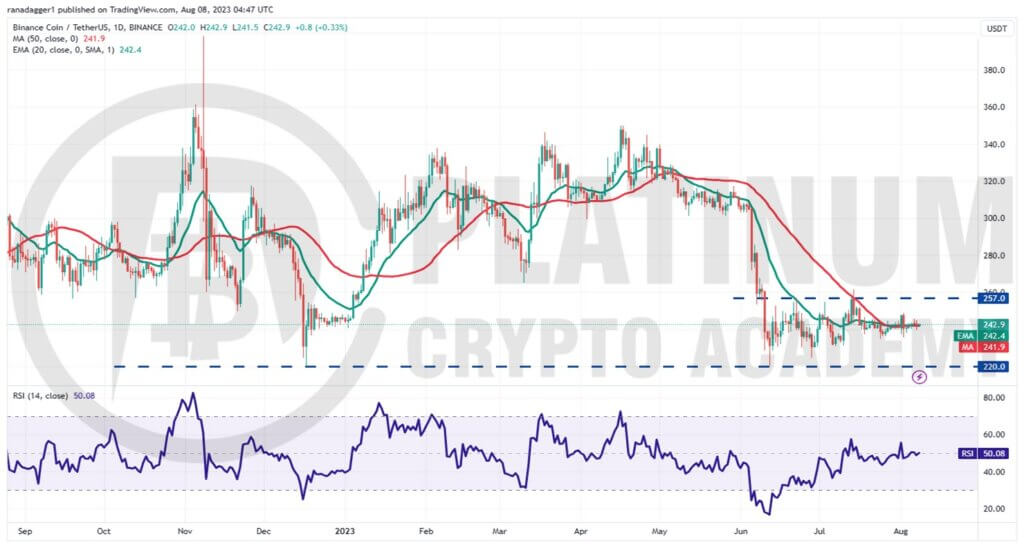
Binance Coin has been clinging to the moving averages for the past few days. This suggests uncertainty among the bulls and the bears about the next directional move.
Both moving averages are flat and the RSI is near the midpoint, indicating a balance between supply and demand. The BNB/USD pair could remain stuck inside the range between $220 and $257 for some time.
If bulls thrust the price above $257, it will suggest the start of a new up-move. The pair could first soar to $285 and subsequently to $305.
The vital support to watch on the downside is $220. If this level cracks, it will suggest that bears have overpowered the bulls. The pair could then descend to $183 where buyers could step in to arrest the decline.
XRP/USD Market Analysis
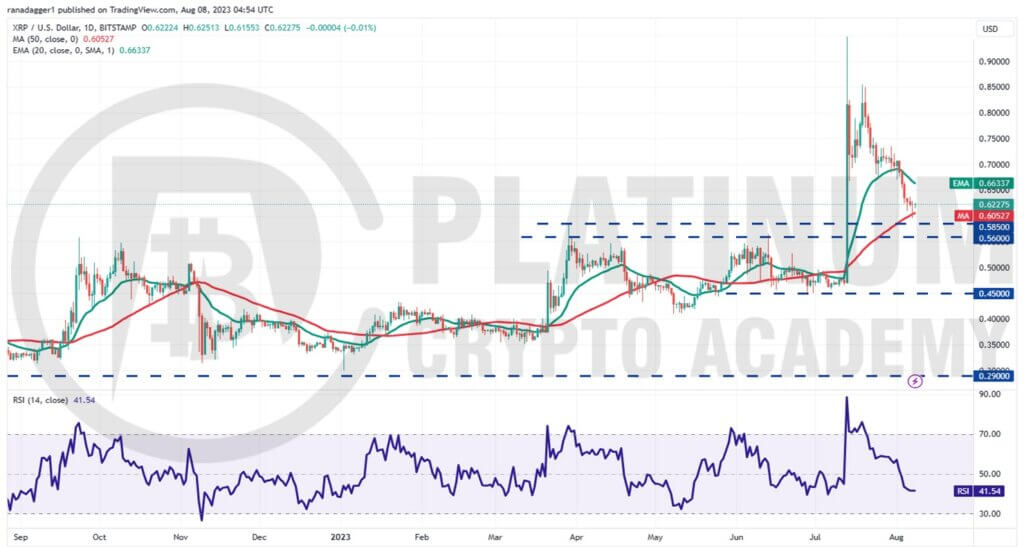
Generally, vertical rallies are followed by an equally sharp correction and that is what is seen in XRP. The XRP/USD pair soared to $0.94 on July 13 but the buyers could not continue the bullish momentum.
This may have tempted short-term traders to book profits. Buyers tried to stall the pullback at the 20-day EMA but the failure to achieve a strong rebound off it triggered another round of selling.
The pair has reached the support zone between $0.56 and $0.58. If the price rebounds off this zone, the bulls will again try to push the price above the 20-day EMA. If they succeed, the pair may climb to $0.74.
Contrarily, if the price turns down from the 20-day EMA, it will suggest that the sentiment has turned negative and traders are selling on rallies. That will increase the likelihood of a break below the support zone.
If that happens, the pair may complete a 100% retracement of the most recent leg of the rally and drop to $0.45.
ADA/USD Market Analysis
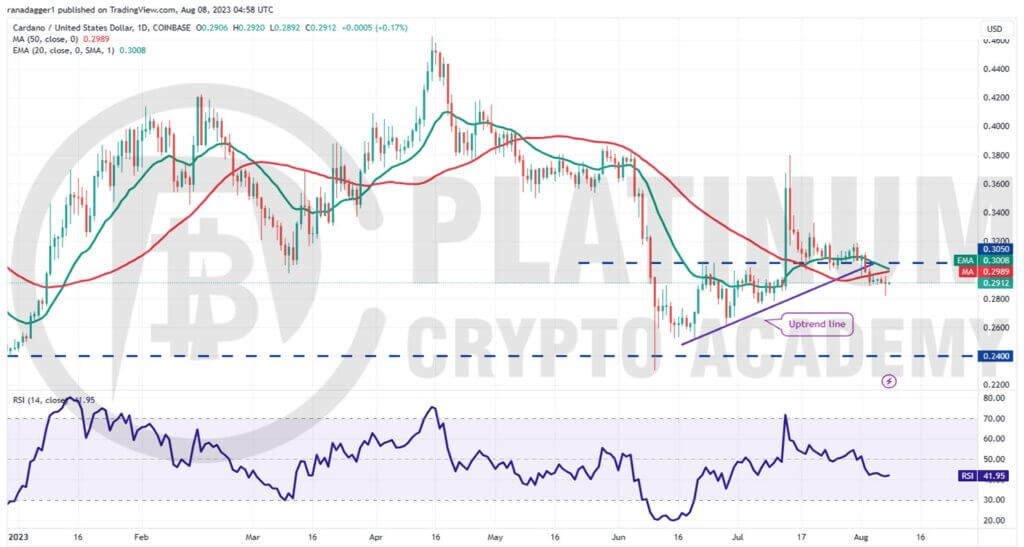
Cardano dropped near $0.28 on August 7, completely retracing the sharp up-move that happened on July 13. The 20-day EMA has started to turn down and the RSI is below 42, indicating that bears have the upper hand.
If the price plunges below the $0.28 support, it could start a deeper correction toward $0.26 and then $0.24. The bulls are expected to defend this level with vigor.
This negative view will invalidate in the near term if the bulls push and sustain the price above the moving averages. Such a move will indicate solid buying at lower levels.
The pair could first rise to $0.32 and then to $0.34. This level may again offer a strong resistance but if cleared, the pair could surge to $0.38.
Hopefully, you have enjoyed today’s article for further coverage please check out our crypto Blog Page. Thanks for reading! Have a fantastic day! Live from the Platinum Crypto Trading Floor.
Earnings Disclaimer: The information you’ll find in this article is for educational purpose only. We make no promise or guarantee of income or earnings. You have to do some work, use your best judgement and perform due diligence before using the information in this article. Your success is still up to you. Nothing in this article is intended to be professional, legal, financial and/or accounting advice. Always seek competent advice from professionals in these matters. If you break the city or other local laws, we will not be held liable for any damages you incur.
