
Bitcoin’s price dipped below $26,000 on May 25 but quickly recovered and soared above $28,000 on May 29. The rally was triggered by reports that a tentative deal was reached between the White House and congressional Republicans. This was important because, without a deal, the United States was staring at a debt default in early June, which would have been catastrophic for the US and the global economy.
After the initial euphoria of the deal, traders are likely to shift focus on the interest rate hikes. The US dollar which generally moves in inverse correlation to Bitcoin has made a smart recovery in the past few days.
Expectations are rife that the Federal Reserve will hike rates in its next meeting on June 13 and 14. The probability of a 25 basis points rate hike has increased from 25.7% last week to 57.3%, according to the FedWatch Tool.
However, things could change over the next few days depending on the payroll report on June 2 and the Consumer Price Index data on June 13. If the Fed raises rates, it is likely to be negative for risky assets such as US equities and the cryptocurrency markets. But if the Fed remains in a pause mode, the markets may witness a relief rally.
The institutional investors have been cautious over the past few weeks. CoinShares Digital Asset Fund Flows Weekly Report released on May 22 shows five consecutive weeks of outflows from digital asset investment products totaling $232 million.
However, it is not all bearish because Bitcoin’s long-term investors remain in HODL mode. Glassnode’s “Hodled and Lost Coins” metric has risen to its highest level since May 2018. This shows that Bitcoin’s supply continues to decrease, which could boost prices higher as demand picks up.
What are the important support and resistance levels to watch out for? Let’s study the charts of Bitcoin and the major altcoins to find out.
BTC/USD Market Analysis
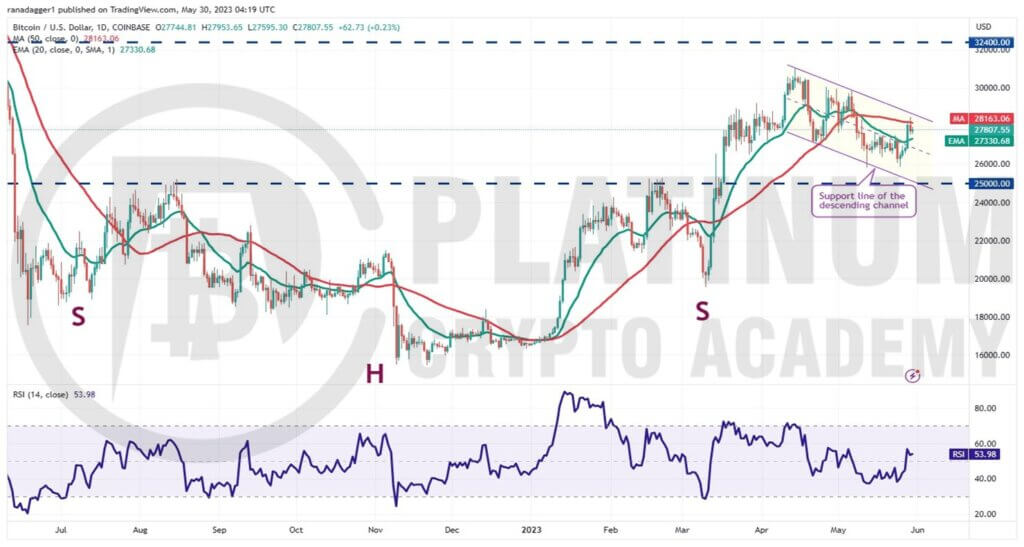
Bitcoin dropped to $25,864 on May 25 but the long tail on the day’s candlestick shows strong buying at lower levels.
The bulls continued their purchase and propelled the price above the 20-day exponential moving average (EMA) on May 28. This suggests that the bearish momentum is weakening.
Buyers will try to further strengthen their position by driving the price above the descending channel pattern. If they succeed, it will suggest that the corrective phase is over.
The BTC/USD pair could first rise to the psychological resistance of $30,000 and then to $31,050.
Contrarily, if the price turns down and breaks below the 20-day EMA, it will suggest that the pair may extend its stay inside the channel for some more time.
On the downside, a break below the $25,810 support could open the doors for a fall to $25,000. This remains the key level to watch out for because a break below it will tilt the advantage in favor of the bears.
ETH/USD Market Analysis
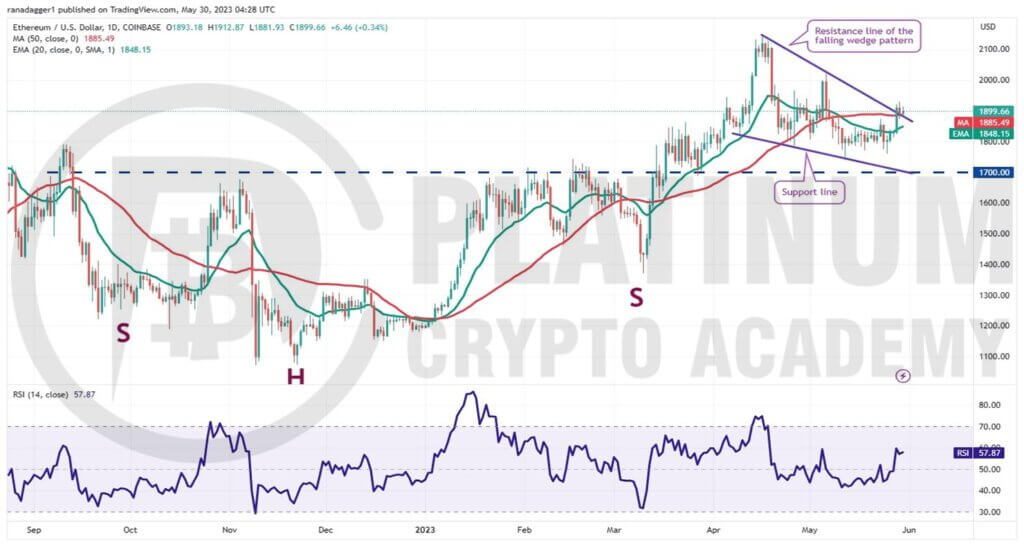
Ether’s price action of the past few days formed a falling wedge pattern, which usually acts as a bullish setup. Buyers pushed the price above the wedge on May 28, which is the first indication that the ETH/USD pair may be ready for an upswing.
The bears tried to trap the aggressive bulls by pulling the price back into the wedge on May 29 but the bulls held their ground.
The rising 20-day EMA and the relative strength index (RSI) in the positive territory indicate that bulls have the upper hand.
If buyers propel the price above $1,929, the pair could first rally to the psychological level of $2,000 and then dash toward $2,143. A break above this level will signal the resumption of the up-move.
This positive view will invalidate in the near term if bears yank the price below the 20-day EMA. In such a case, the pair may plummet to the crucial support at $1,700.
BNB/USD Market Analysis
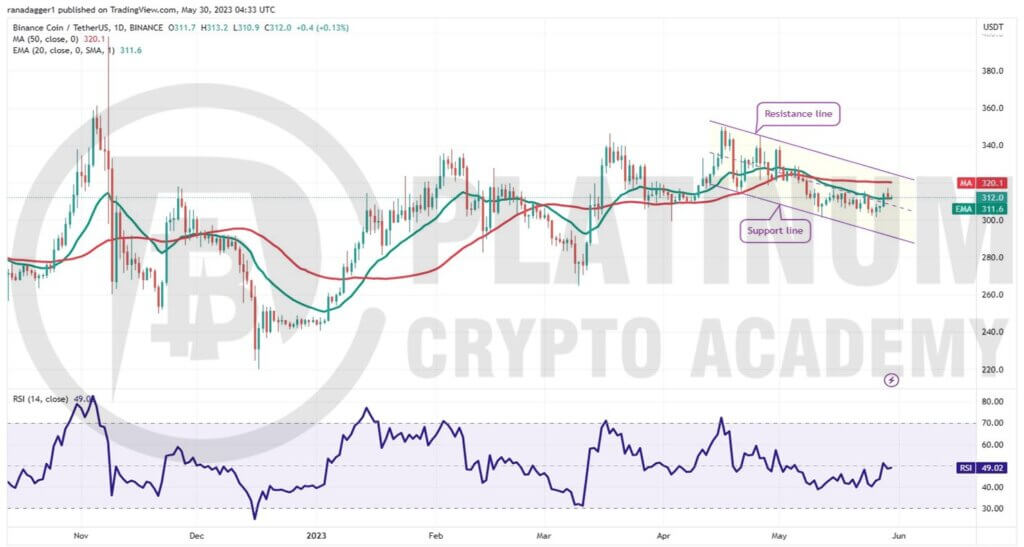
Binance Coin continues to trade inside a descending channel pattern. After staying below the 20-day EMA for several days, the BNB/USD pair rose above the resistance on May 28.
However, the bulls are struggling to sustain the higher levels, indicating that the bears are selling on rallies. The 20-day EMA is flattening out and the RSI is near the midpoint, indicating a balance between supply and demand.
The critical support to watch on the downside is $300. If this level cracks, the pair may drop to the support line near $290. This level is likely to witness buying by the bulls.
On the upside, the bulls will have to clear the barrier at the resistance line to signal the start of a new up-move. The pair may then attempt a rally to $350.
XRP/USD Market Analysis
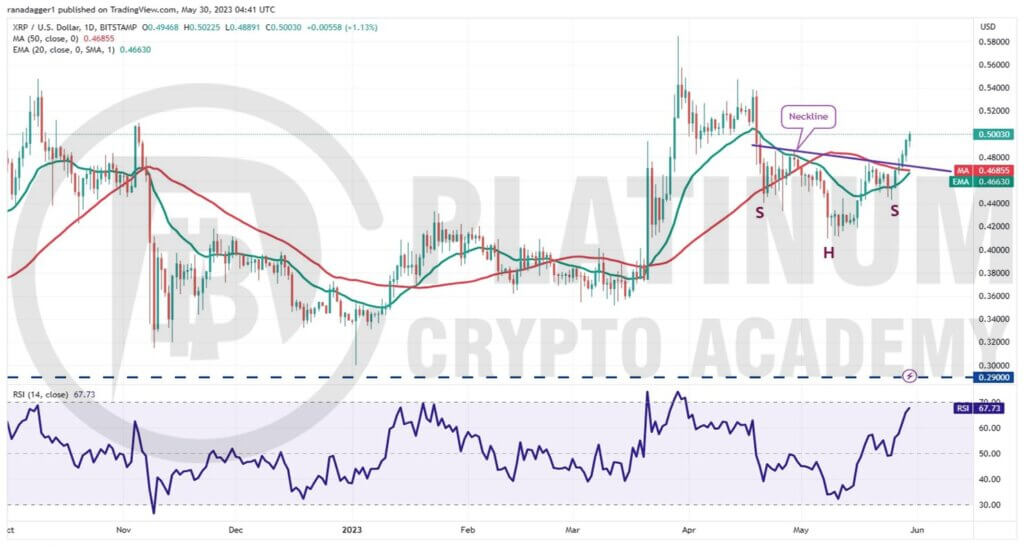
The failure of the bears to sink the price below the $0.40 support started a recovery in XRP on May 16. The bulls strengthened their position further by pushing the price above the 20-day EMA on May 17.
The 50-day simple moving average (SMA) acted as a stiff resistance but the bulls held on to the 20-day EMA on the downside.
This indicated a change in sentiment from selling on rallies to buying on dips. The price action of the past few days formed a bullish inverse head and shoulders pattern, which completed with a break above the neckline on May 28
The moving averages are close to completing a bullish crossover and the RSI is near the overbought zone, indicating that buyers are in command. The XRP/USD pair may first rally to $0.54 and then try to surge to $0.58.
This positive view will be negated in the near term if the price turns down from the current level and nosedives below the zone between the neckline and $0.44.
ADA/USD Market Analysis
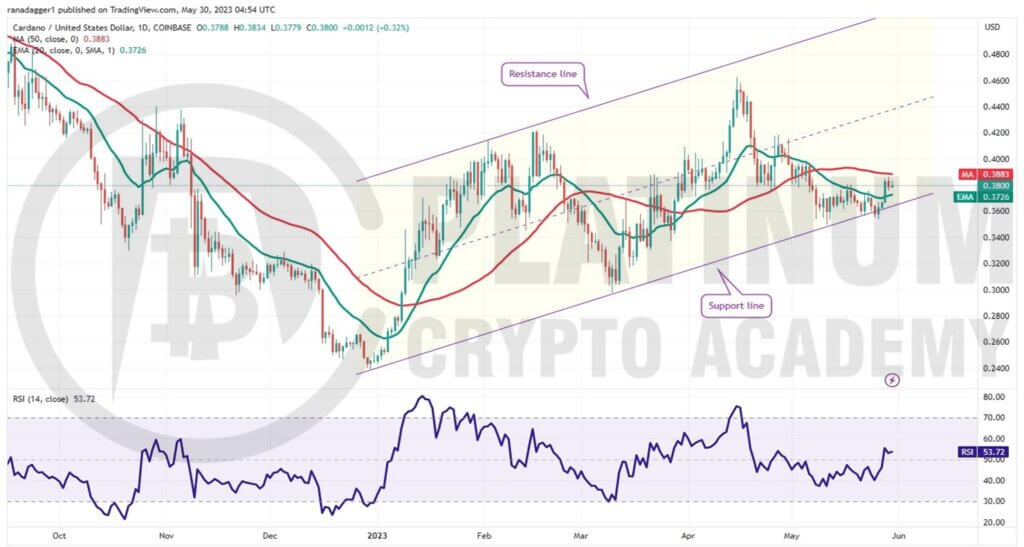
Cardano has been rising inside an ascending channel pattern for the past several days. Traders generally buy the dip to the support line of the channel and sell near the resistance.
The bears yanked the price below the support line on May 25 but they could not sustain the lower levels. Strong buying by the bulls pushed the price back into the channel on May 26.
The bulls continued their purchase and pushed the price above the 20-day EMA on May 28. The bears are trying to stall the recovery at the 50-day SMA but if bulls do not allow the price to dip back below the 20-day EMA, it will improve the prospects of an upside breakout.
Above the 50-day SMA, the ADA/USD pair could climb to $0.42. Contrary to this assumption, if the price turns down sharply and breaks below $0.35, it will signal the start of a new downward move. The pair could then tumble to the next support at $0.30.
Hopefully, you have enjoyed today’s article for further coverage please check out our crypto Blog Page. Thanks for reading! Have a fantastic day! Live from the Platinum Crypto Trading Floor.
Earnings Disclaimer: The information you’ll find in this article is for educational purpose only. We make no promise or guarantee of income or earnings. You have to do some work, use your best judgement and perform due diligence before using the information in this article. Your success is still up to you. Nothing in this article is intended to be professional, legal, financial and/or accounting advice. Always seek competent advice from professionals in these matters. If you break the city or other local laws, we will not be held liable for any damages you incur.
