As regular readers will know we provide Cryptocurrency market analysis weekly here but it has been some time since we have been able to provide such a positive fundamental view starting with American billionaire Stanley Druckenmiller revealed on CNBC that he has purchased Bitcoin but did not specify the quantity.
Druckenmiller said that he holds much more gold than Bitcoin, but he believes that if “the gold bet works, the Bitcoin bet will probably work better because it’s thinner, more illiquid and has a lot more beta to it.”
In another positive for Bitcoin, legendary investor Bill Miller told CNBC: “I think every major bank, every major investment bank, every major high net worth firm is going to eventually have some exposure to bitcoin or what’s like it.” Miller also advised investors who don’t own any Bitcoin to buy at the current prices.
CRYPTOCURRENCY MARKET ANALYSIS WEEKLY UPDATE – FUNDAMENTAL VIEW
A report by JPMorgan’s Global Markets Strategy team highlighted increased demand for Bitcoin from institutional investors such as family offices and asset managers, as seen in the strong inflow into Grayscale Bitcoin Trust. The authors of the report also pointed out that family offices that previously invested in gold may be looking to shift to Bitcoin.
While many famous investors are turning towards Bitcoin, economist Nouriel Roubini said that the next big revolution would be the Central Bank Digital Currencies (CBDCs). Roubini expects CBDCs to crowd out digital payment systems.
These bullish projections by analysts are a long-term play. However, what is the short-term picture? Is the path of the least resistance to the upside or the downside? Let’s study the charts of the top-5 cryptocurrencies to find out.
CRYPTOCURRENCY MARKET ANALYSIS WEEKLY UPDATE – HOW TO TRADE BTC/USD
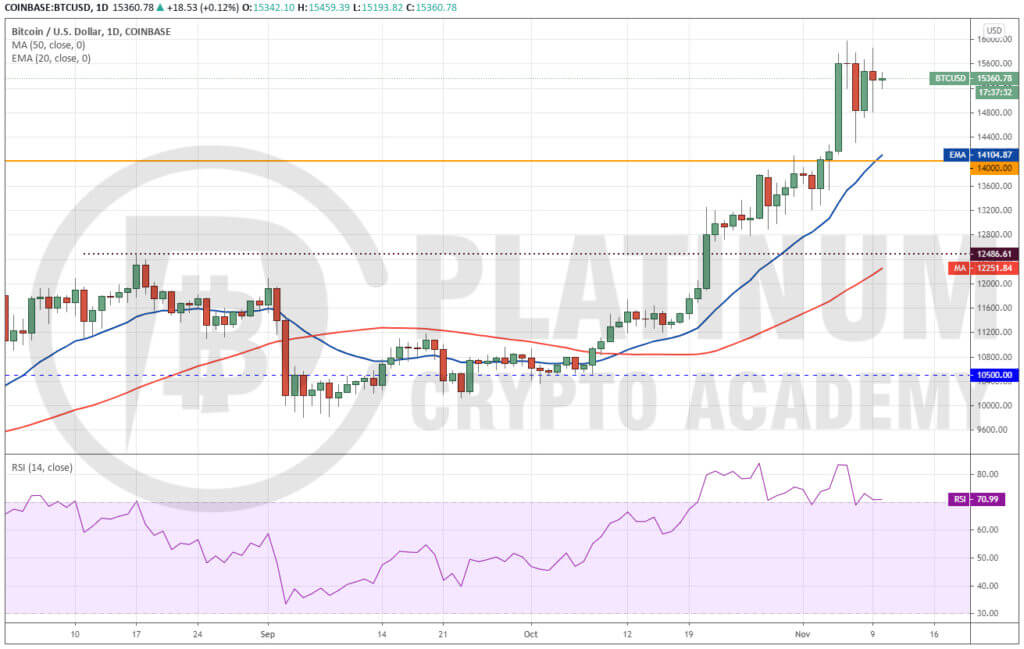
On last week’s Cryptocurrency market analysis weekly update, we were anticipating strong resistance at $14,000 from the bears. Hence, we had recommended booking profits on 80% of the long positions. However, that did not happen.
Bitcoin price chart surged on November 5 and hit an intraday high of $15,977.67 on November 6. The bears attempted to drag the price down sharply on November 7, but the bulls purchased aggressively at lower levels.
This shows that the buyers are accumulating on dips. Our Cryptocurrency market analysis highlights, after the sharp rally in the past few days, we expect the Bitcoin price chart to enter a consolidation or a minor correction.
If the bulls do not give up much ground in the next few days, the possibility of a rally above $16,000 increases. If that happens, the pair may surge to $17,200 and then to the lifetime highs.
The upsloping moving averages and the RSI near the overhead resistance suggest an advantage to the bulls.
This view will be invalidated if the pair turns down from the current levels and plummets below $14,000. Such a move could tilt the advantage in favour of the bears.
Traders who have 20% of positions remaining could trail the stop-loss below the 20-day EMA. We do not see any fresh buying opportunity at the current levels.
CRYPTOCURRENCY MARKET ANALYSIS WEEKLY UPDATE – HOW TO TRADE ETH/USD
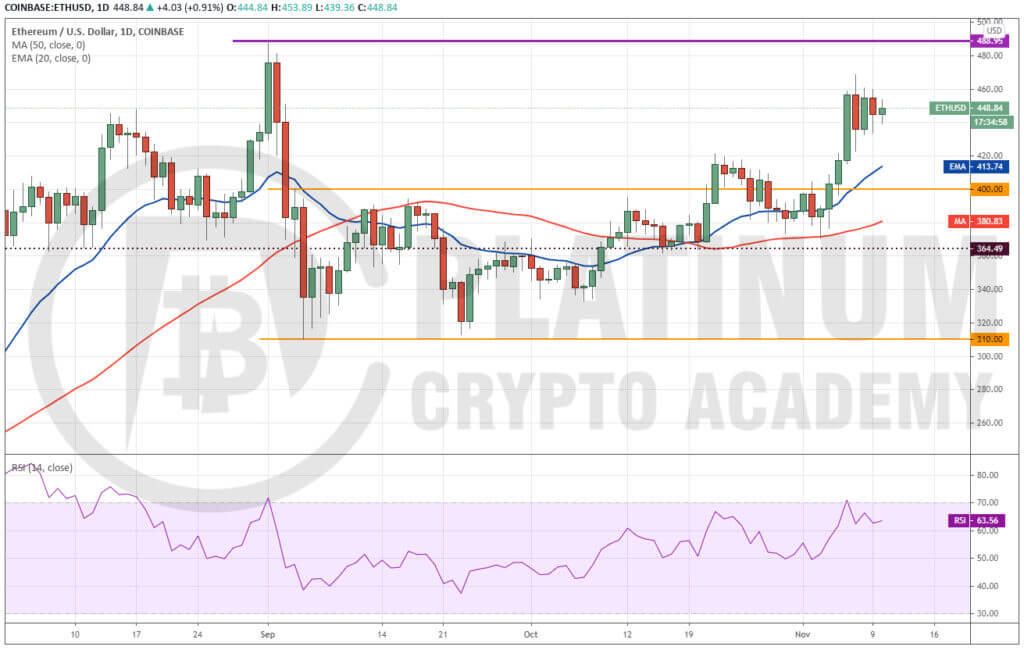
The Ethereum price chart bounced off the 50-day SMA on November 3 and rallied to a high of $468.98 on November 7. Last week’s Cryptocurrency market analysis weekly update indicated to Traders who have been holding half of their positions purchased on our earlier recommendation are now sitting on profits.
The bears attempted to drag the Ethereum price chart lower on November 7 but the ETH/USD pair bounced right back up on November 8. This shows strong buying on dips.
Both moving averages have started to turn up and the RSI is in the positive territory, which suggests that bulls have the upper hand. If they can propel the price above $470, the pair could move up to $488.95.
This level may again act as a stiff resistance; hence, traders can book profits on 50% of their remaining positions at this level and trail the rest with a suitable stop-loss.
We are not suggesting to book complete profits because if the momentum picks up and the bulls scale this resistance, the pair could rally to $550.
This bullish view will be invalidated if the bears sink the price below the 20-day EMA. Such a move will suggest that sellers are back in the game.
RIPPLE MARKET ANALYSIS – HOW TO TRADE XRP/USD
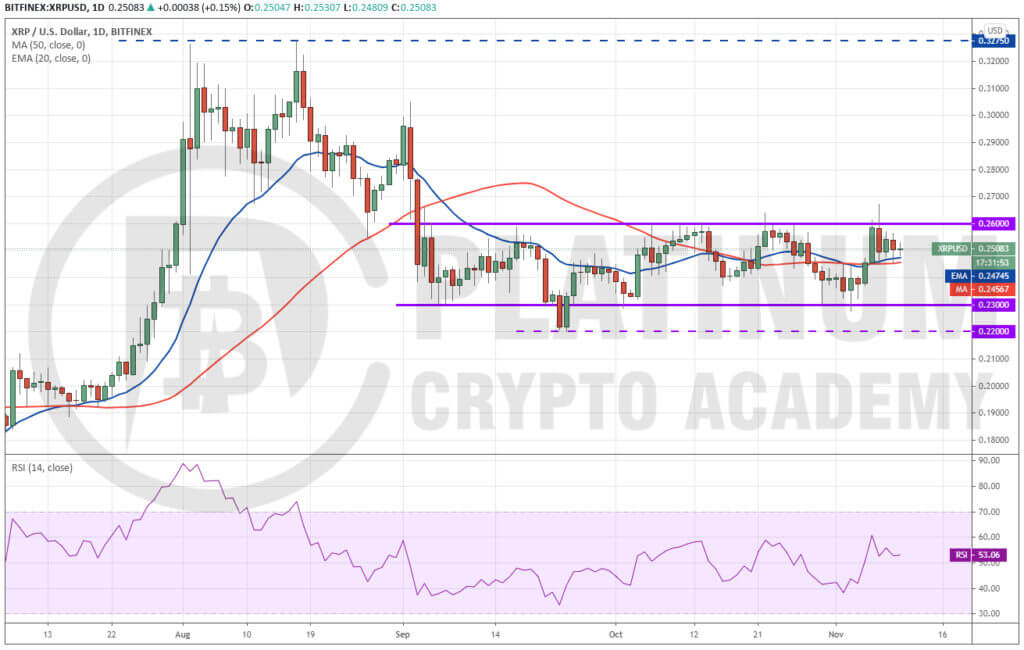
Although in last week’s Cryptocurrency market analysis weekly update we did not recommend a trade in XRP, we had mentioned that repeated failure by the bears to sink the price below $0.23 could offer a buying opportunity because then, the bulls will try to carry the price back to $0.26.
And that is what happened. After failing to sink the XRP price chart below $0.23 on November 3 and 4, the bulls pushed the price above $0.26 on November 7, but could not sustain the breakout. This suggests strong selling by the bears at higher levels.
However, the bulls have been defending the moving averages for the past four days, which is a positive sign.
They are now likely to make one more attempt to drive the price above $0.26. If they can sustain the breakout, the pair could rally to $0.30 and then to $0.3275.
Therefore, traders can buy if the XRP price chart sustains above $0.26 for a few hours. The stop-loss for this trade could be kept below the moving averages.
This bullish view will be invalidated if the bears sink the XRP price chart below the moving averages. The bears will then try to break the $0.23 to $0.22 support zone once again.
CRYPTOCURRENCY MARKET ANALYSIS WEEKLY UPDATE – HOW TO TRADE BCH/USD
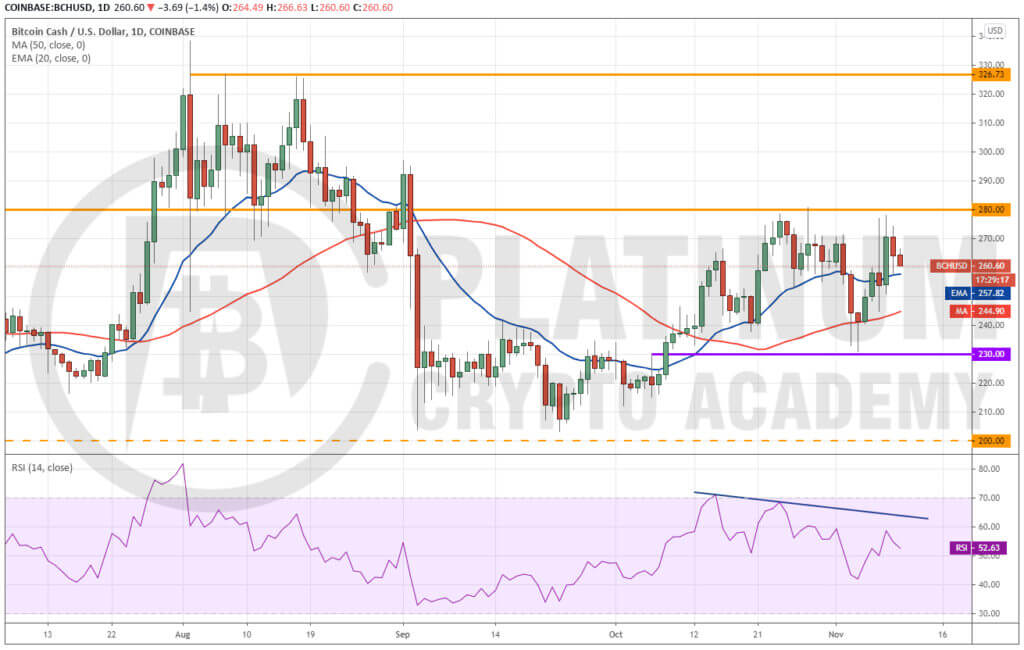
The failure of the bears to capitalise on the break below the 50-day SMA on November 3 and 4 attracted buying from the bulls who pushed the price to an intraday high of $278.29 on November 8.
However, the bears are unwilling to give up without a fight. They are currently attempting to sink the price below the 20-day EMA. If they succeed, the pair could drop to the 50-day SMA.
Conversely, if the BCH/USD pair rebounds off the current levels and rises above the $280 resistance, then a rally to $326.73 is possible.
Both moving averages are gradually sloping up and the RSI is in the positive zone, which suggests a minor advantage to the bulls.
Traders can consider long positions if the price sustains above $280 for a few hours. The stop-loss for this trade may be kept at $255.
Another buying opportunity could arise if the price rebounds sharply from $230. Such a move will suggest that the pair may remain range-bound between $230 and $280 for a few days.
CHAINLINK MARKET ANALYSIS – HOW TO TRADE LINK/USD
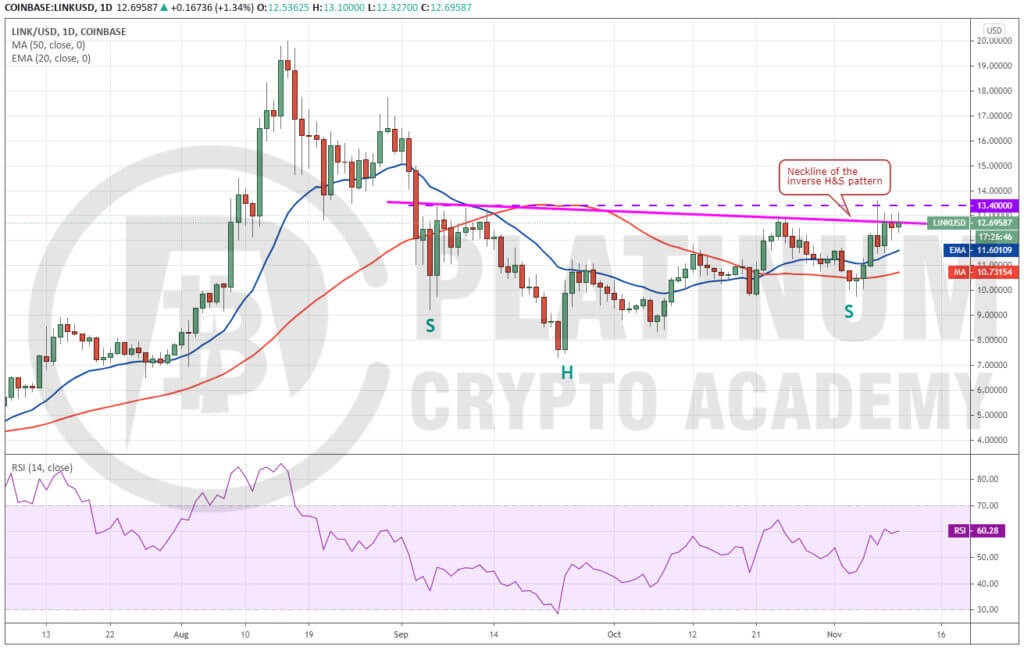
Chainlink broke below the 50-day SMA on November 3 and 4 but the bears could not sustain the lower levels. That could have attracted buying from the bulls who have pushed the price back to the overhead resistance at $13.40.
The LINK/USD pair has formed an inverse head and shoulders pattern, which will complete on a breakout and close (UTC time) above the neckline of the setup. This pattern has a target objective of $19.488.
Therefore, traders can buy after the price sustains above $13.40 for a few hours. The stop-loss for the trade can be kept at $9.75.
This bullish view will be invalidated if the pair turns down from the current levels and plummets below $9.75. Such a move could drag the price down to $8.35 and then to $7.40.
Hopefully, you have enjoyed today’s article.
Thanks for reading! Have a fantastic day! Live from the Platinum Crypto Trading Floor.
Earnings Disclaimer: The information you’ll find in this article is for educational purpose only. We make no promise or guarantee of income or earnings. You have to do some work, use your best judgement and perform due diligence before using the information in this article. Your success is still up to you. Nothing in this article is intended to be professional, legal, financial and/or accounting advice. Always seek competent advice from professionals in these matters. If you break the city or other local laws, we will not be held liable for any damages you incur.
")